

Get your buying list ready Galeanu Mihai
Don’t Fear Fed’s Jawbone
The Fed has talked tough about inflation. Numerous pundits burnished the Fed’s inflation fighting reputation, claiming the Fed aggressively pushed rates higher and is willing to risk recession and job losses to bring inflation in check.
In reality, changes in the Fed Funds rate tend to follow changes in the 3-month T-Bill rate by about four weeks. The Fed has not pushed rates higher by raising the Fed Funds rate, they have responded to a rising tide of the T-Bill yield. In reality, they have resisted the rising tide of the T-Bill yield more than any time since the 1960s.
Economic Leads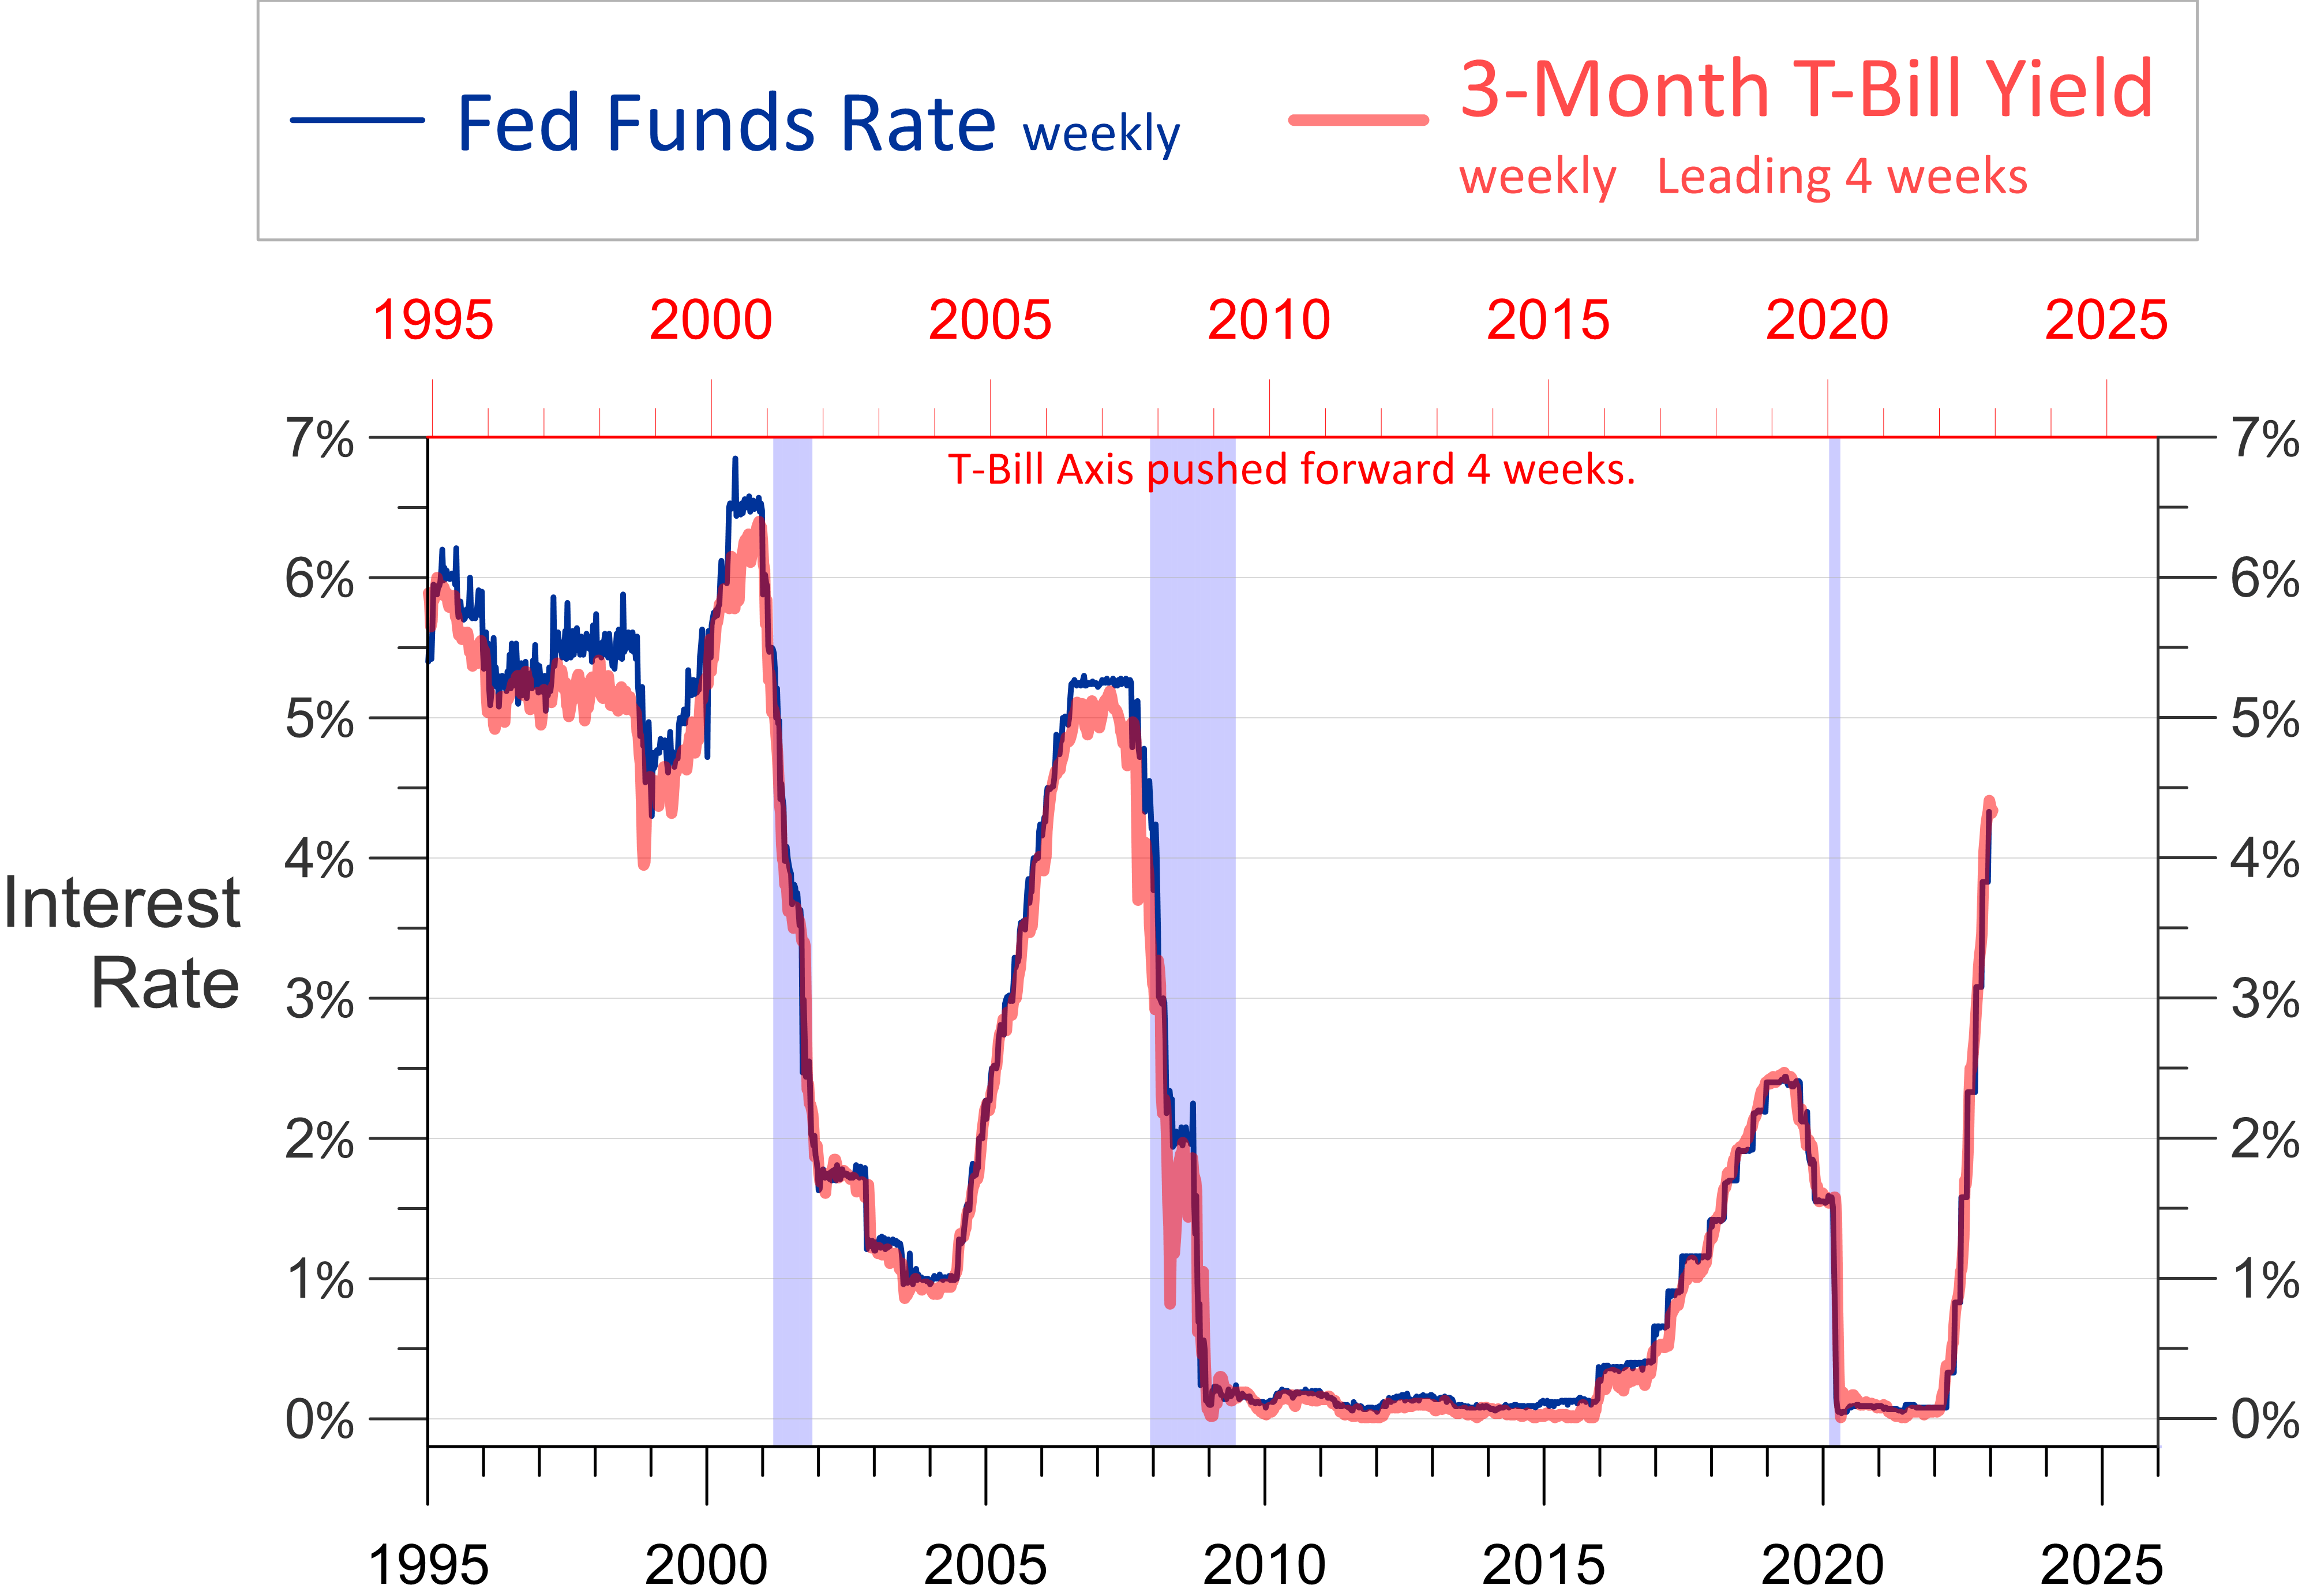
The 3-month T-Bill Yield may have hit its business cycle high three weeks ago. If it stops going up, the Fed will not increase the Fed Funds rate anymore during this business cycle.
Economic Leads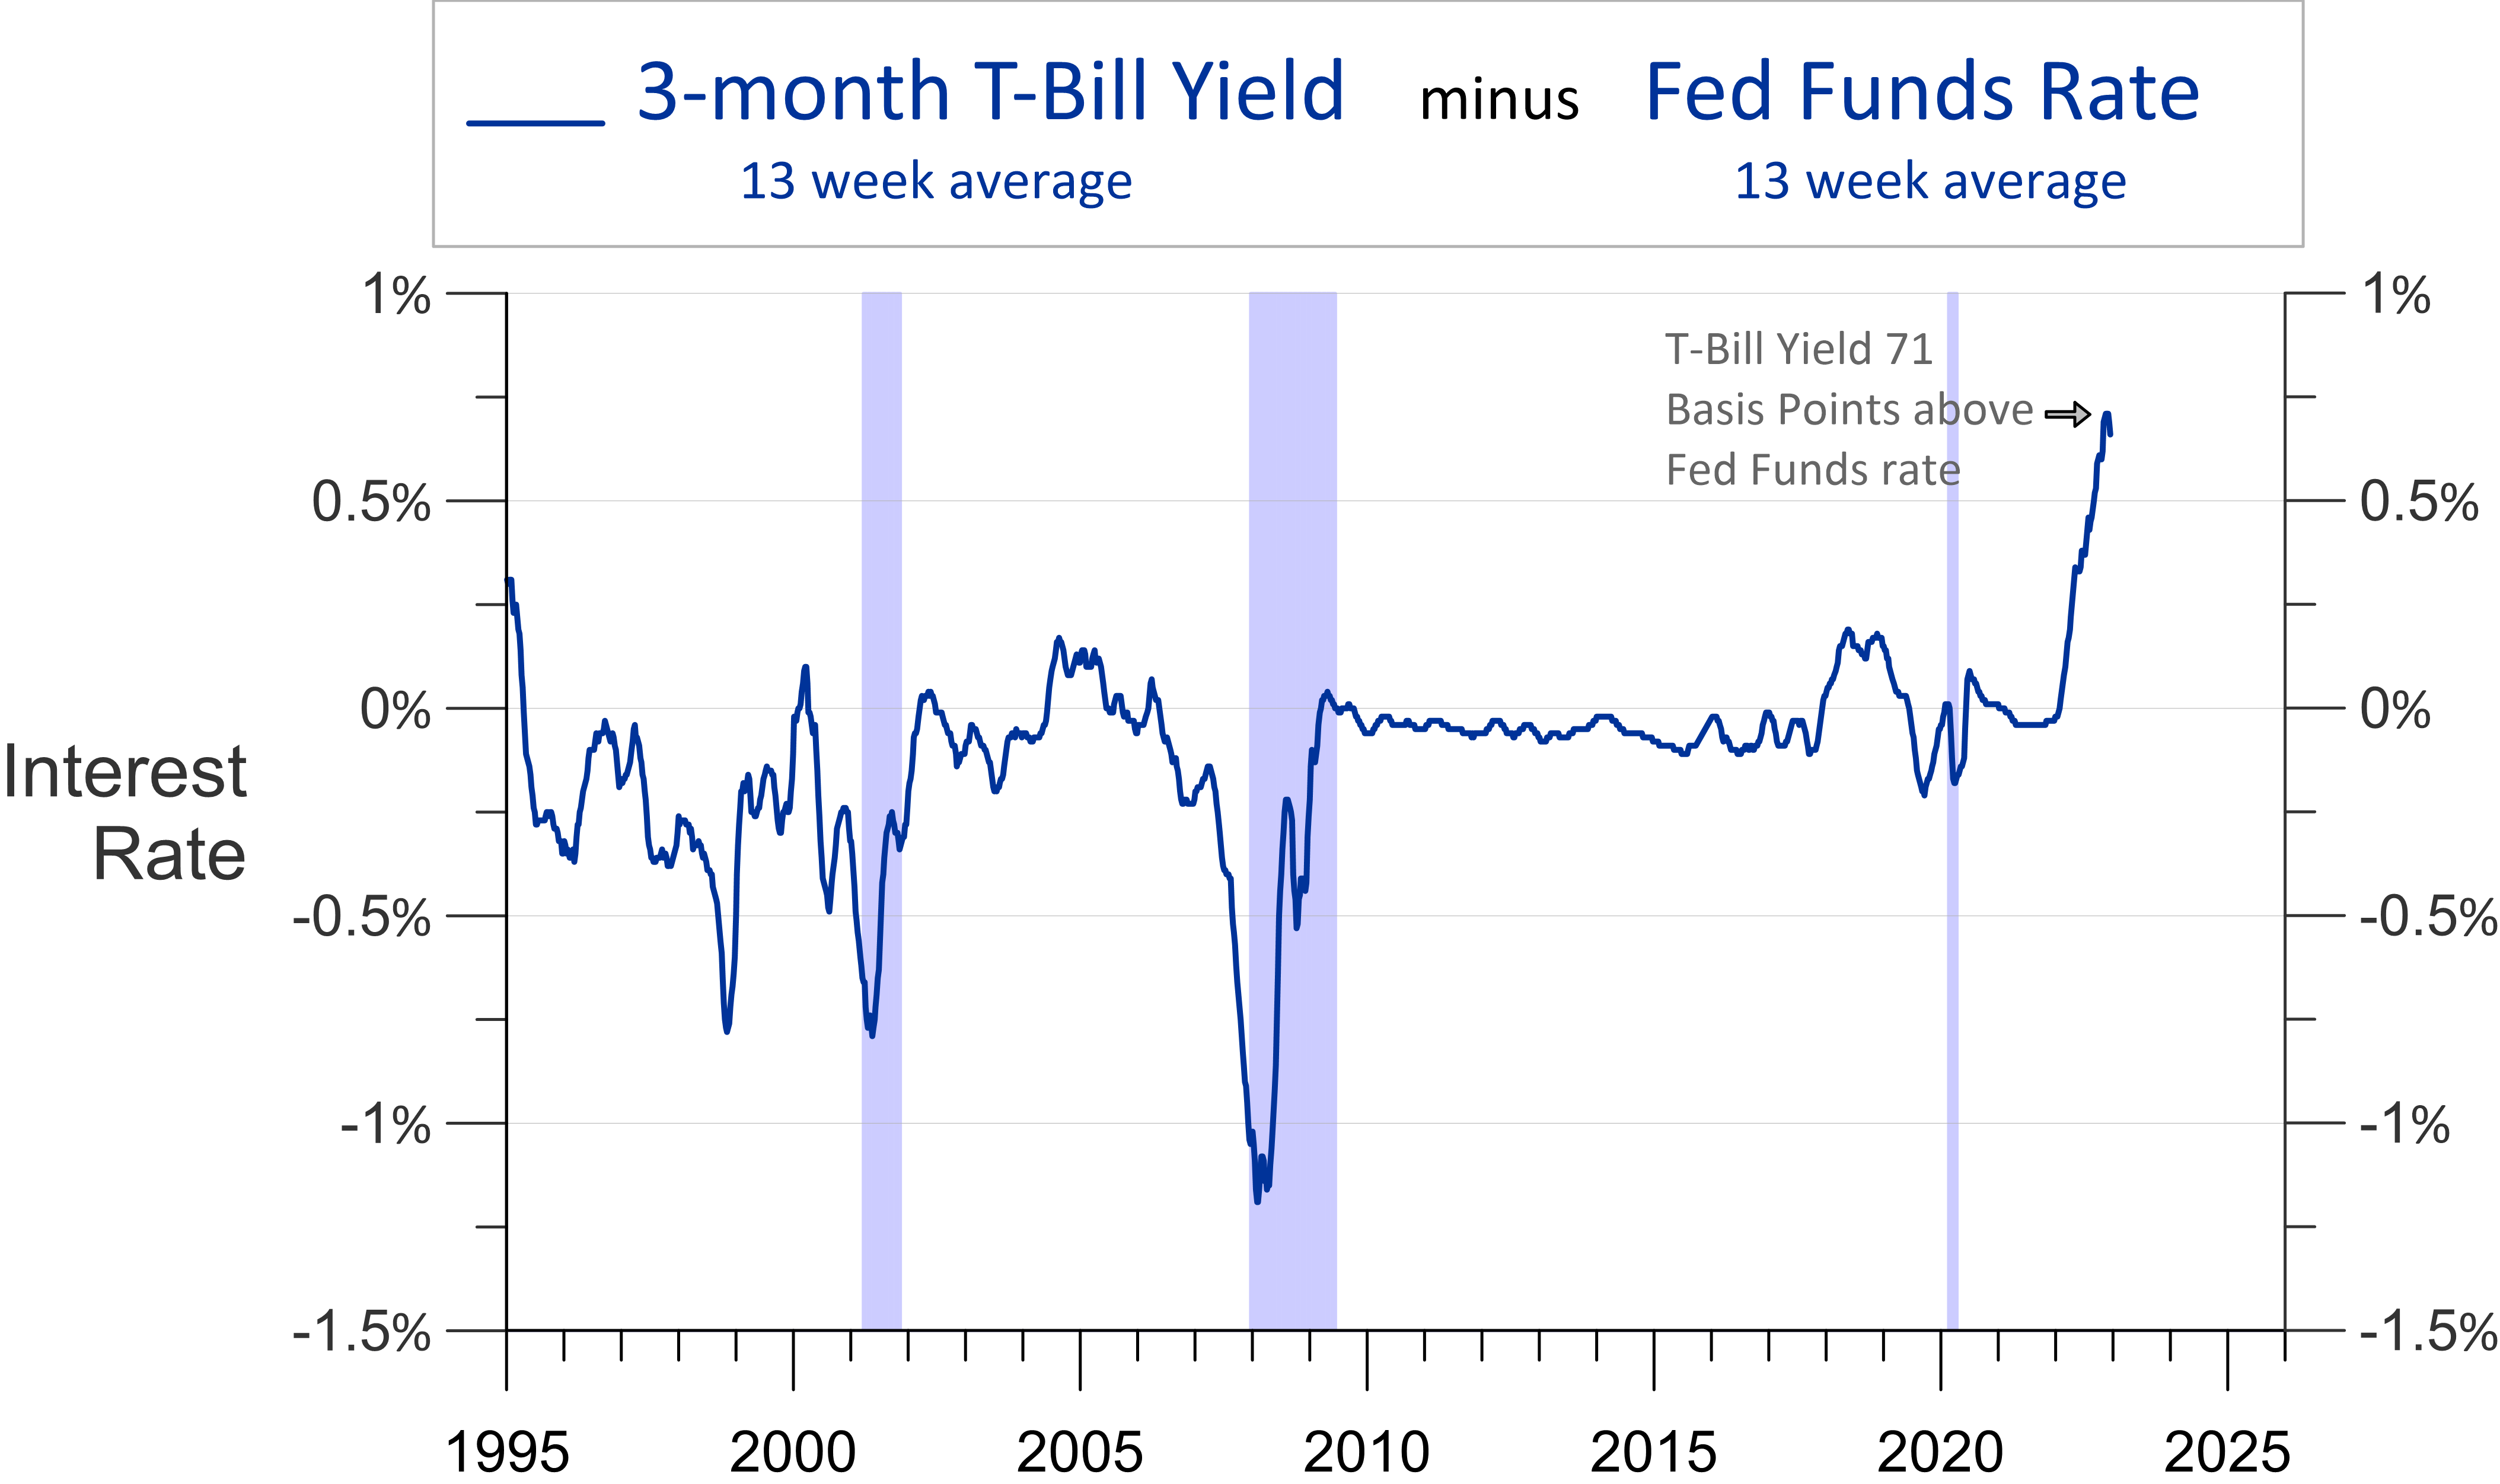
As the T-Bill yield soared in 2022 the Fed was raising the Fed Funds rate gingerly and more slowly. Three weeks ago, the 13-week average 3-month T-Bill yield was 71 basis points higher than the 13-week average Fed Funds rate. The last time the difference in the yields was this big was in the 1960s. The Fed has resisted rate increases more in 2022 than it has in decades.
High Inflation Retreating
The perception high inflation persists is an artifact of what happened prior to 6 months ago. In the last 5 monthly reports, the consumer price index (“CPI”) has trended higher at a rate of 2.5% (or 1.5% using non seasonally adjusted data). The 7 months prior to that went up at 10.6% rate or an 11.6% non-adjusted rate.
Economic Leads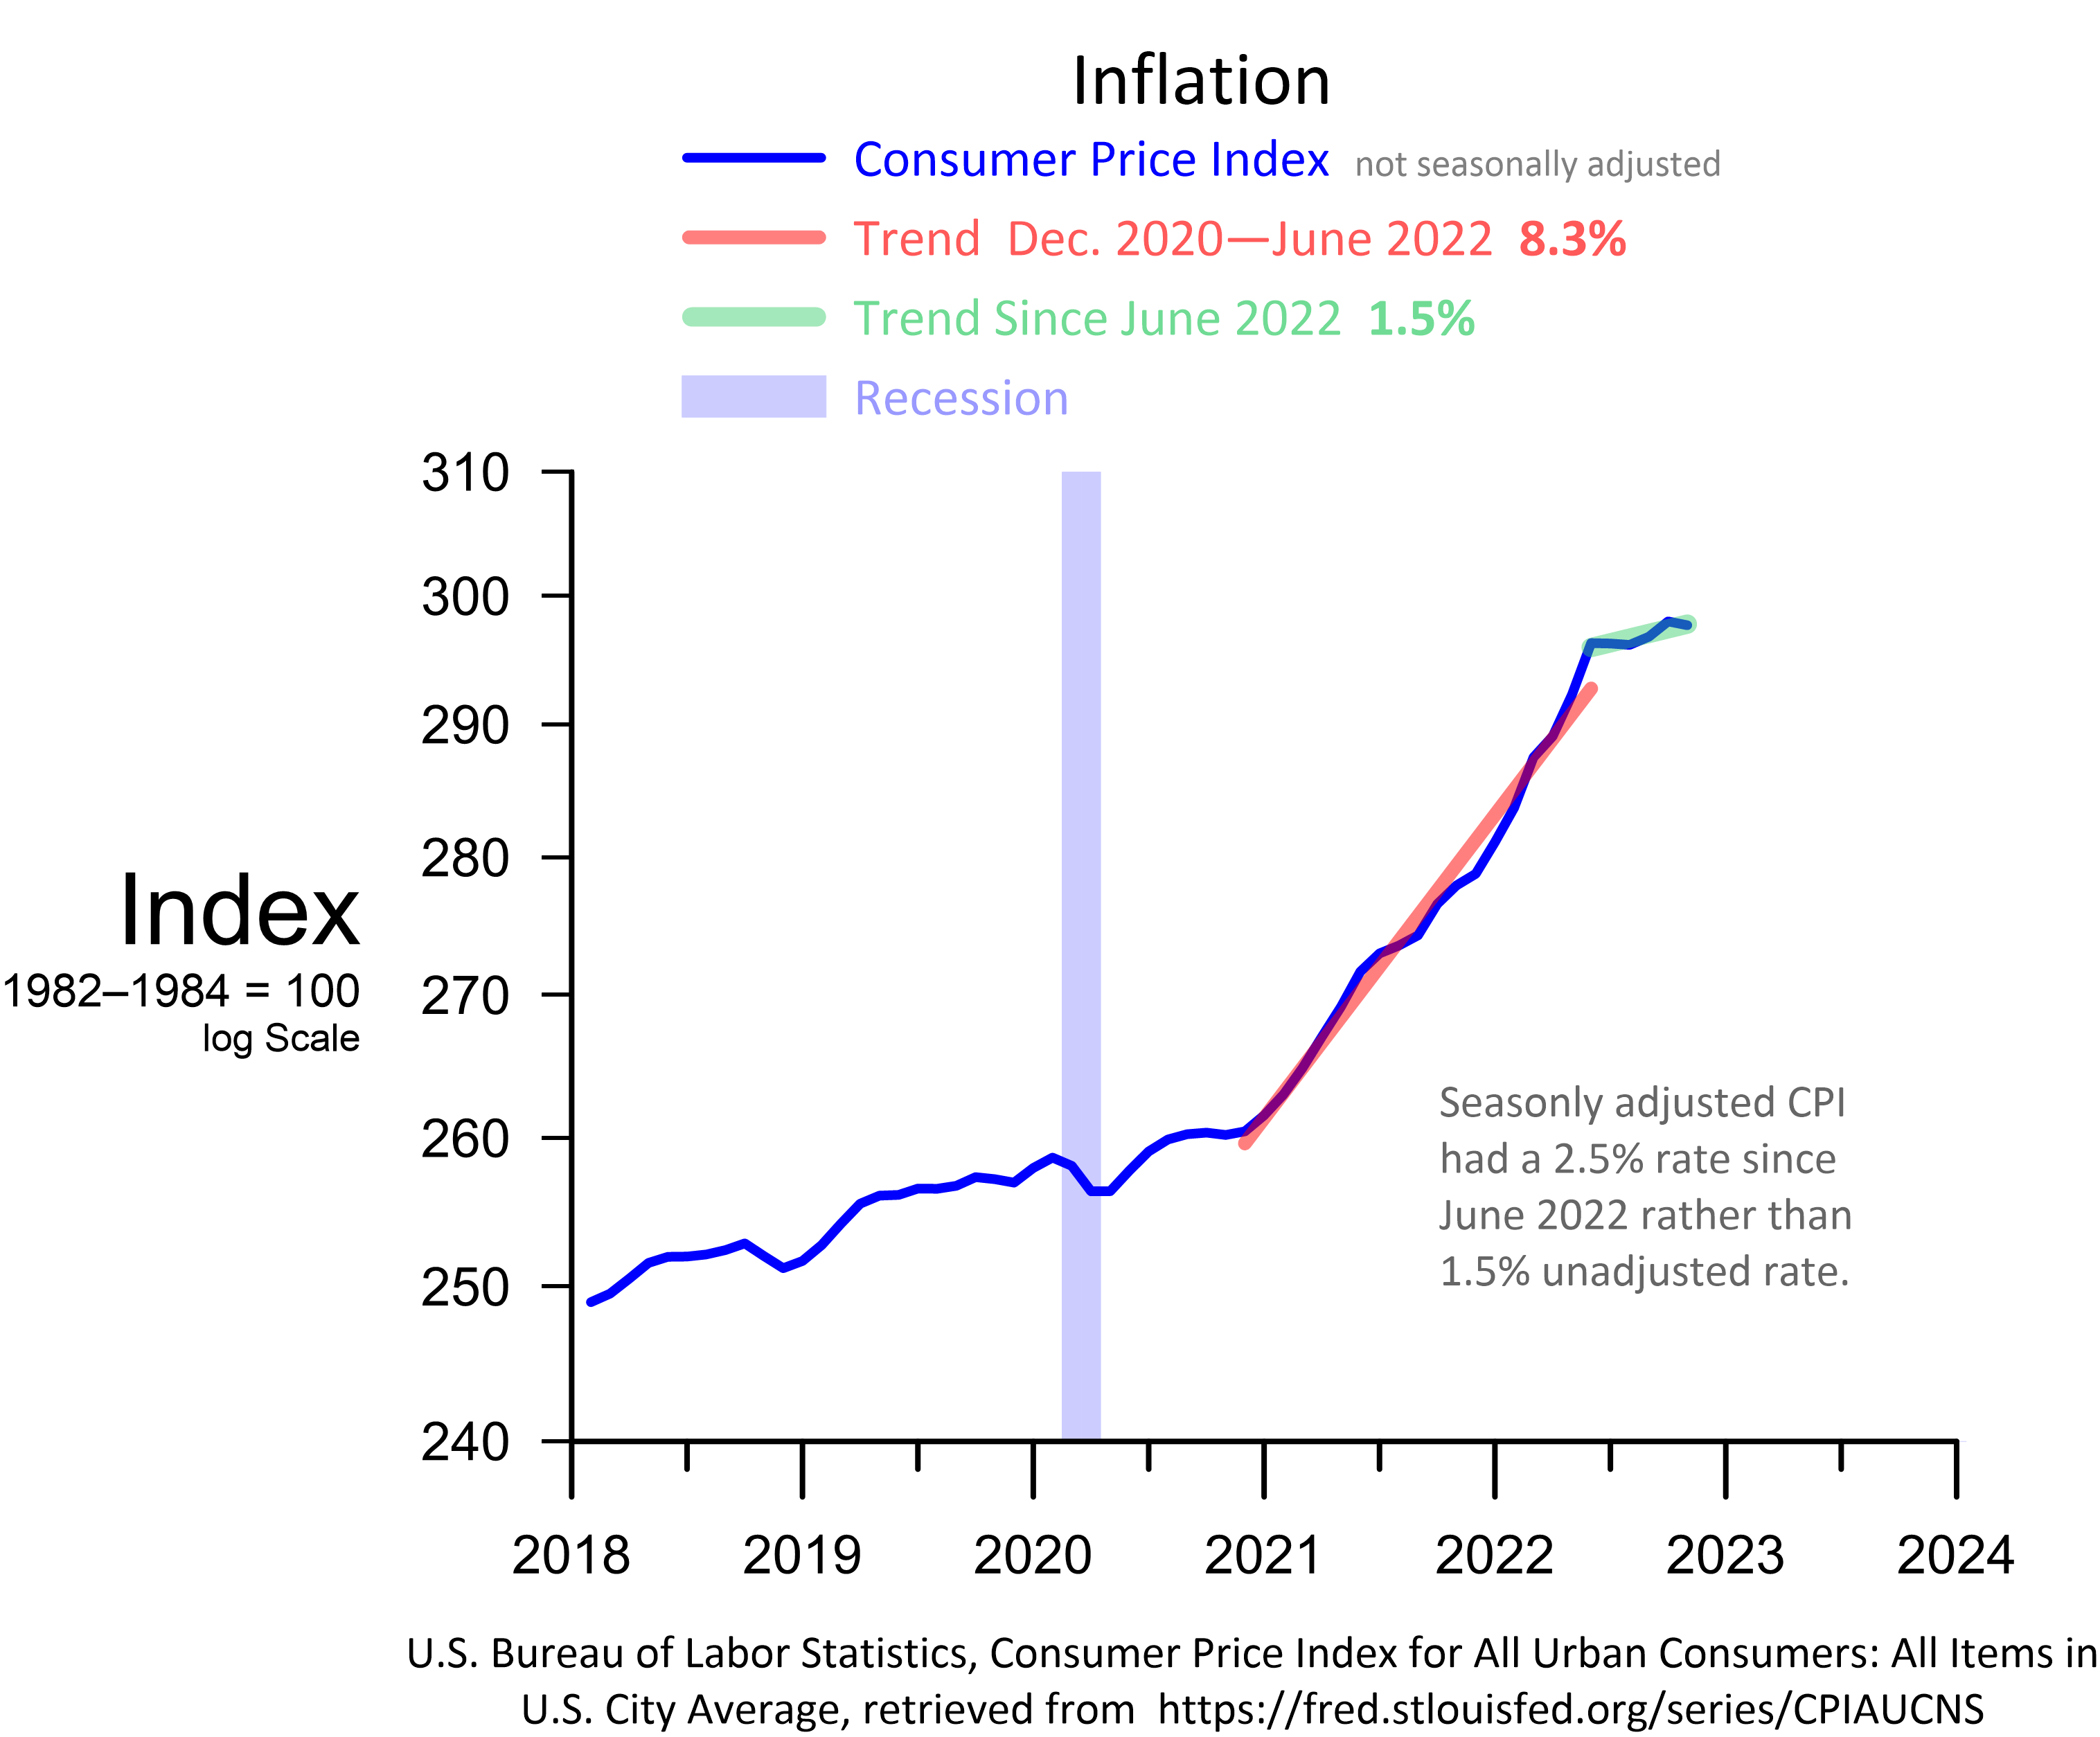
If the trend of the last five months reported continues for the next seven, the year-over-year CPI rate in June 2023 will be fairly close to the Fed’s target of 2%.
A 2% rate by June is probably too optimistic. While the full CPI is a good measure of the impact on households, the core rate that excludes food and energy is a better measure of the underlying inflation trend. The price index for personal consumption expenditures excluding food and energy probably shows the underlying inflation trend better than CPI.
Economic Leads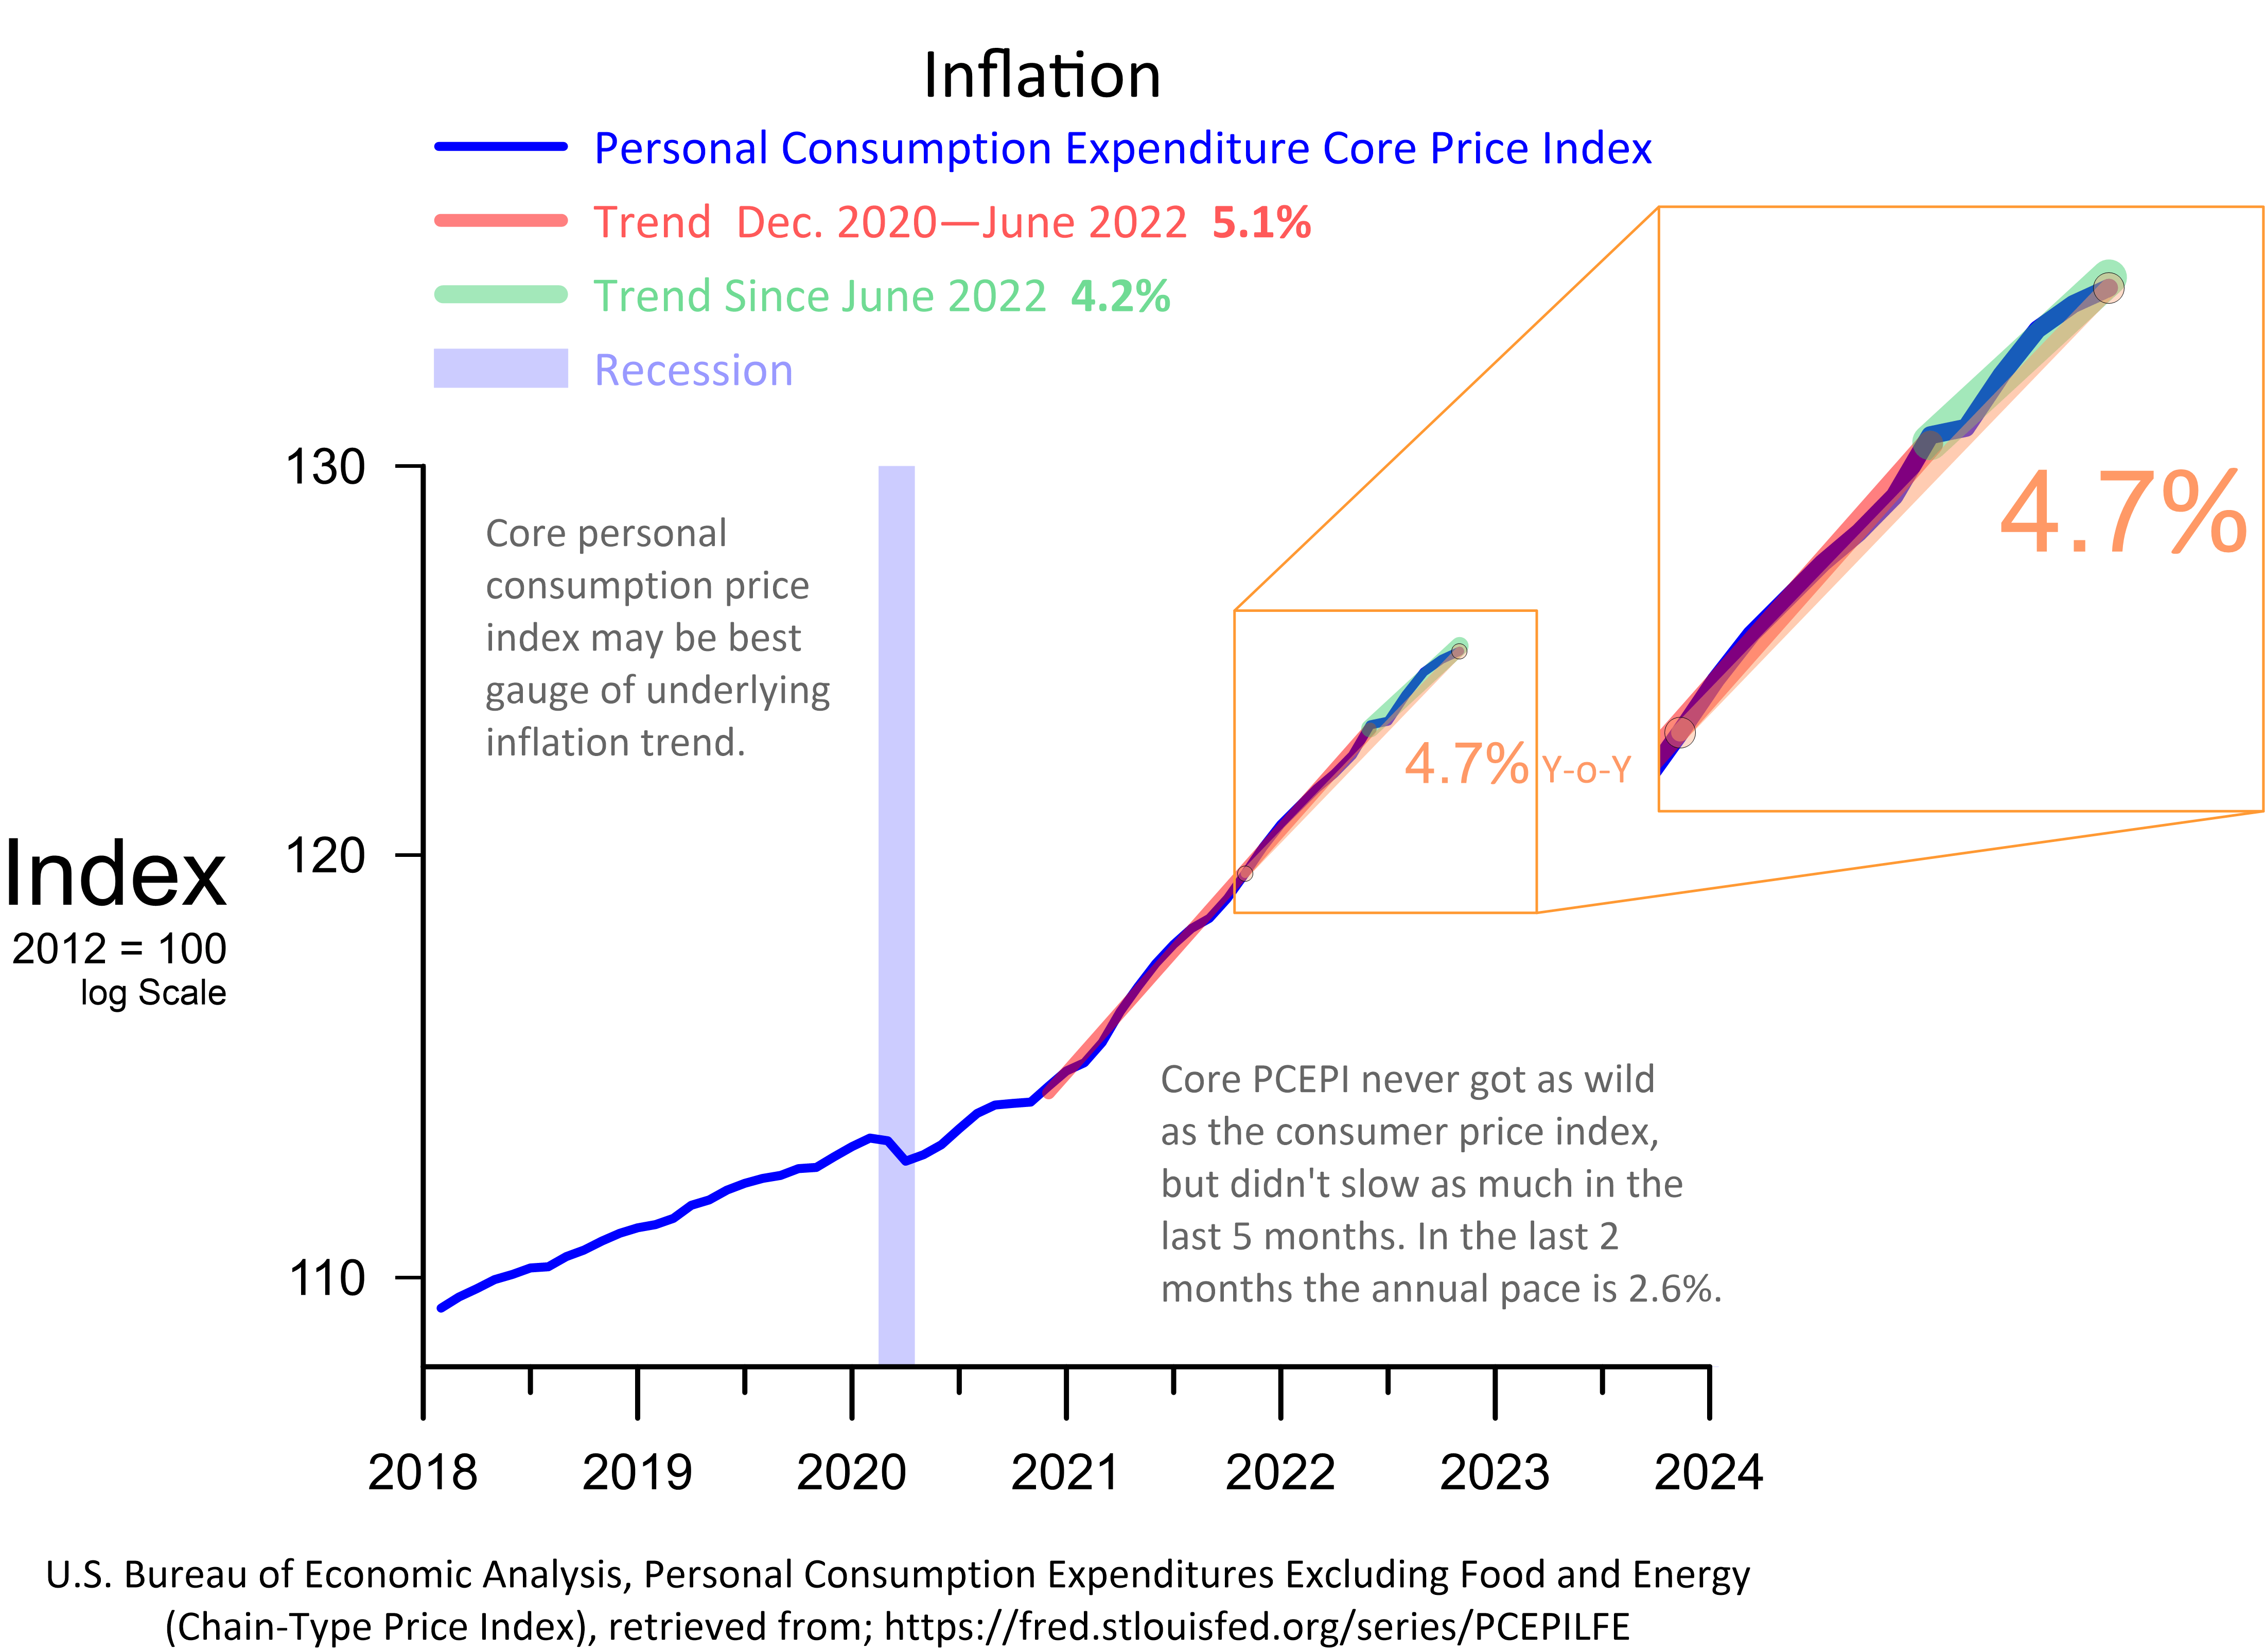
This measure has slowed, but does not yet have a crisp inflection point toward lower inflation like the CPI. The personal consumption index has increased at a 2.6% rate the last two months if this lower rate continues October 2022 would turn out to be a sharp inflection point toward lower core inflation.
Money Supply and Inflation
The sharp inflation in 2022 may be related to money growth. There was massive growth in the money supply in March, April and May of 2020. This growth was transitory and directly related to the policy response to Covid-19.
Economic Leads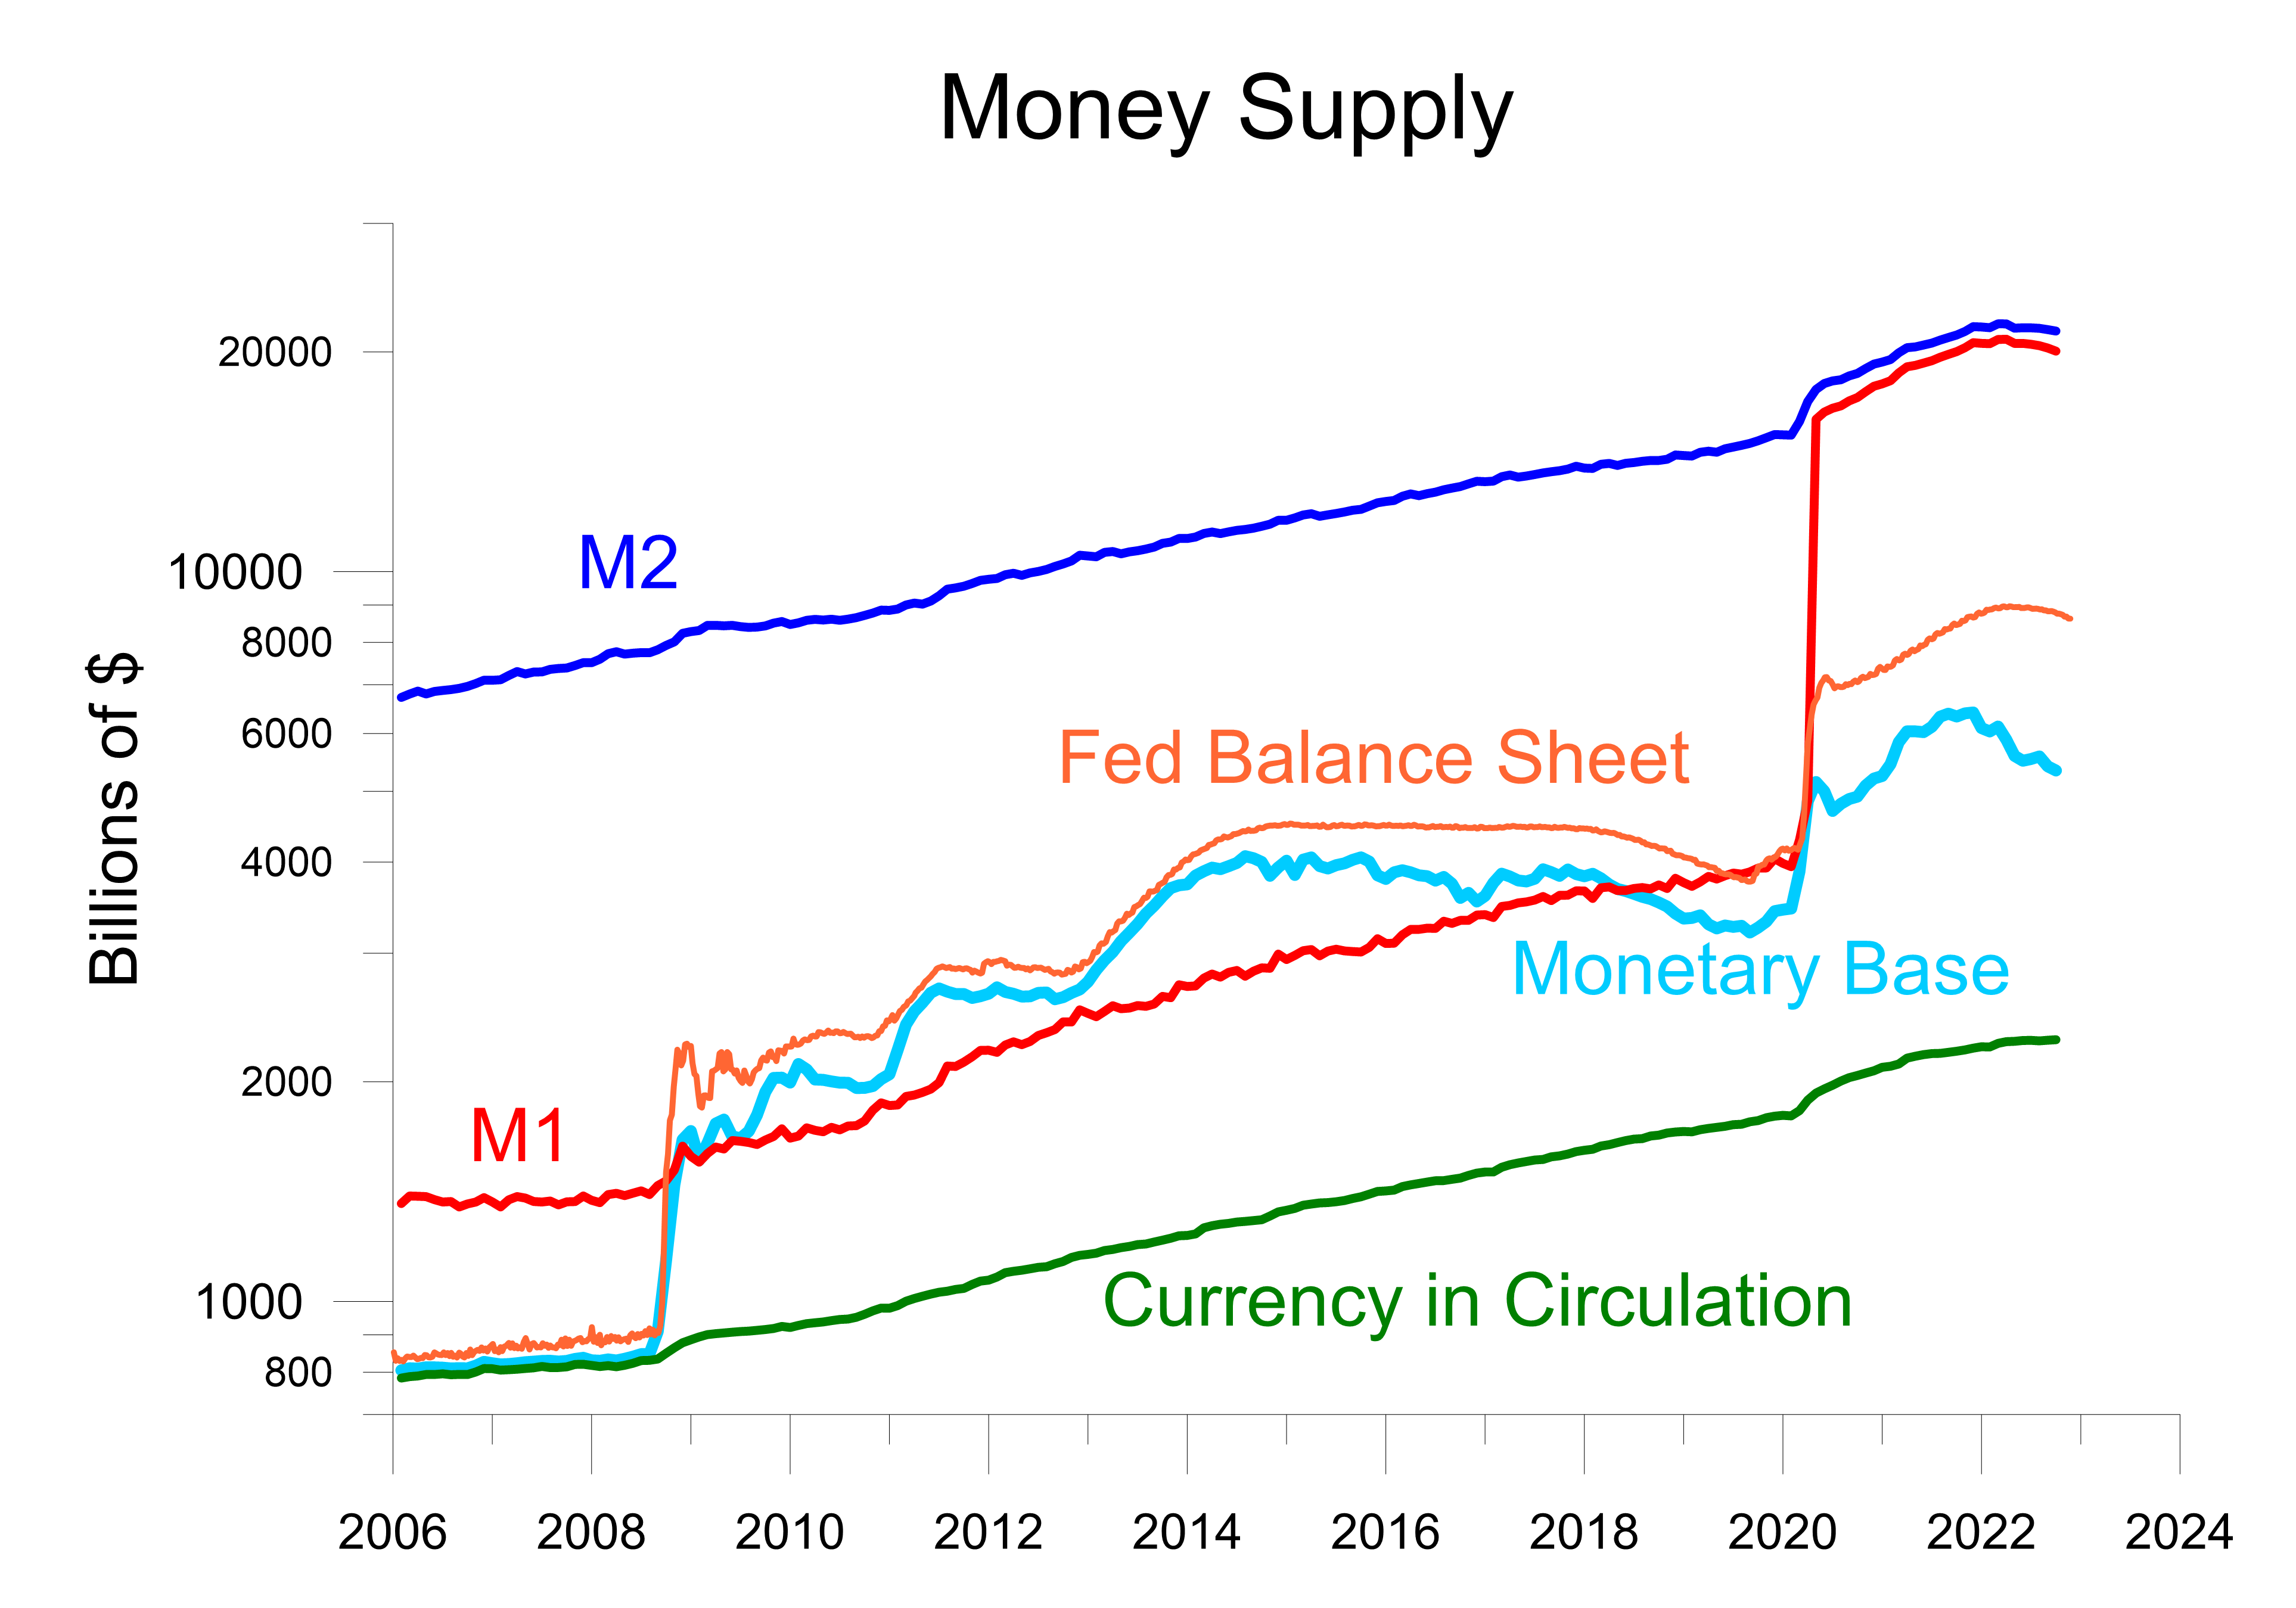
Don’t be alarmed at the huge jump in M1. This was mostly a redefinition that expanded what M1 includes.
M2 expanded more with the monetary and fiscal response to the pandemic than it did for the response to the great recession in 2008. The huge jump in the monetary base in 2008 didn’t change the M2 growth trend much or result in much inflation. M2 surged higher with the Covid policy response.
The relationship between money growth and inflation varies greatly, but here is the correlation since 2017.
Economic Leads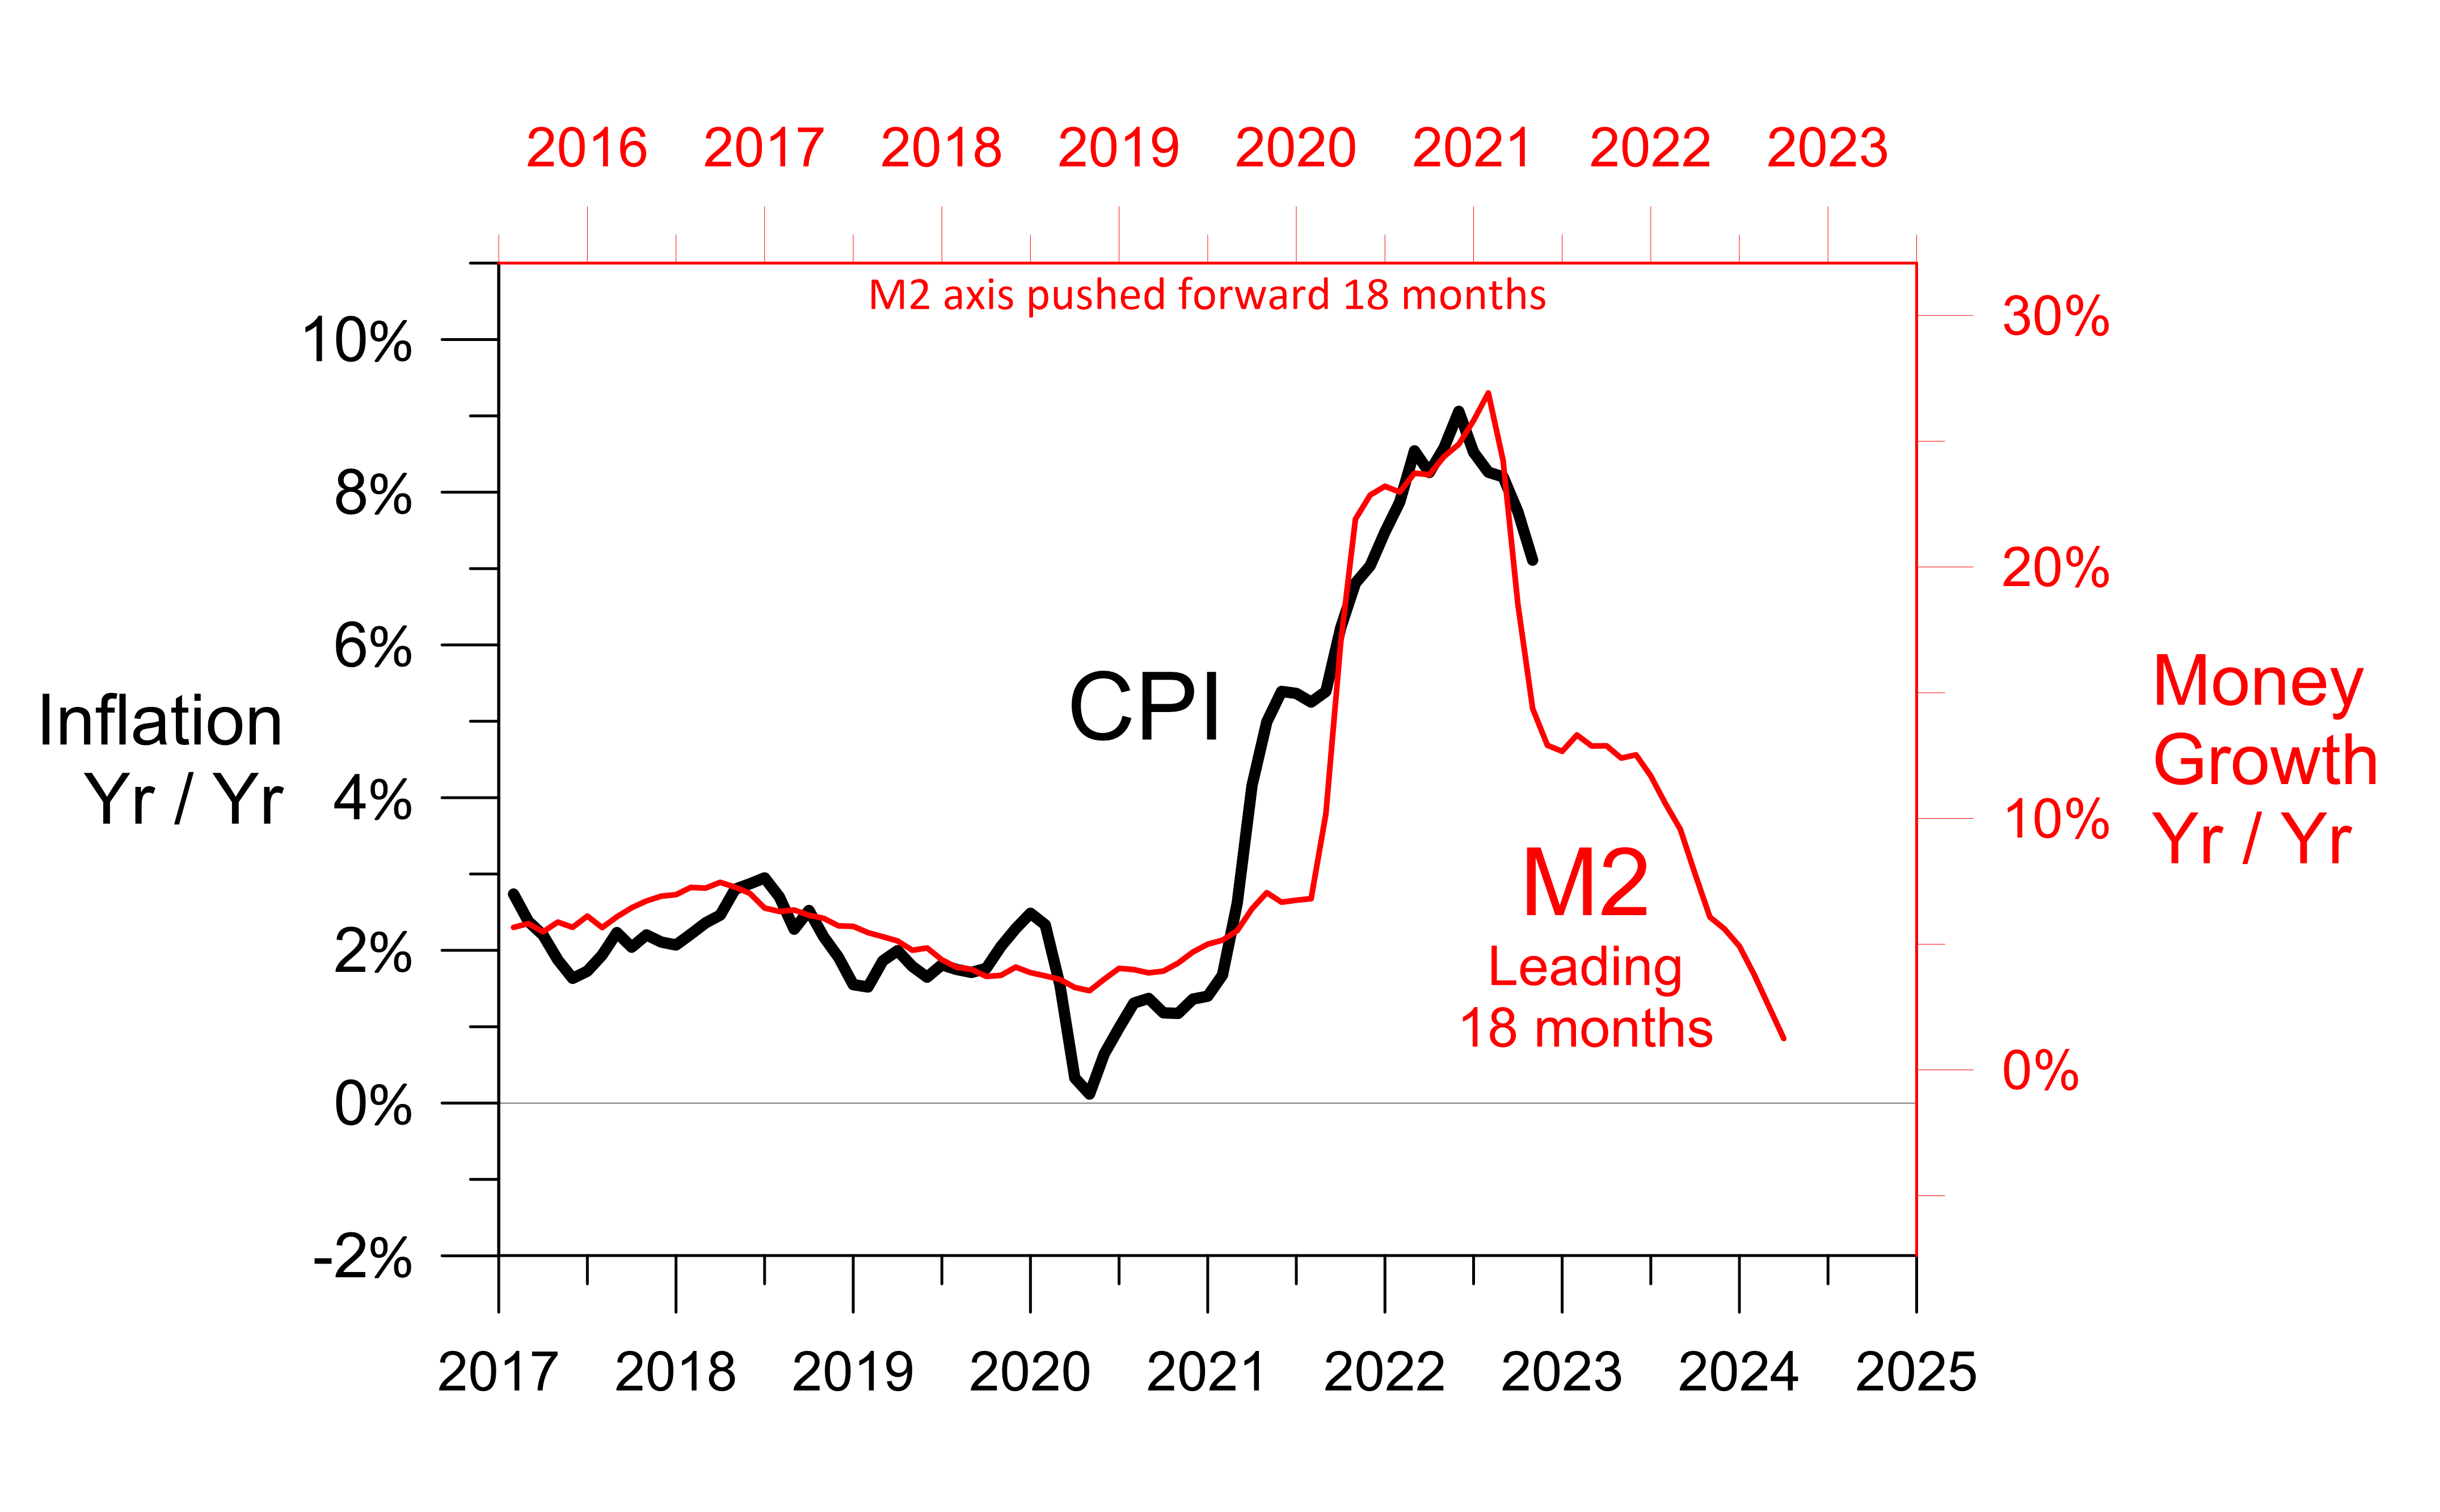
The correlation in the last five years is strongest with an 18-month lead time. In the 1970s, the correlation maximizing lead time was about 30 months. In the 20 years, 1997-2017, the 18-month lead time for M2 growth had a weak inverse correlation with inflation rather than the strong positive correlation since 2017 shown in the chart above.
I don’t know how much, if any, confidence to put in the chart above, but if the correlation of the last five years continues it suggests year over year inflation will fall below 1% in April 2024.
The surge in money growth was transitory. The surge of inflation will be transitory, even though the transition is longer than officials thought it would be eight months ago.
Interest Rates Overshot
High economic growth and inflation pushed interest rates up dramatically. This dramatic rise is done.
While inflation got full media coverage the high economic growth got less attention. In the 18 months July 2020-December 2021 GDP grew at a 9.8% pace. Some of this rapid growth was robed from the future: the first three quarters of 2022 only grew at a pace of 0.3%.
The drop-off in growth and the retreat of high inflation mean interest rates are more likely to drop than continue up.
There is an inverse long term relationship between the logarithm of interest rates and the monetary base as a percent of GDP. To show those correlations, the 3-month T-Bill yield and the 10-Year T-Bond yield are plotted on a logarithmic scale.
Economic Leads Economic Leads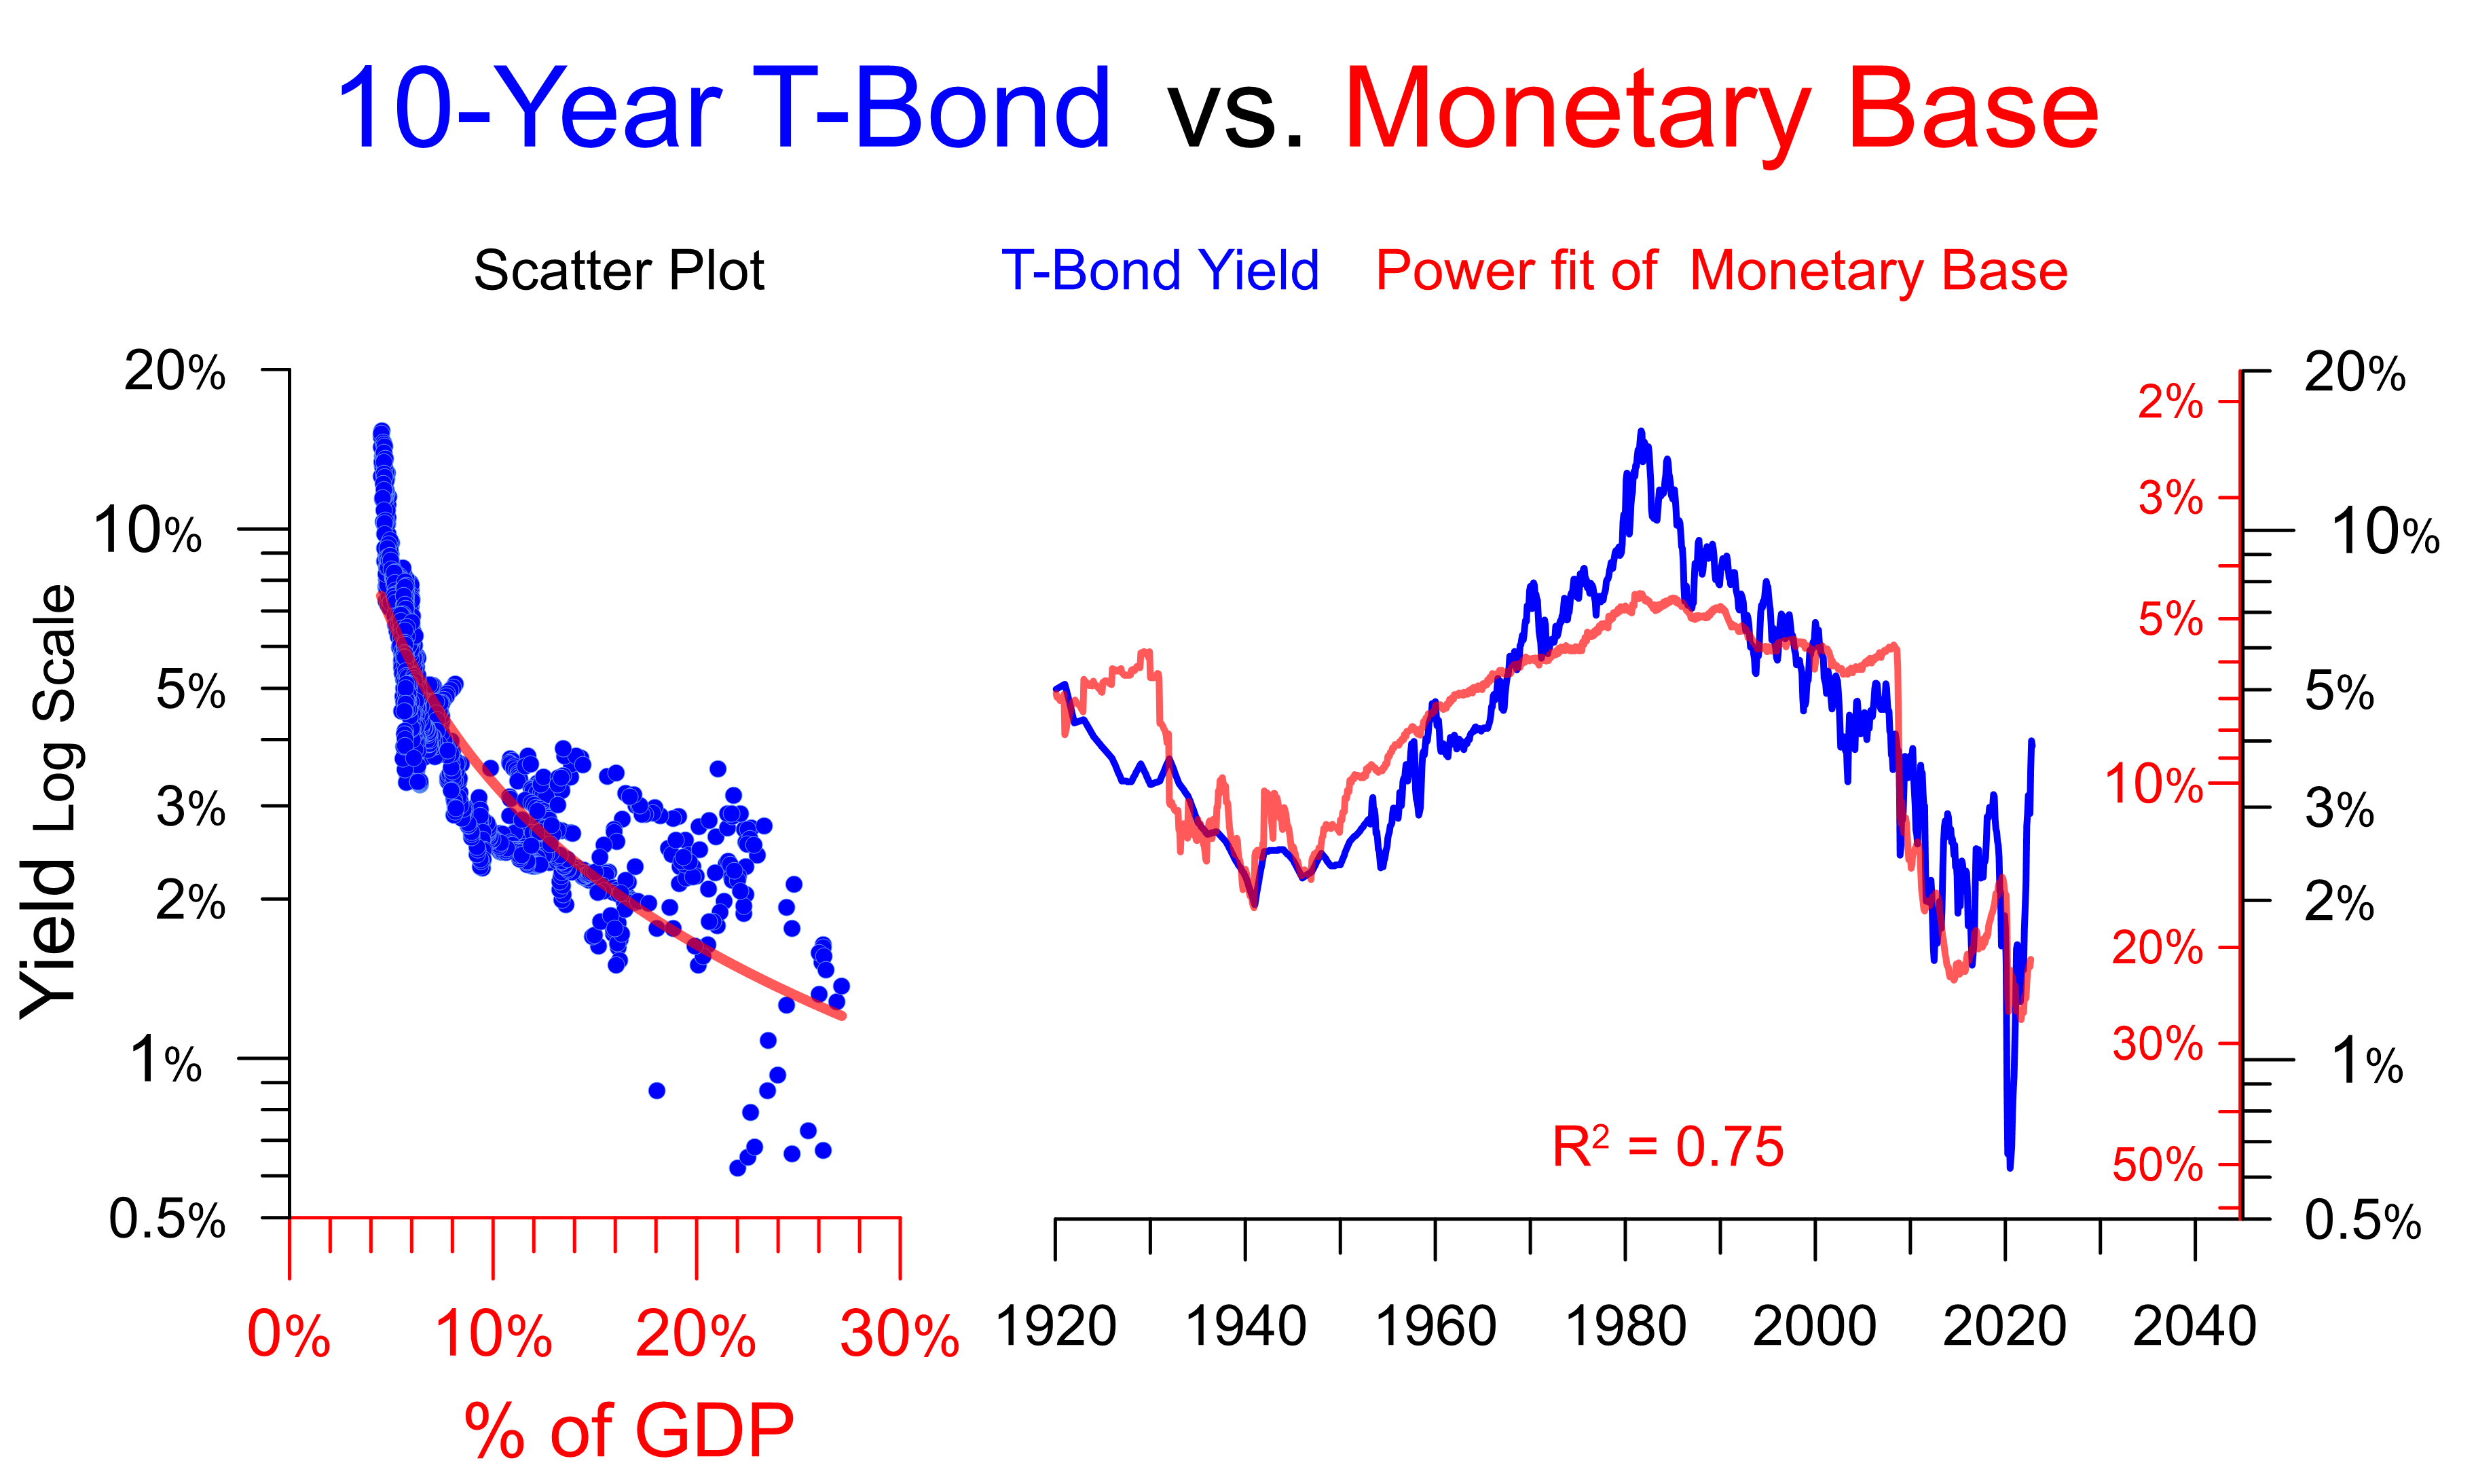
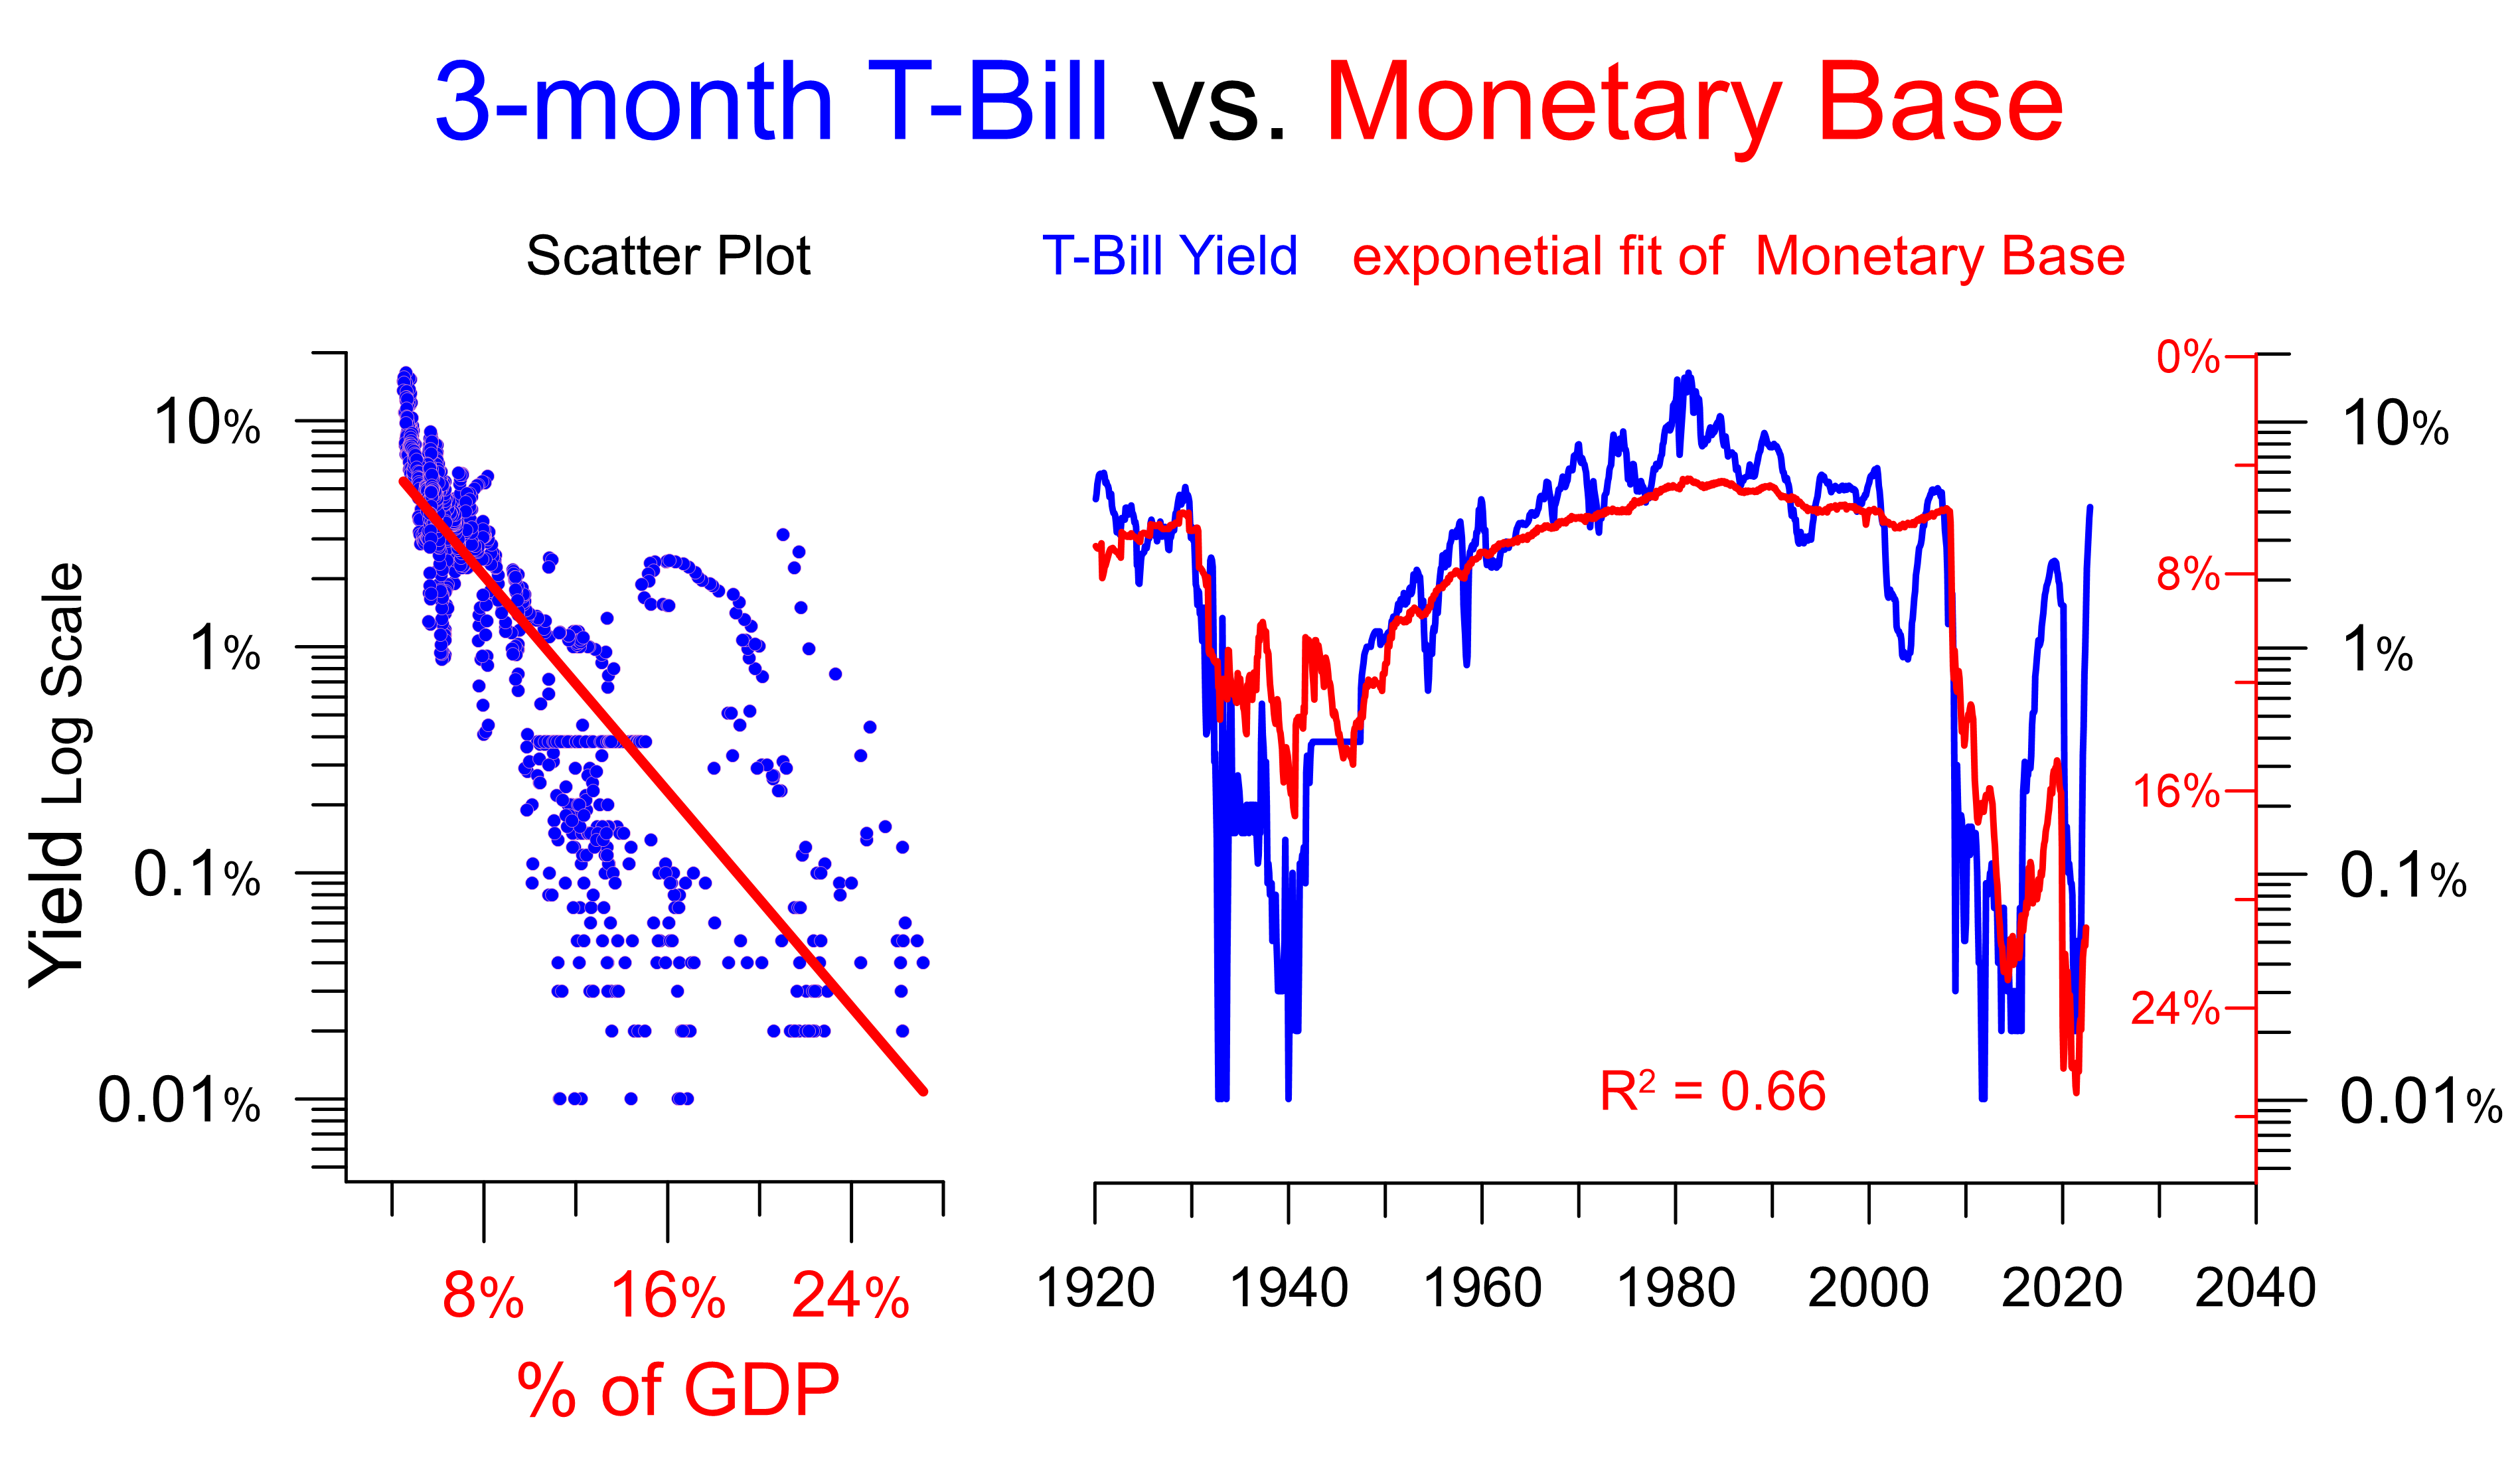
In the last 10 months, both rates shot further above the level indicated by the monetary base than ever before. Interest rates will likely trend down during 2023.
Hyped Recession Fear
The numerous vocal recession declarations and forecasts are an interesting contrast to the euphoria in the summer of 2008. I didn’t trust the enthusiasm in 2008, and I don’t trust the gloom today.
Investors of whatever political persuasion should be aware when economic coverage gets slanted. Let’s take a quick look back at July 2008. It was later determined we were seven months into recession. Industrial production and non-farm jobs had been declining for eight and six months respectively. The stock market had peaked back in October 2007. Yet, about half of the so-called blue chip economists were saying there was no chance of recession in the next two years and the other half were saying only a mild chance. The President and Treasury Secretary were boldly claiming, “The economy is strong and fundamentally sound.” Business leaders hailed our economic strength. Three months later, trouble became more obvious.
CEOs tend to like the business friendly economic approach of Republicans more than the Democratic approach that’s friendlier to workers and consumers. The ownership and CEOs of corporate owned media share similar sentiments. These sentiments tend to focus on the negative when a Democrat is in the White House and downplay the negative during a Republican Administration.
We are not in a recession.
Economic Leads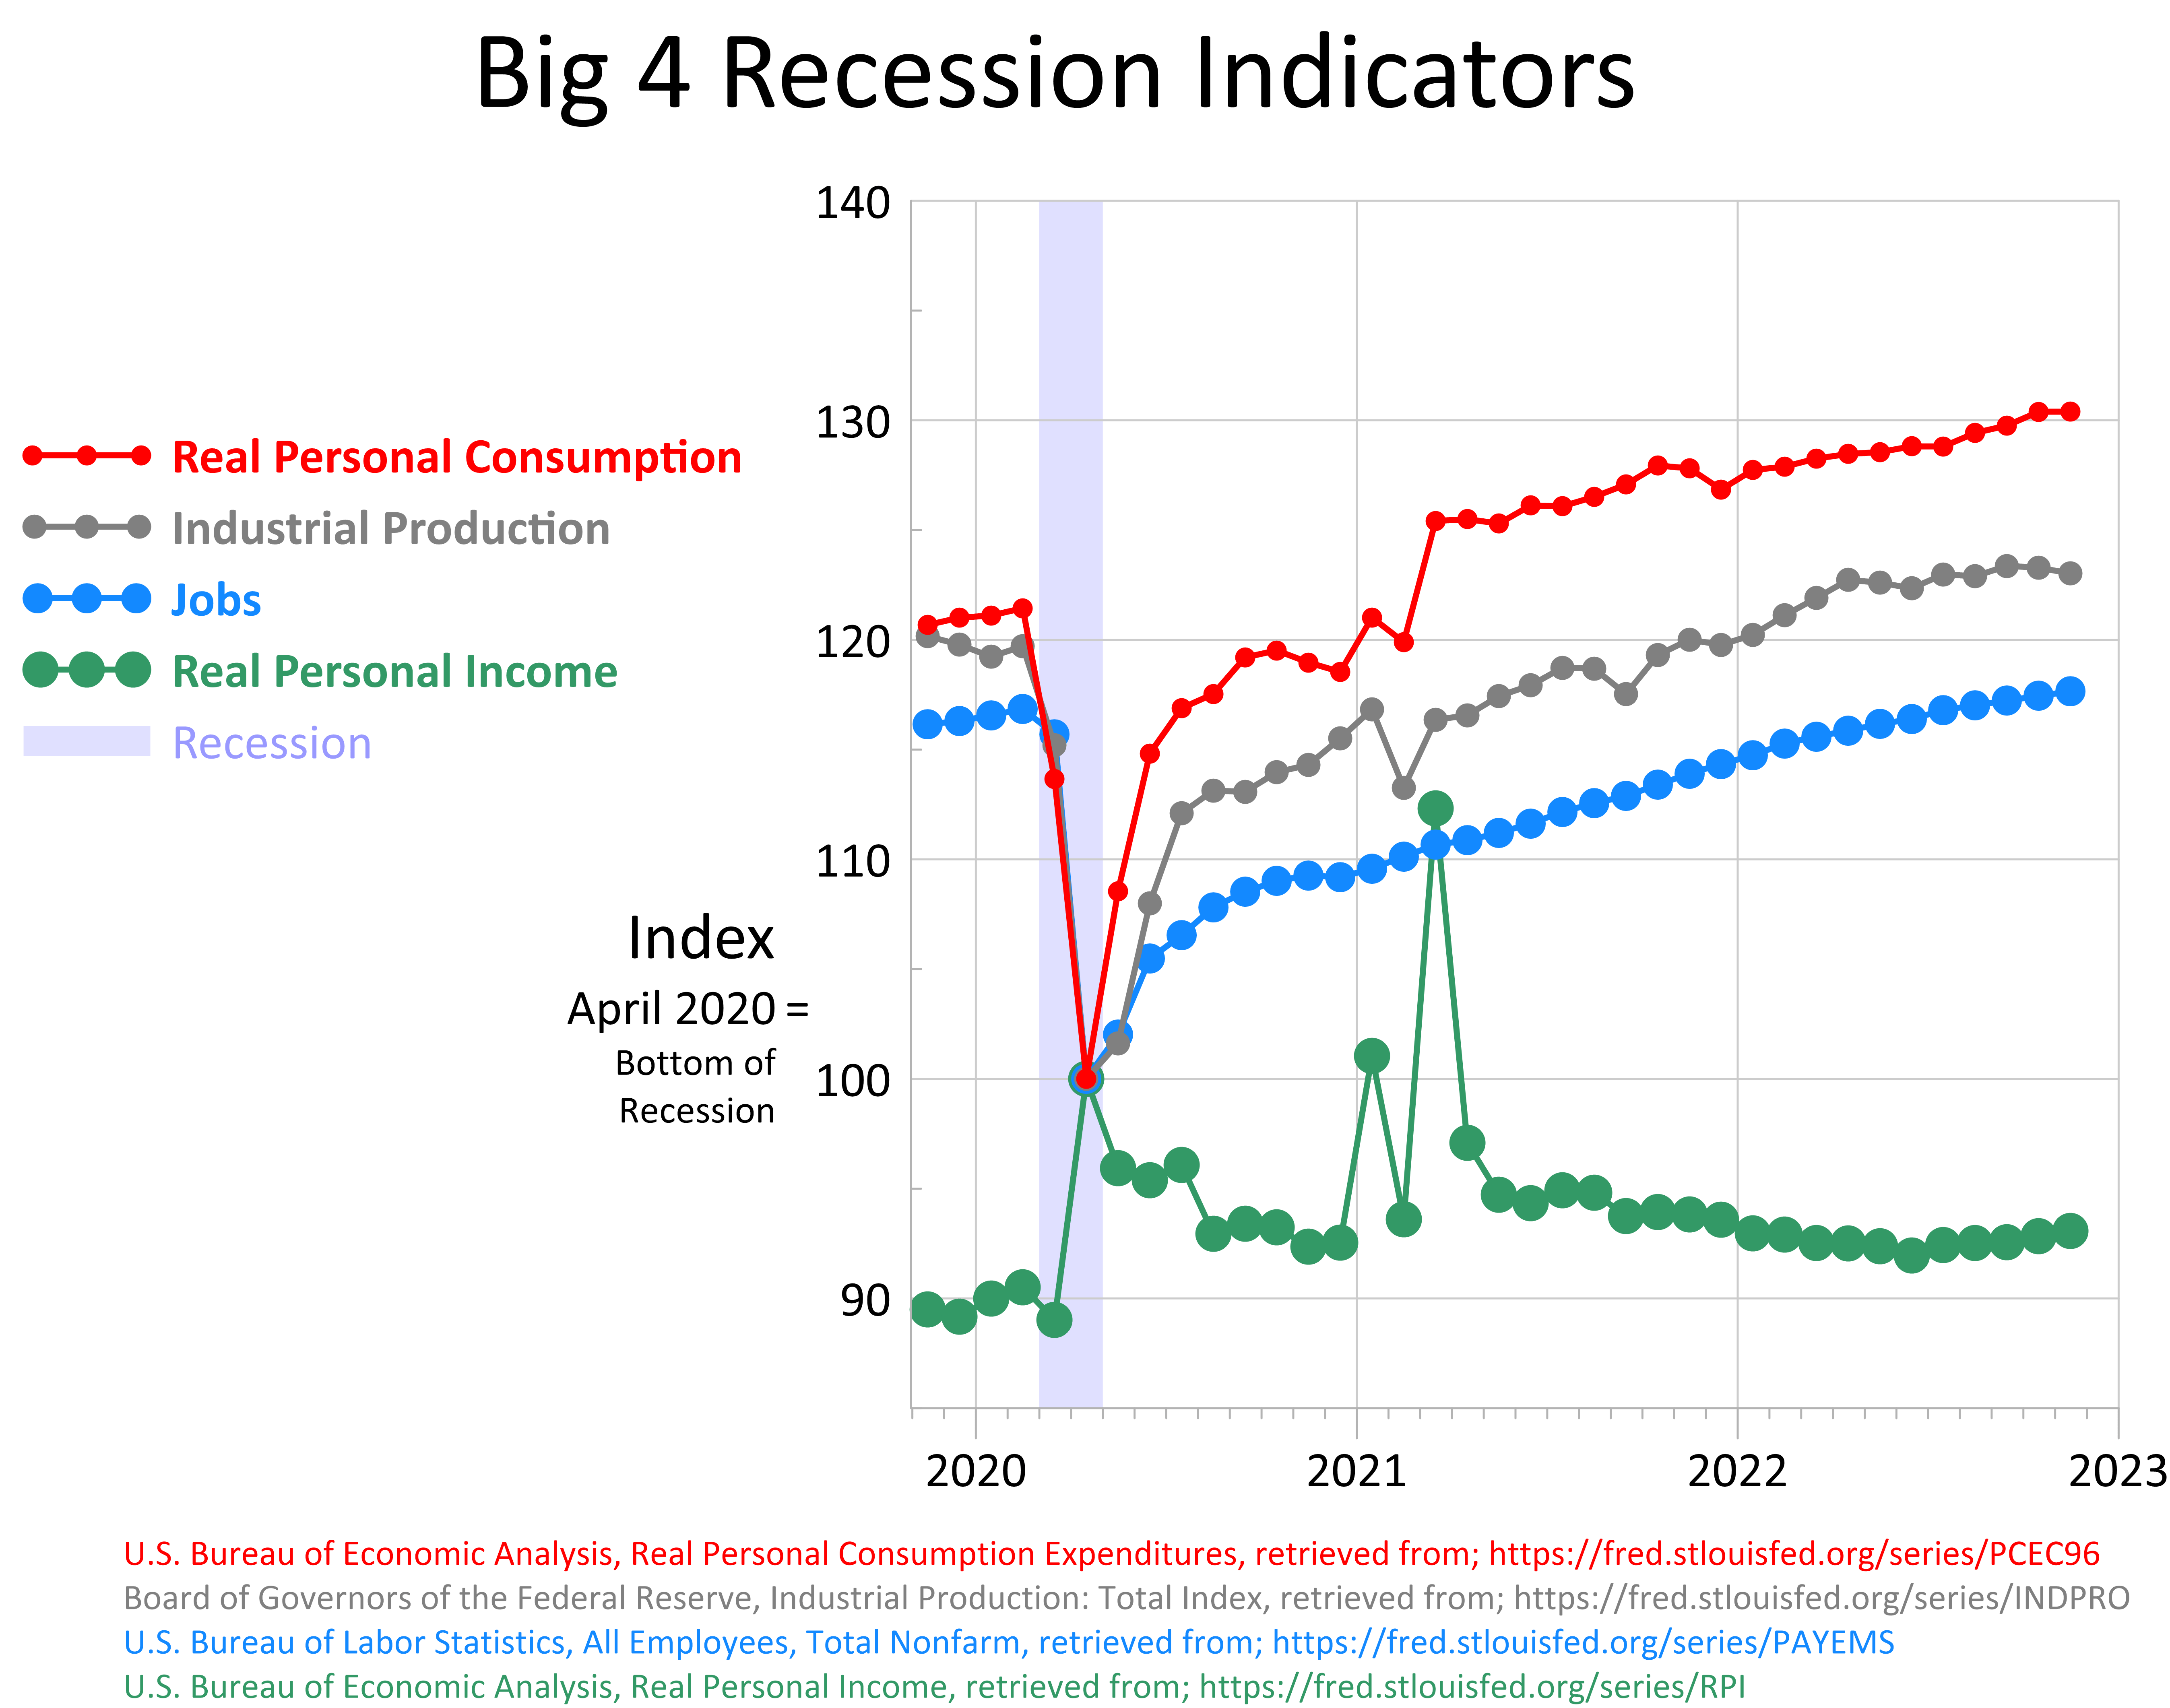
Non-farm jobs have grown every month since December 2020 and set new highs the last four months. Industrial production while having minor declines the last two months just had its third-biggest month ever. Real personal consumption remains in an uptrend. Real personal income had increased five straight months.
The yield curve is often cited as indicating a recession in 2023. As I view it, the recession forecast is for late 2024 or early 2025. The yield curve suggests we should be getting past the recent weakness and returning to normal growth.
Economic Leads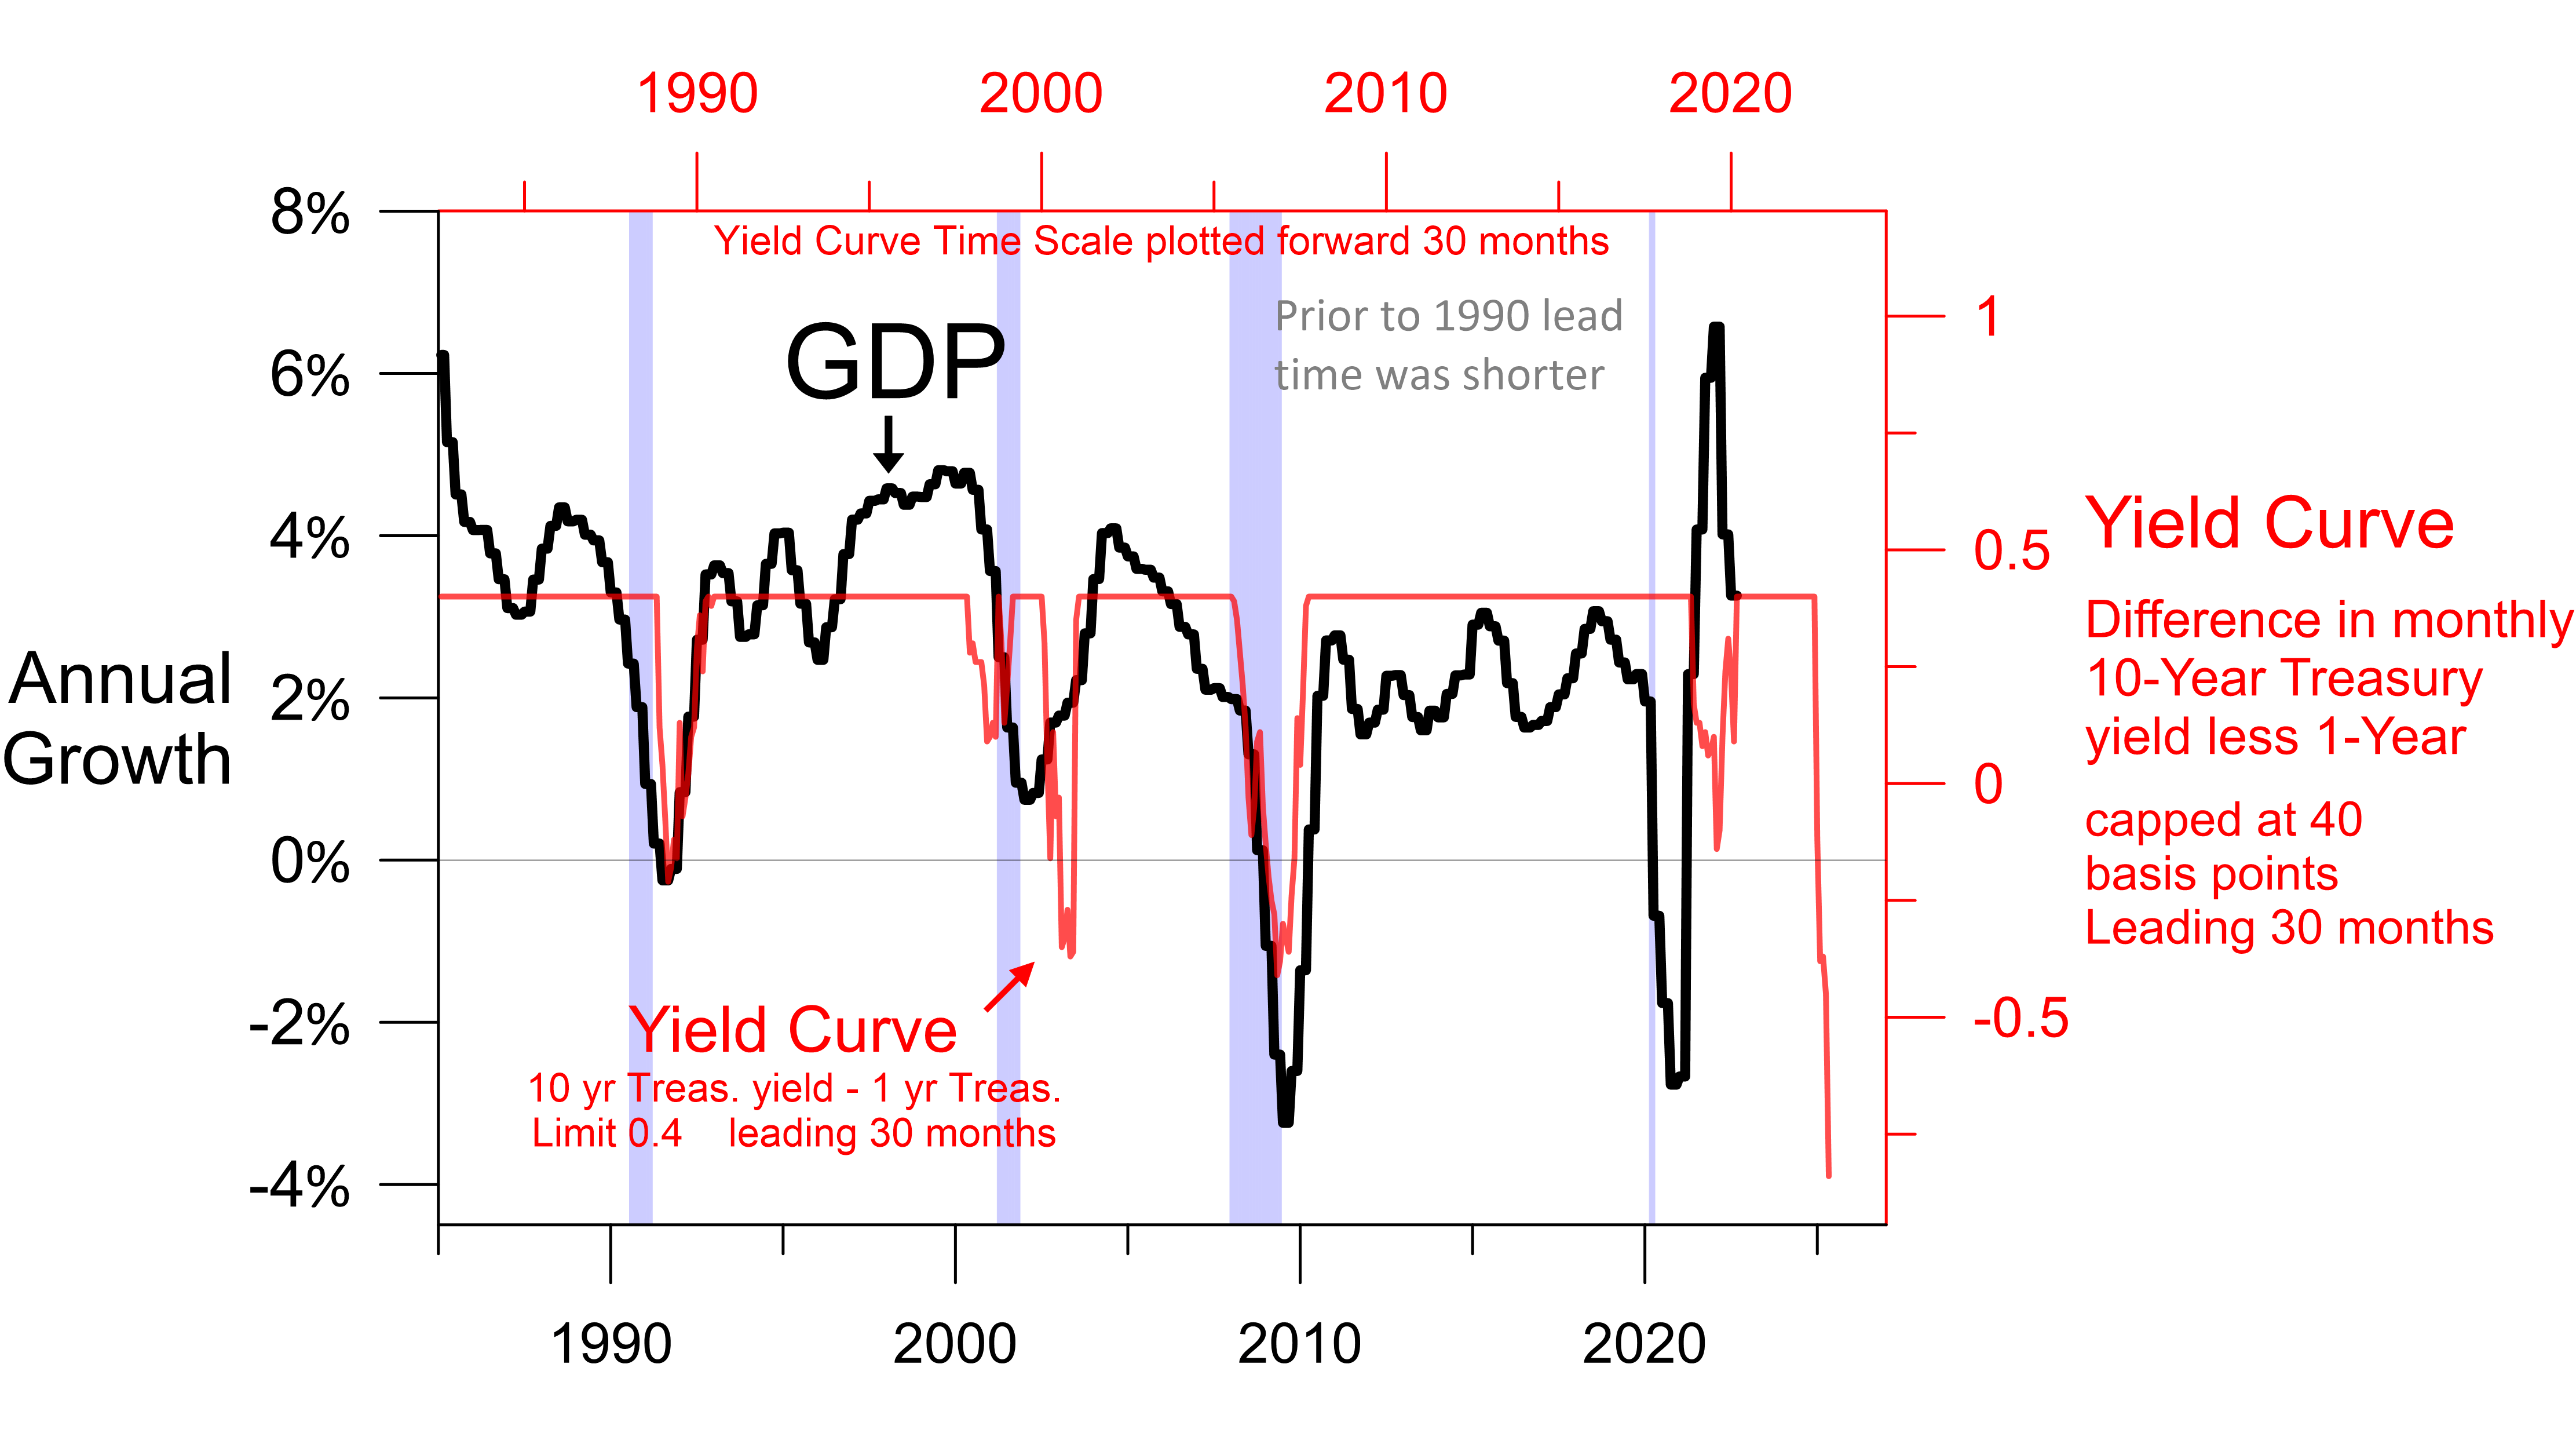
The chart above shows the correlation between the annual GDP growth rate (distinct from year over year rate) and the yield curve measured as the 10-Year T-Bond yield less the 3-Month T-Bill yield capped at 40 basis points. When the 10-Year yields 40 basis points or more than the 3-Month, the yield curve has very little correlation with growth. Since 1995 the correlation maximizing lead time is 30 months. So while I agree a bad recession is coming, I think it is almost two years away. Recession seems highly unlikely in 2023.
Yield Curve and Stocks
The yield curve also has a good record predicting bear markets associated with recessions. The indication is the next bear market will start October 2024.
Economic Leads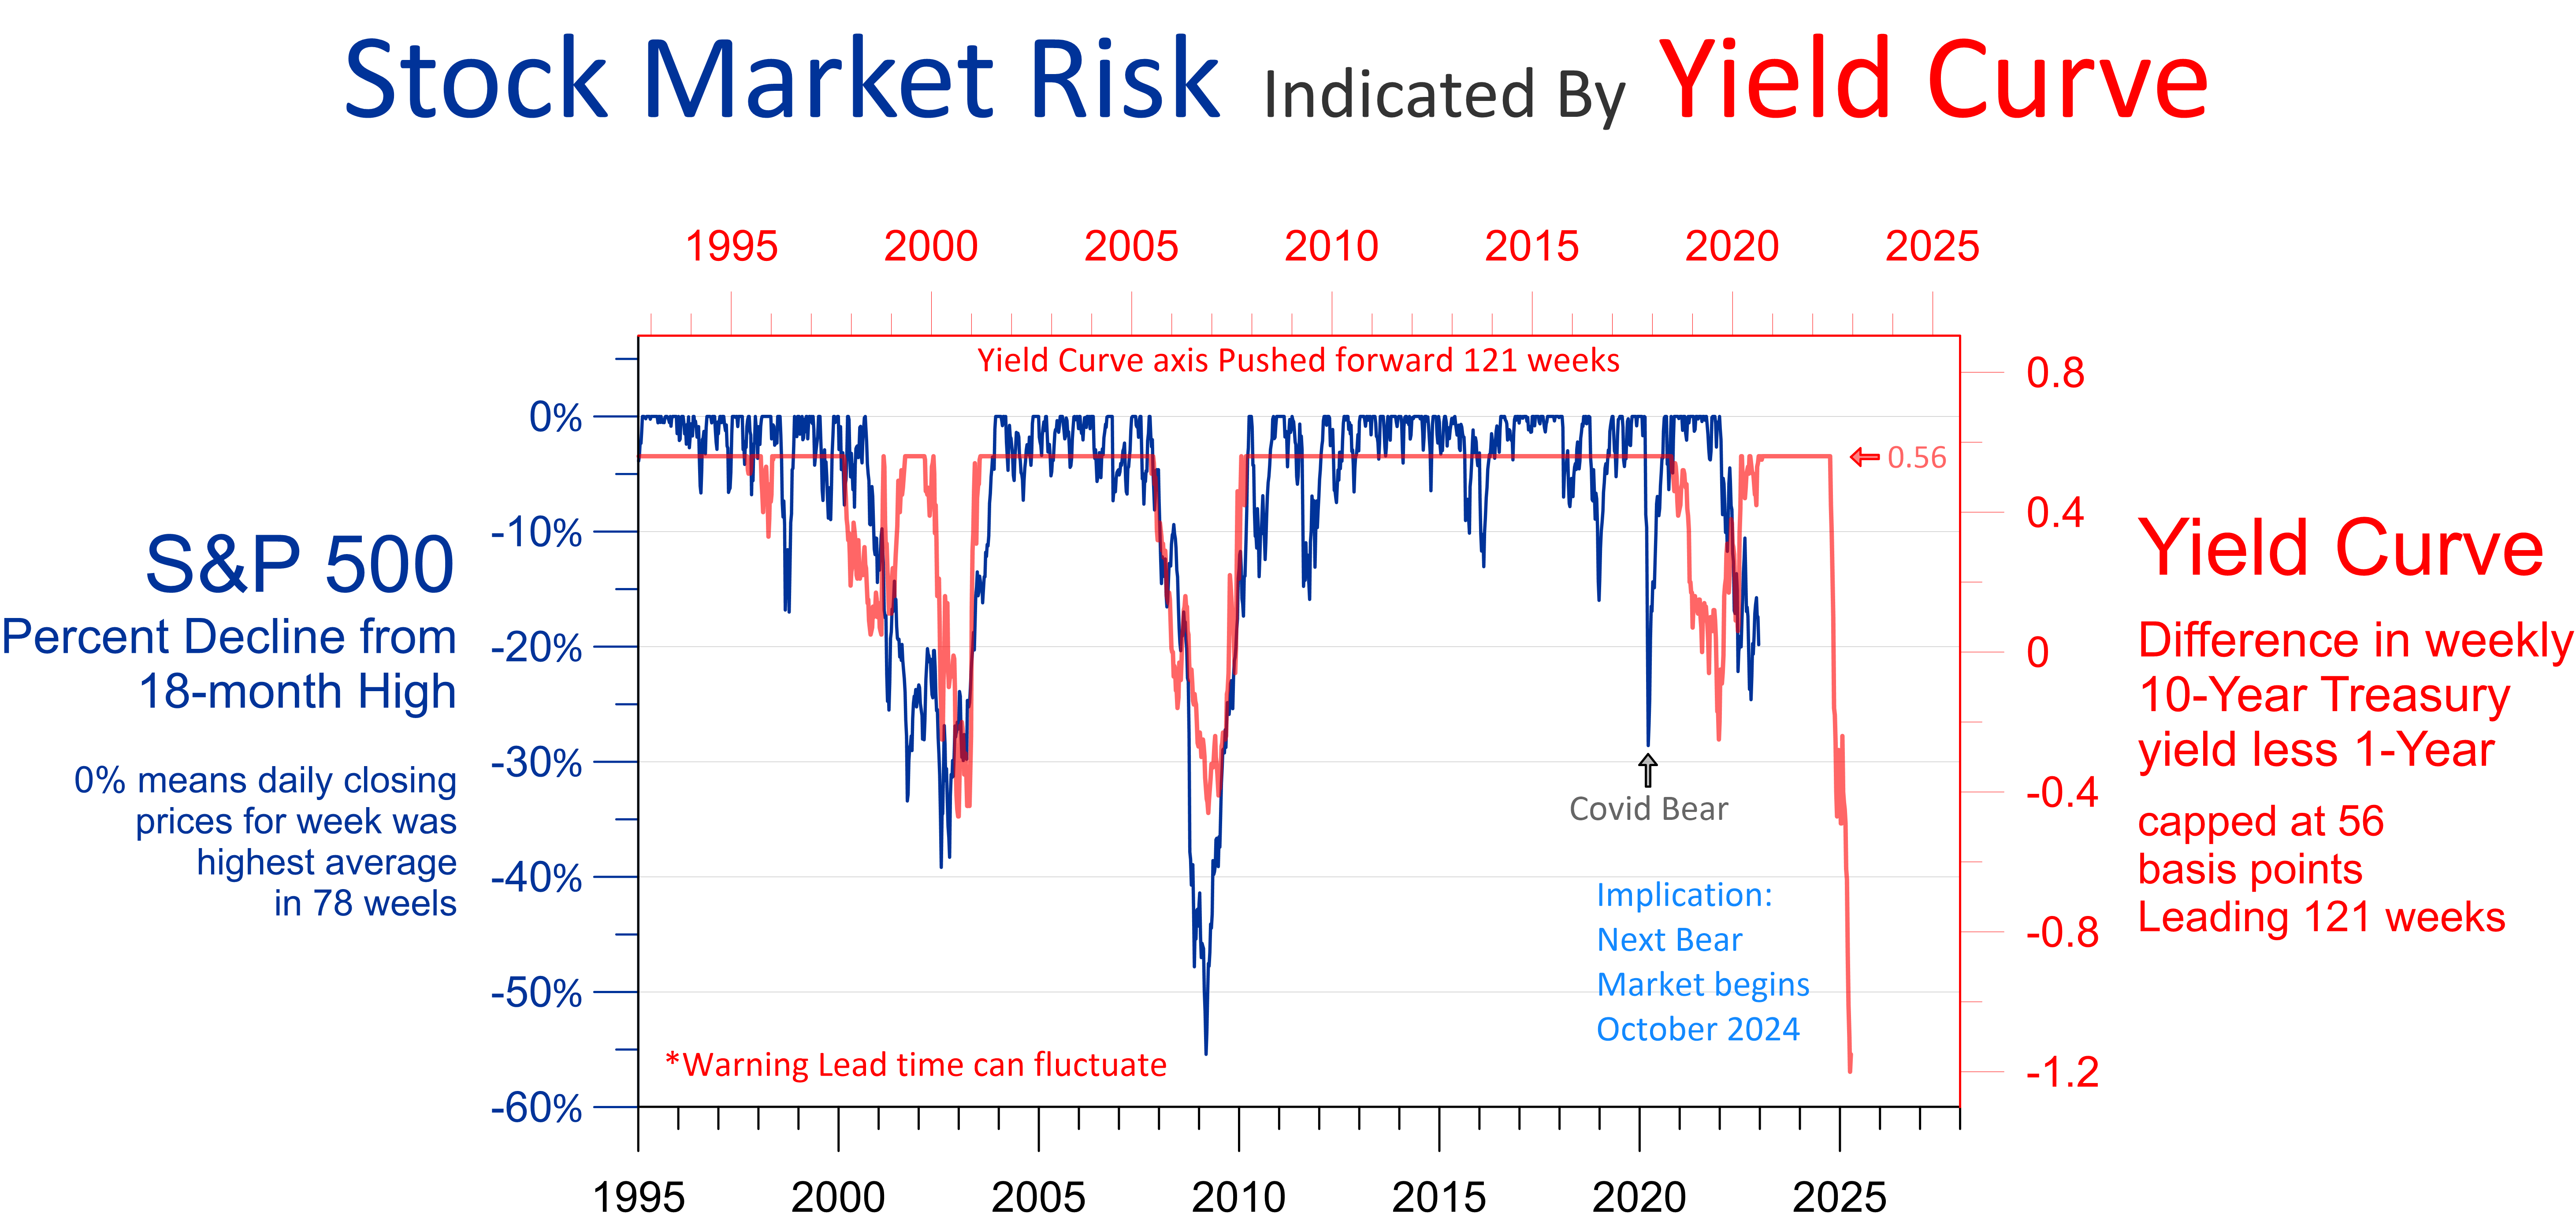
The stock market risk indicator above is kind of like a drawdown. Each weekly data point is calculated from the average daily closing prices during a week and how far that week’s average is below the highest week in the previous 78 weeks (18 months). Since 1995 the correlation optimizing lead for the yield curve is 121 weeks.
The correlation lines up well with the bear markets that started in 2001 and 2007. The 2019 yield curve inversion indicated a bear market to begin in late October 2020. As I view it, Covid preempted part of this bear market and the massive fiscal and monetary stimulus postponed the rest of it till 2022.
The yield curve correlation is consistent with the S&P 500 hitting some 18-month highs in 2023 and possibly some all-time highs. I expect a series of all-time highs in 2024 prior to October.
Fiscal Responsibility Who Knew?
Amazingly, the Federal government may have been more fiscally responsible than it has since fiscal year 2001. In President Trump’s last fiscal year, 2021, which ran from October 2020-September 2021 the economy grew 2.1% faster than the National debt. In President Biden’s first fiscal year which ended in September, the economy grew 1.5% faster than the debt. The last time the US had two fiscal years in a row with economic growth beating out debt growth was under President Clinton.
Economic Leads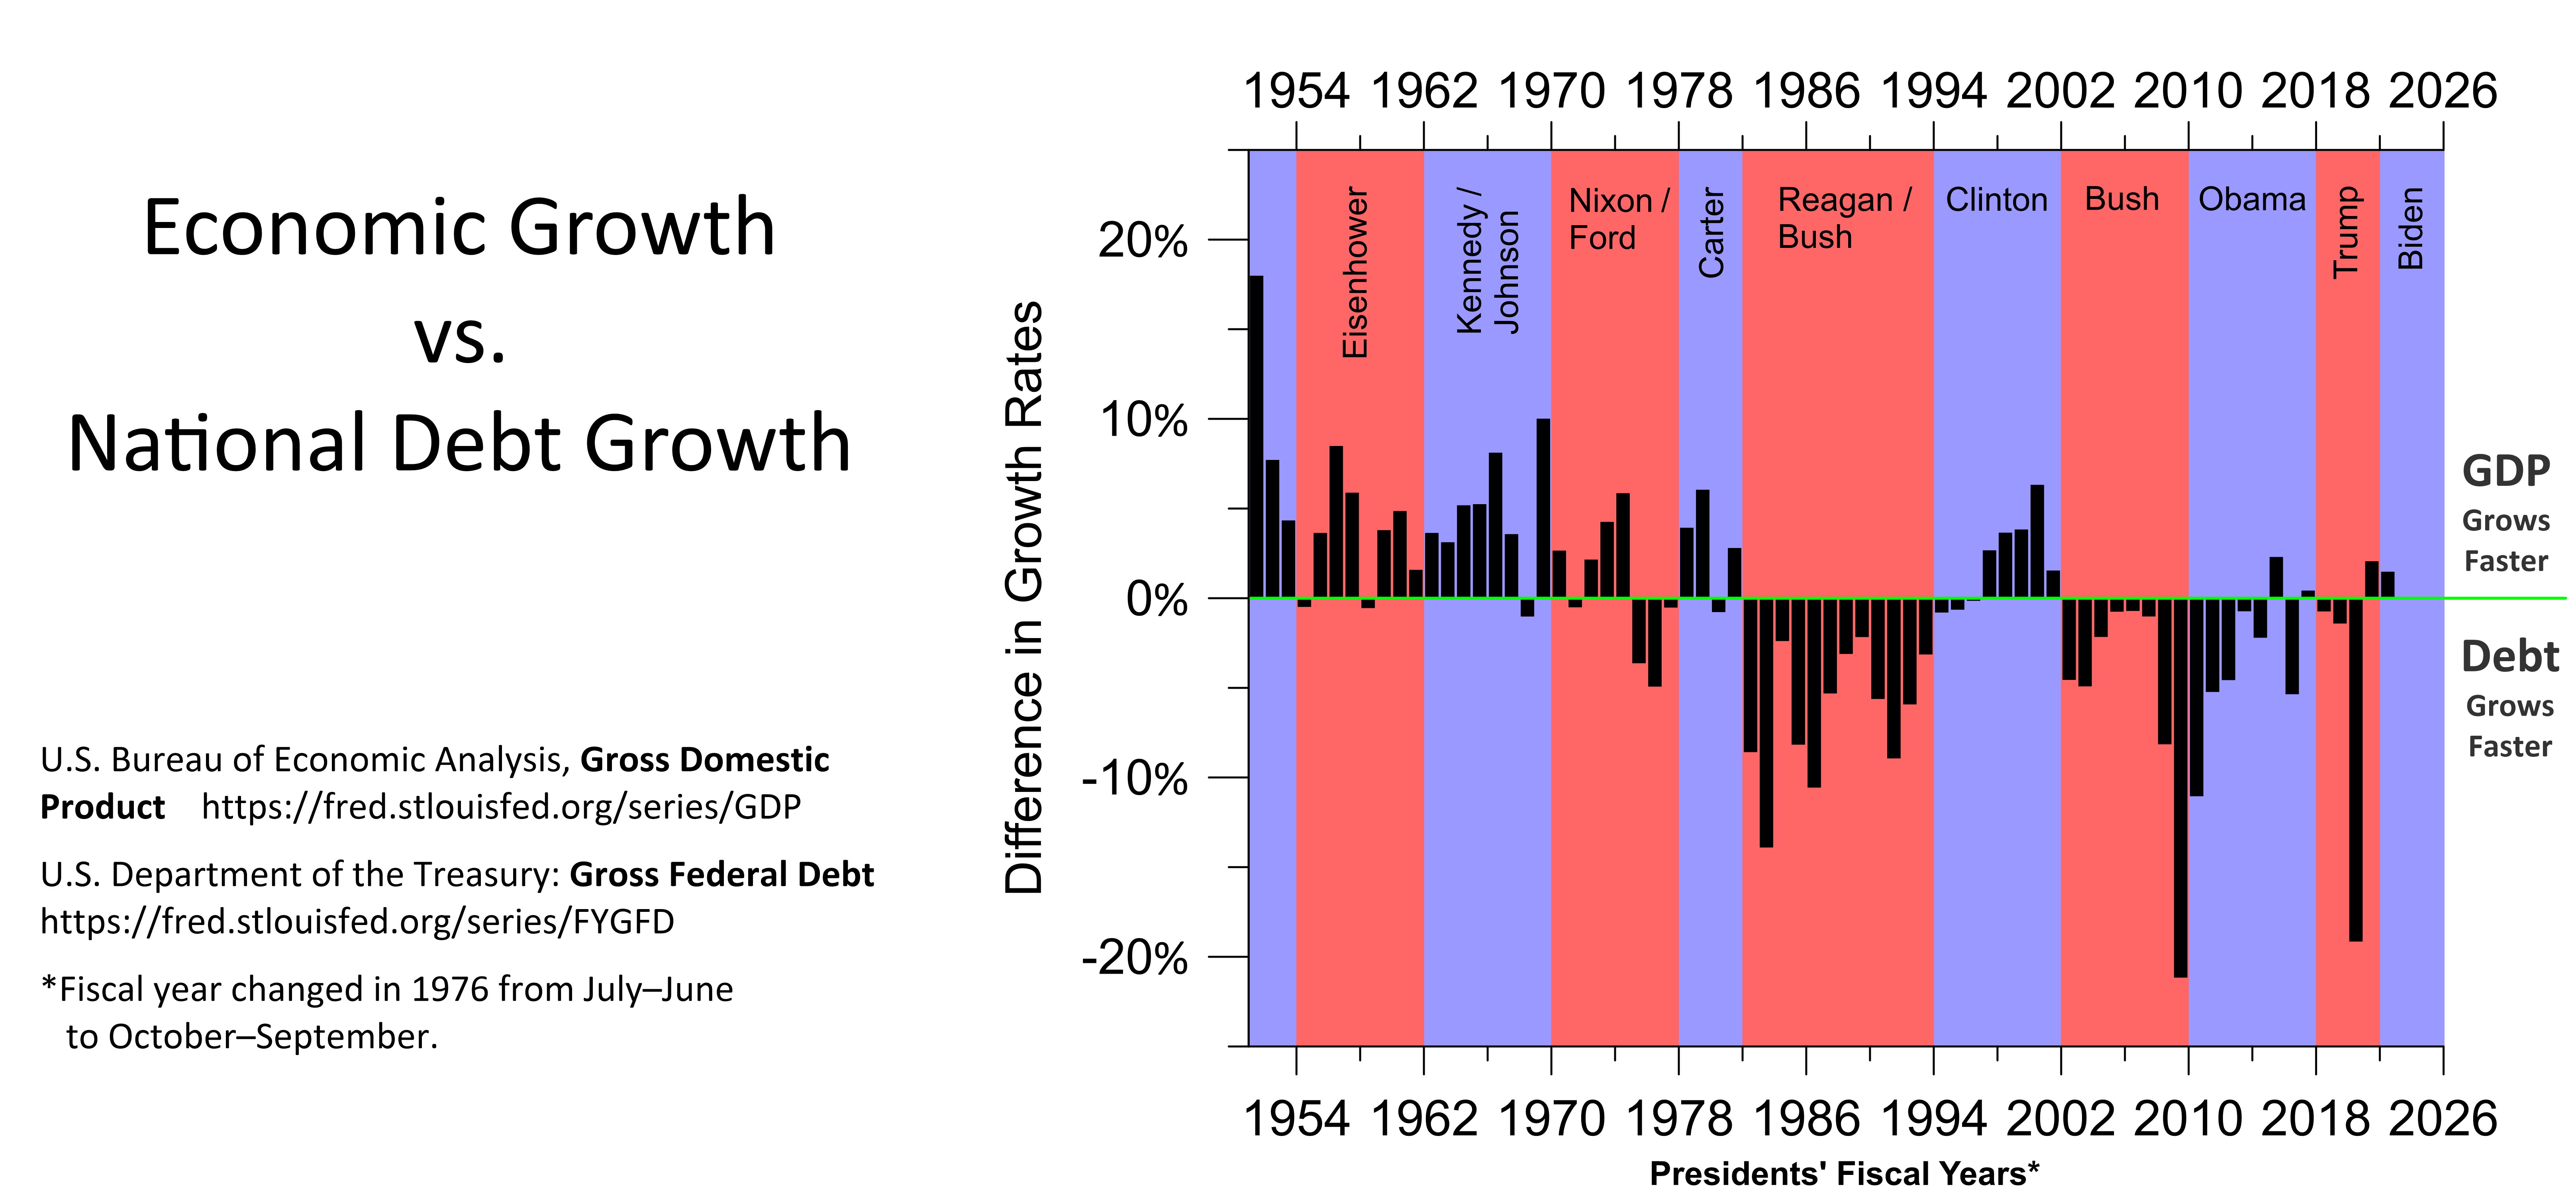
If the economy grows faster than the debt, debt declines as a percentage of GDP. The burden of servicing the debt declines. Spending that empowers people and businesses to grow the economy faster than the debt is prudent, not irresponsible.
Obviously more responsibility with the enormous national debt would be beneficial, but as investors recognizing positive fiscal steps as opposed to believing claims our fiscal house is a dumpster fire could help you be ready for the coming bull market.
Cycles are Turning
The bear market could have bottomed Thursday morning October 13, if not it will likely bottom around January 20 give or take a couple of weeks or so.
The cycle in the 200 trading-day price change on the S&P 500 likely already bottomed on October 12 with a -24.0% price change for the 200 trading-day period. The fitted sine-curve indicated a bottom for 12/29/22.
Economic Leads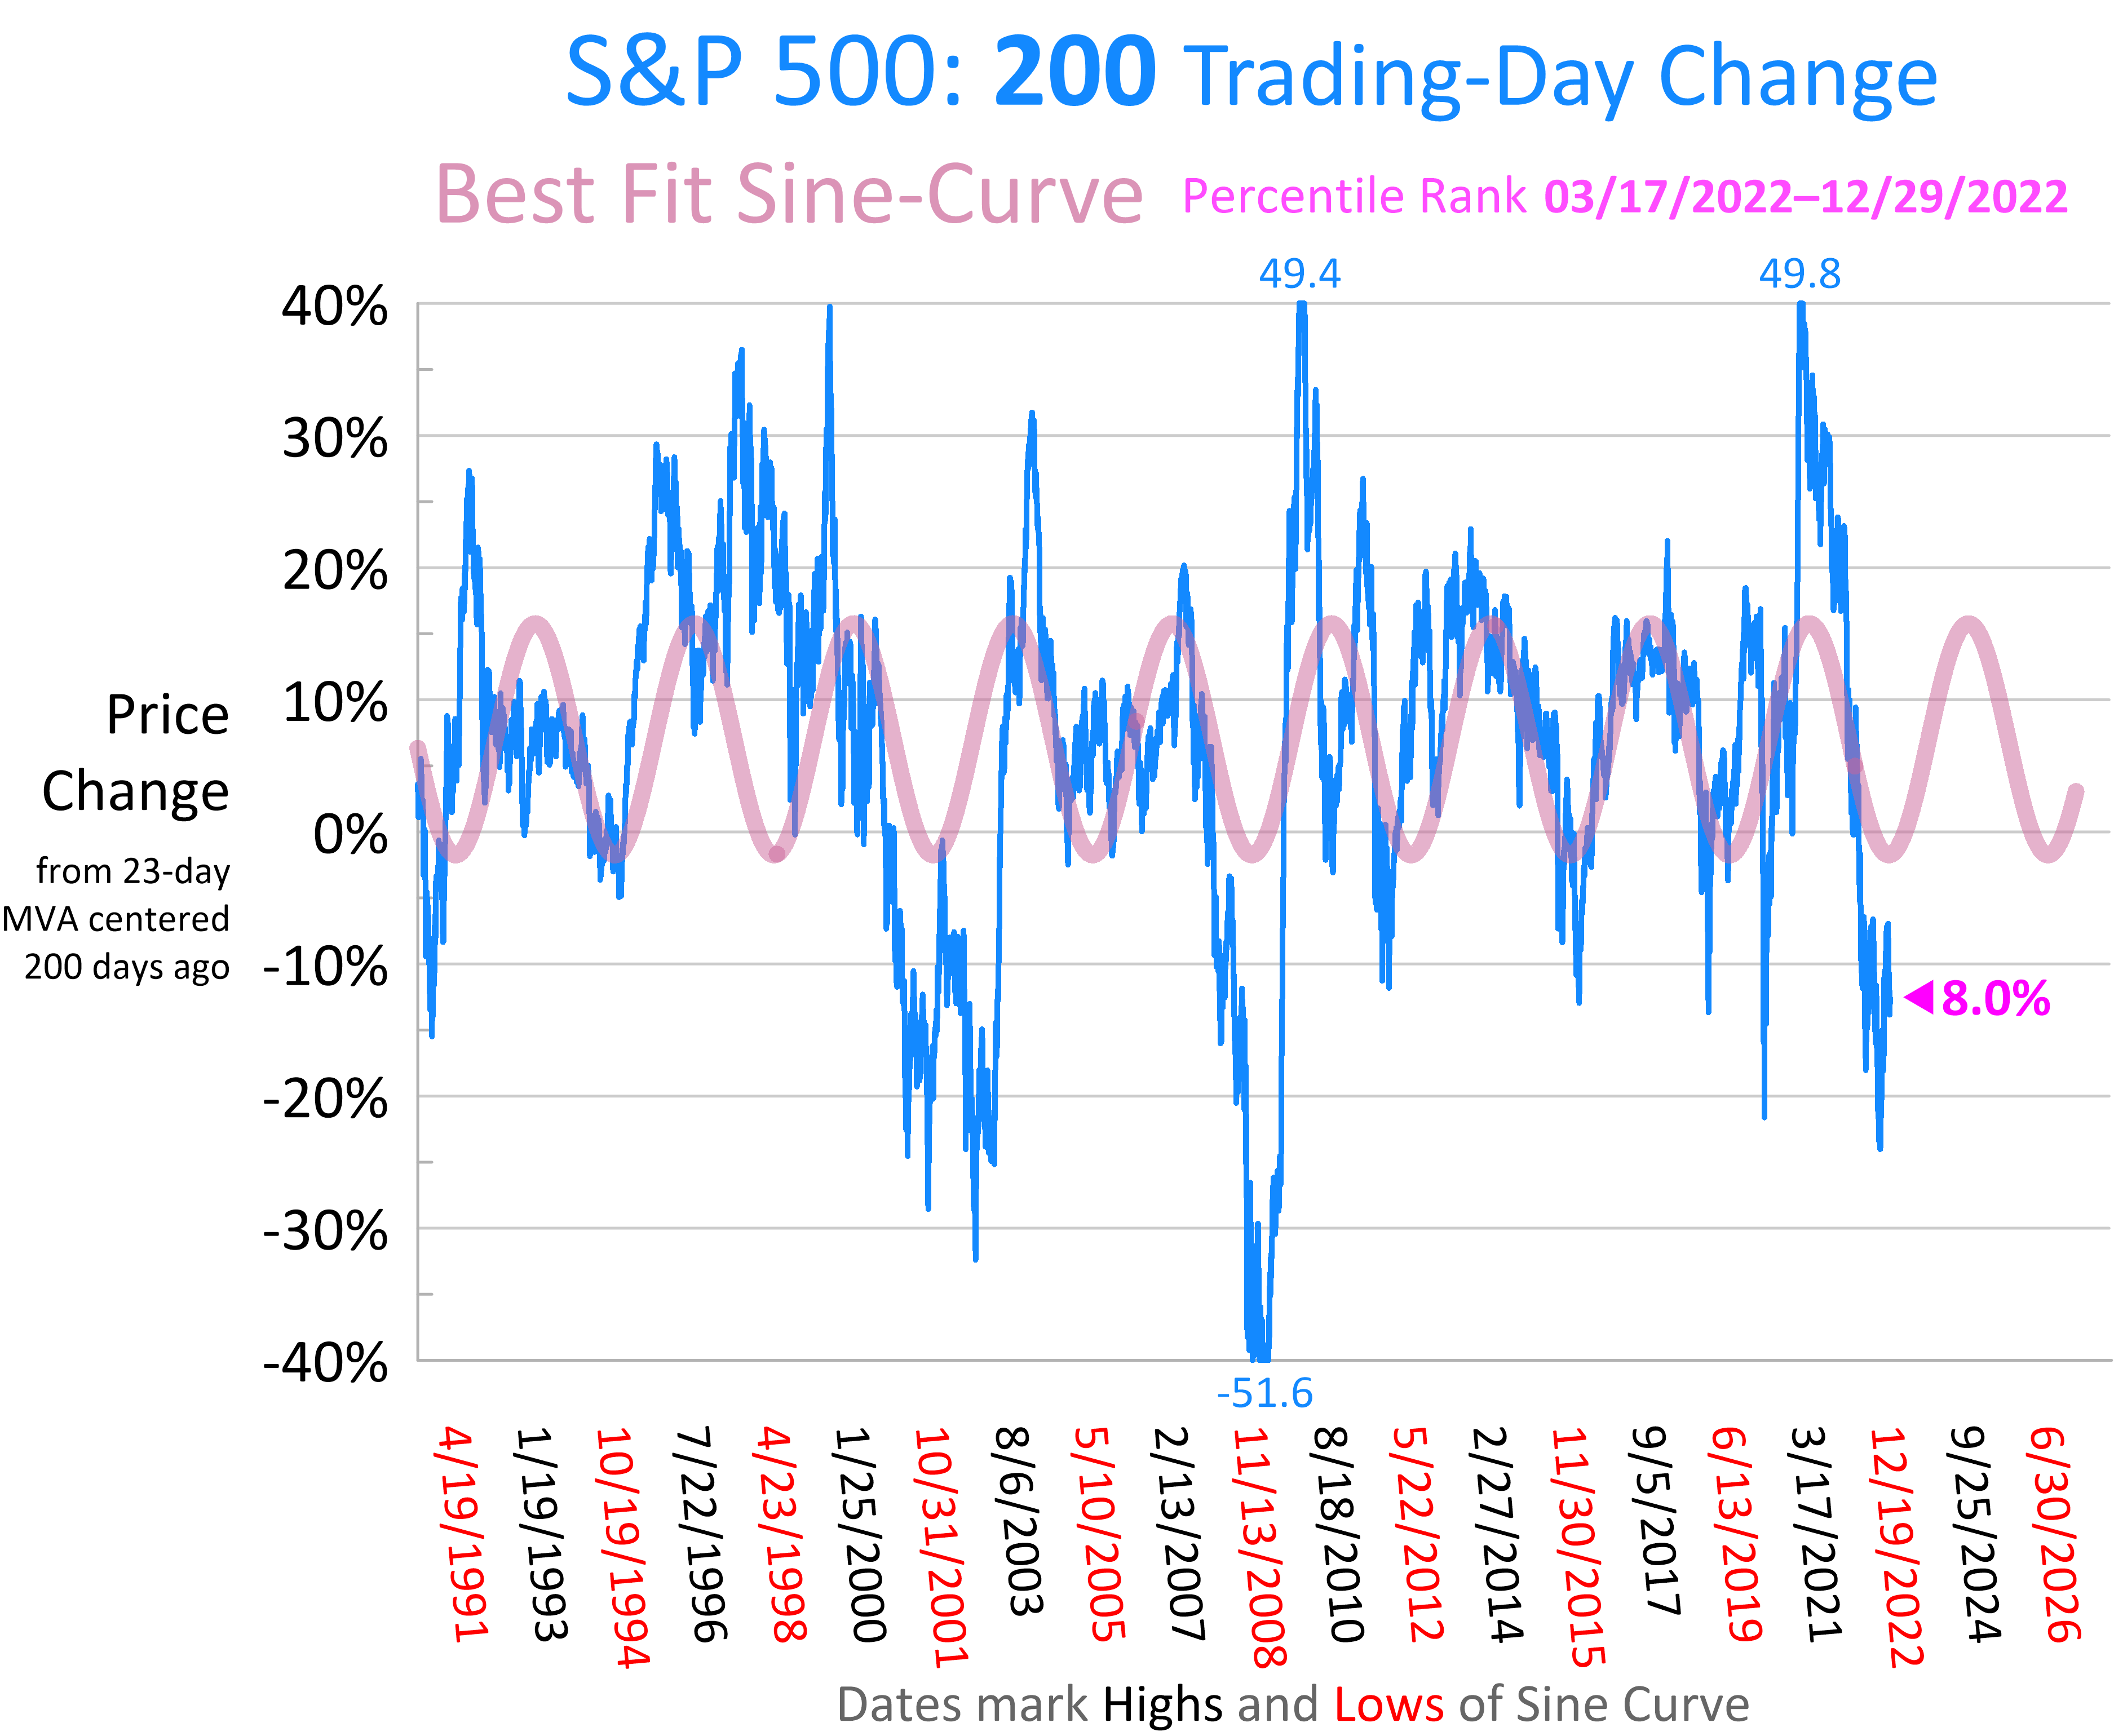
The algorithm I’m using optimizes the fit of the sine-curve to the last 10 cycles of the return period adjusting the length of the cycle and shifting where the cycle begins to find the strongest correlation. Previously, I used an algorithm that also adjusted the period of return. That algorithm suffered from over-fitting the data. It could have sudden dramatic changes in the estimated future.
The current algorithm that holds the trading-day period constant so far appears to give useful information and it is easier to put the price change in historical context. For example, the 200 trading-day period ending 12/29/22 had a -12.55% change, which is better than 8.0% of the 200 trading-day periods and worse than 92%. The percentile rank for the trading-day period ending 10/12/22 was 4.0%.
Currently, the sine-curve estimates the best 200 trading-day period in the next cycle will be 12/11/23-9/25/24. This fits pretty well with the yield curve estimating the next bear market will begin in October of 2024.
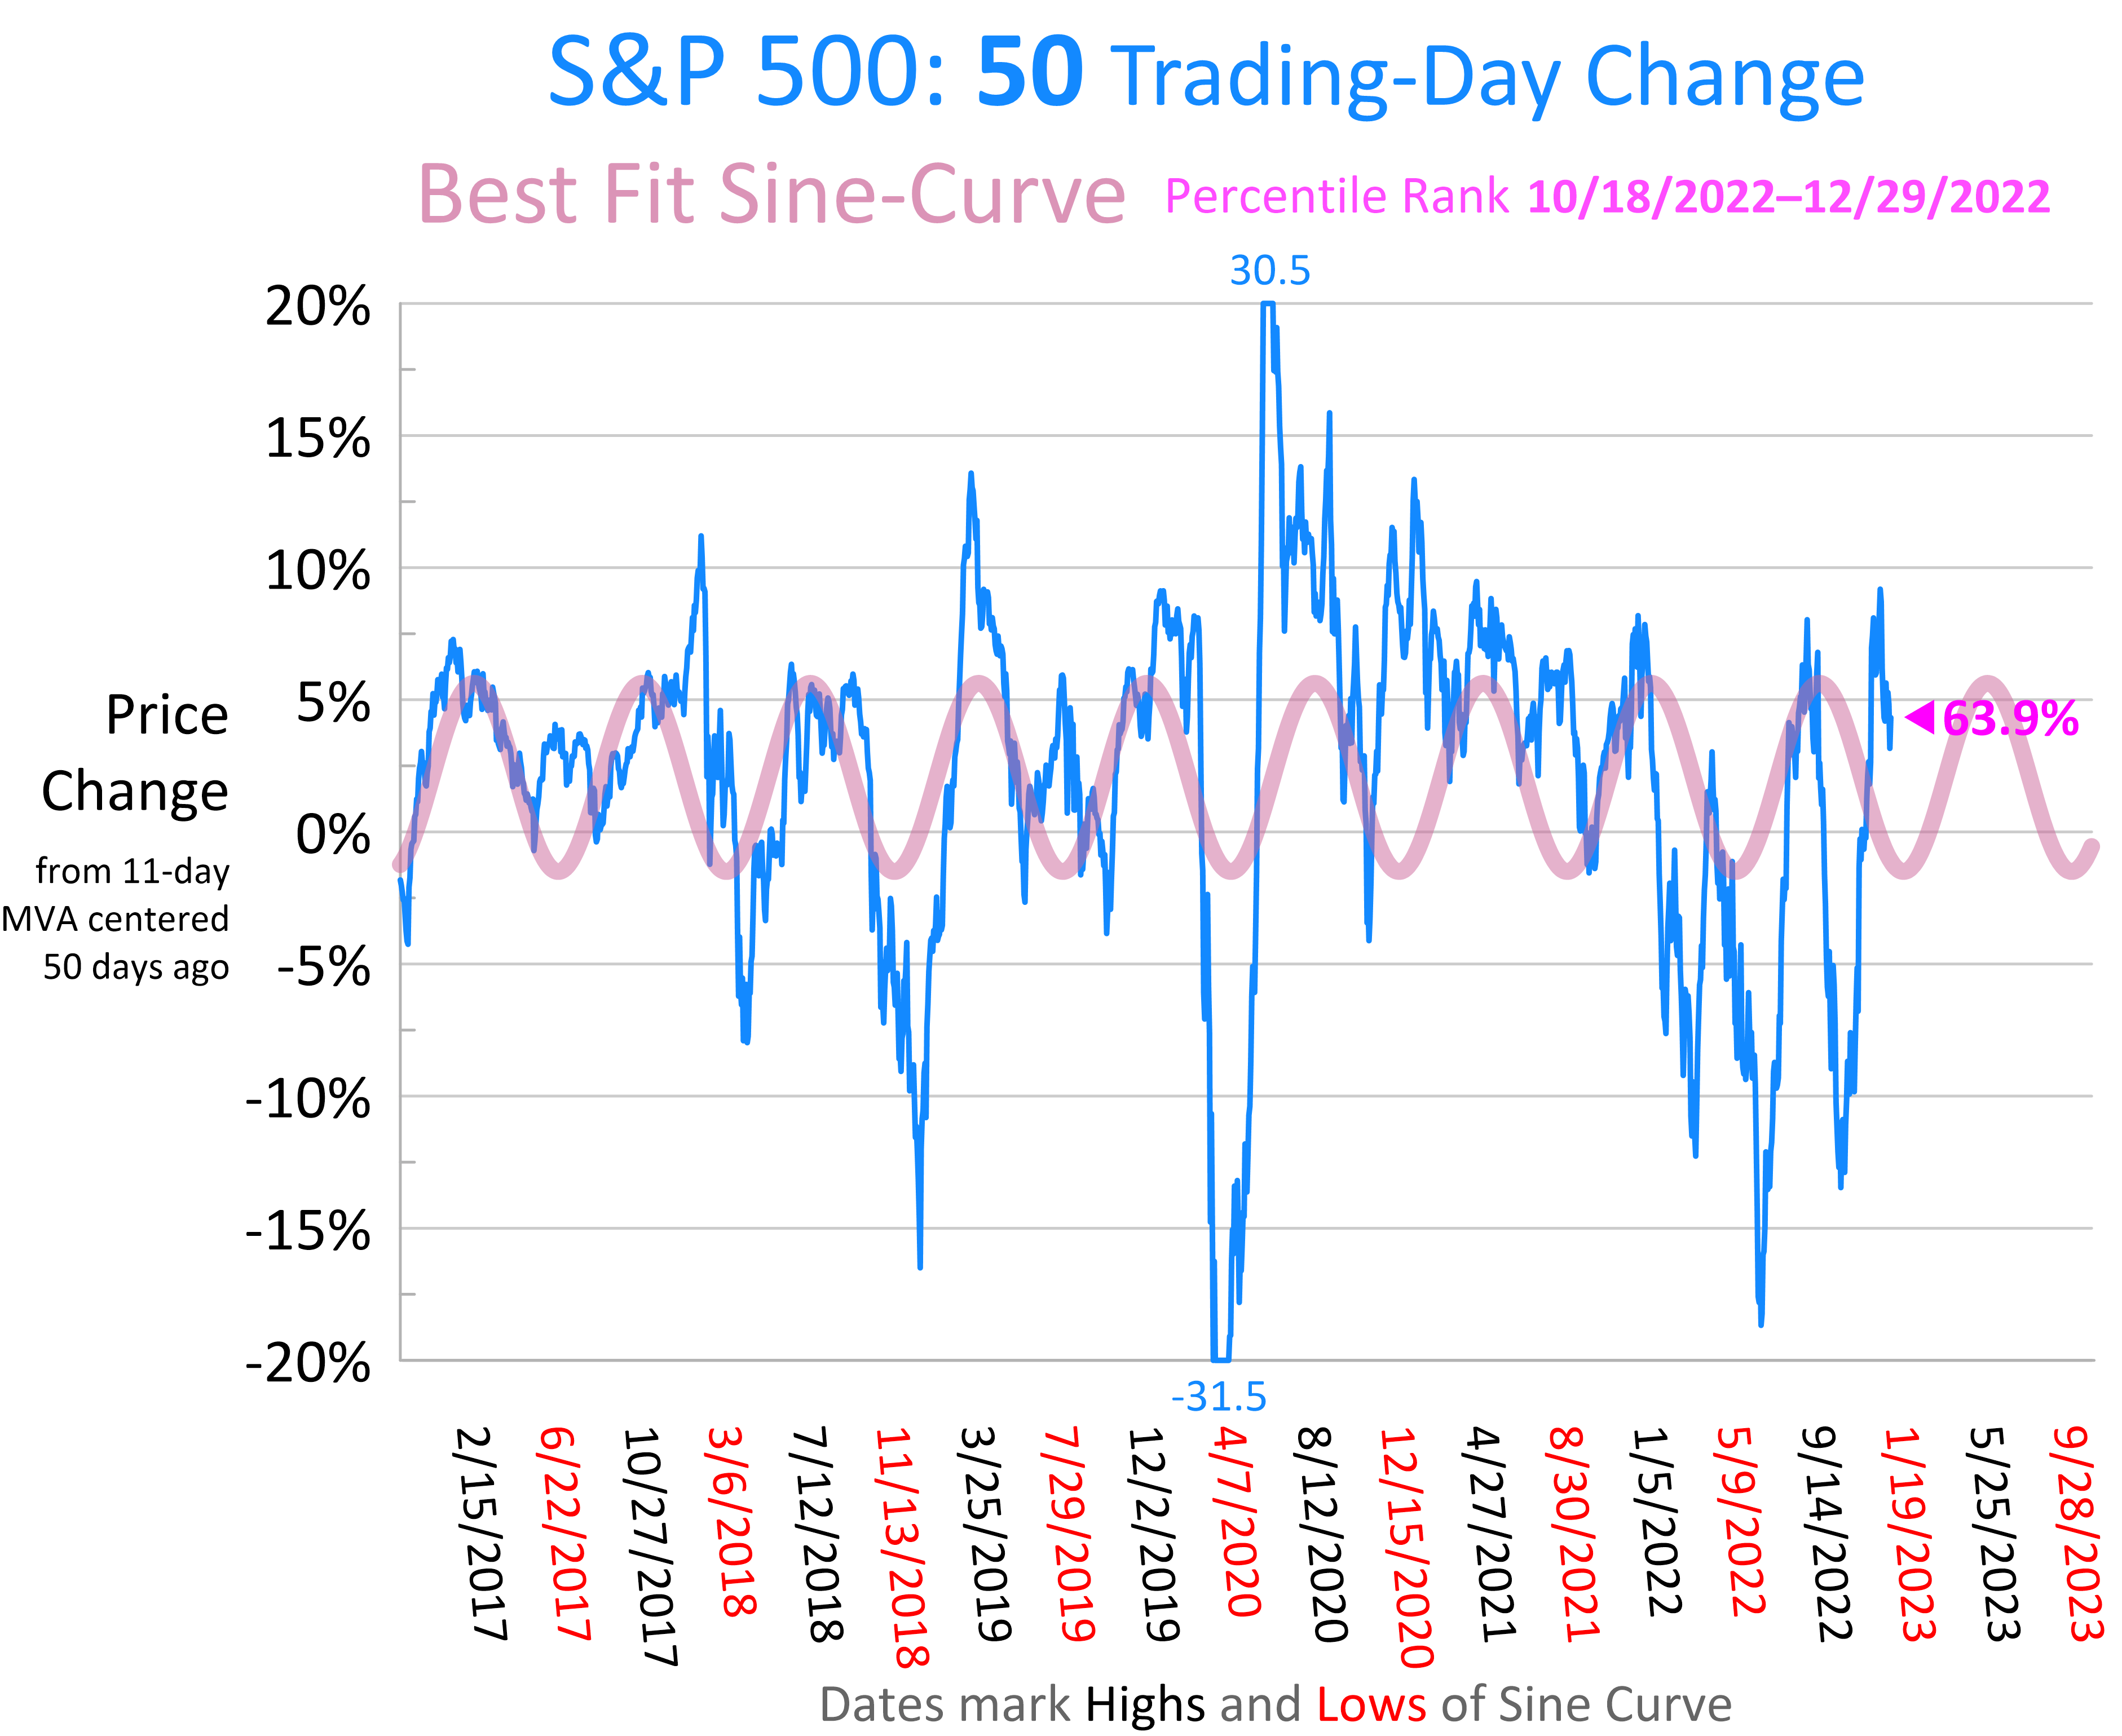
The sine-curves for the 25 and 50 trading-day periods estimate the worst periods will complete on 1/19/23 and 1/20/23 respectively. I expect the market to trend to the downside for the next three weeks or so. Whether a low point around late January turns out to be higher or lower than the low reached on the morning of 10/13/22 I expect the cycles will have turned and the bull market will begin to look more like a bull market.
Economic Leads Economic Leads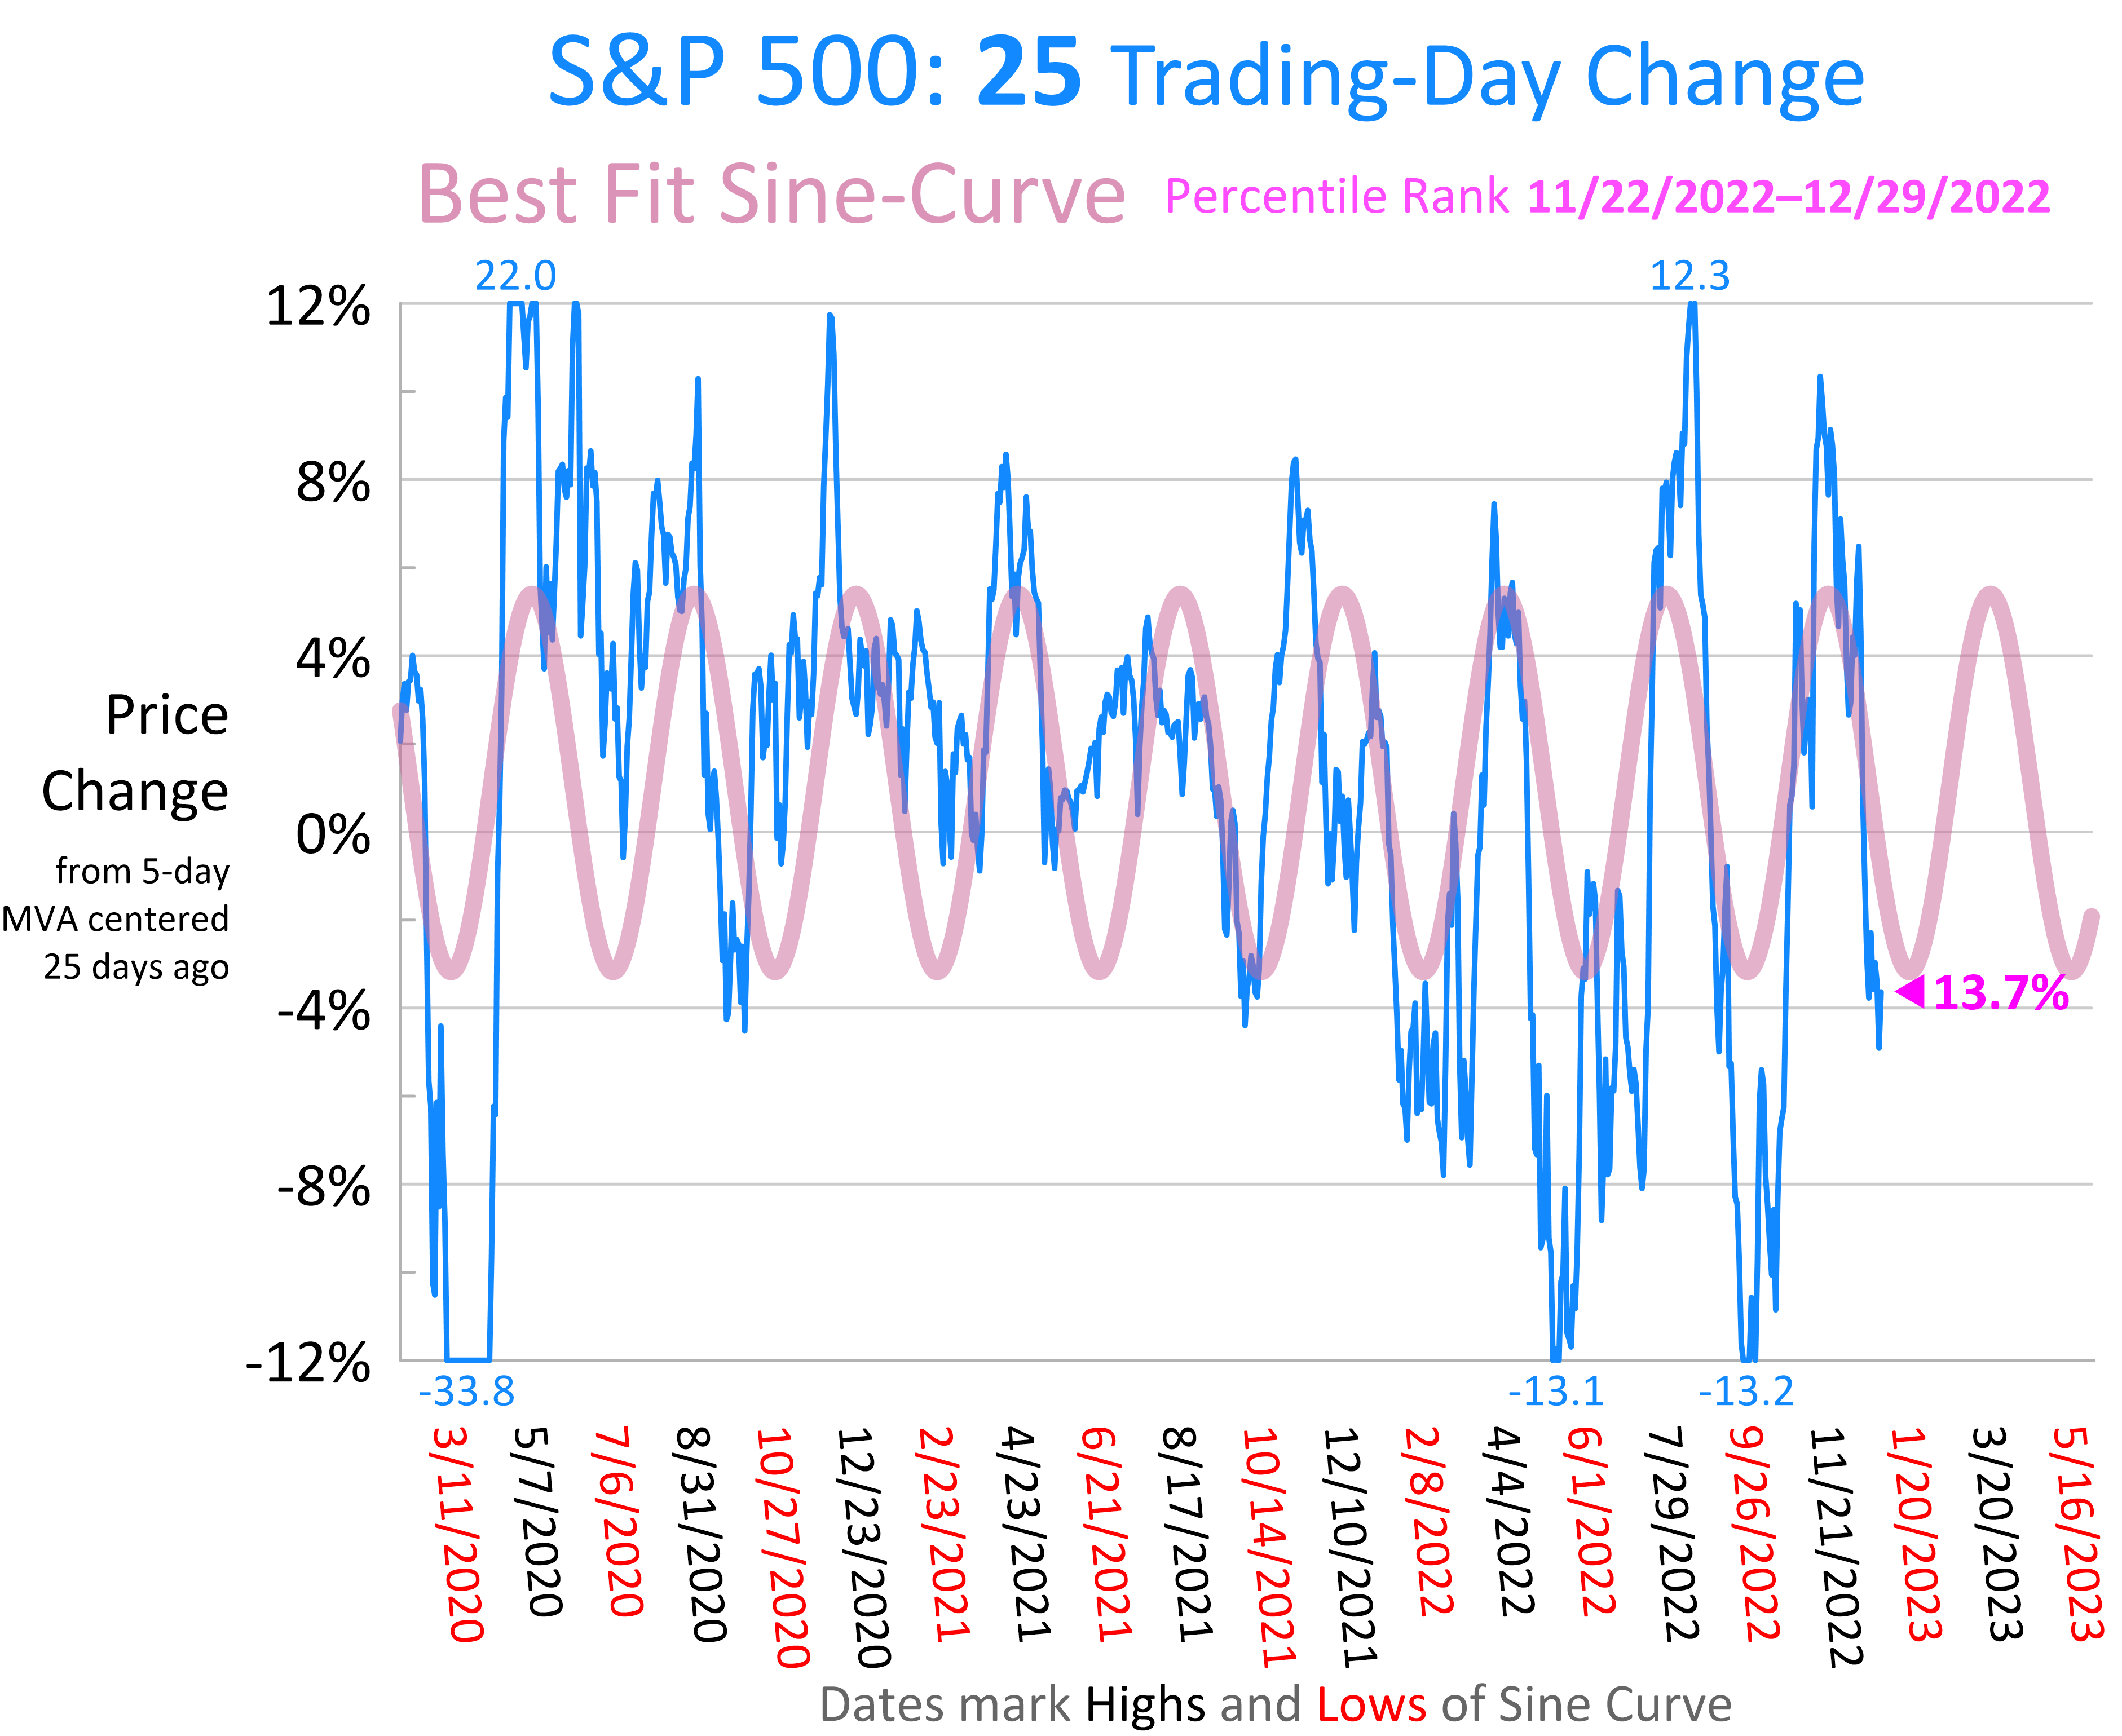
Conclusion
We’ve been fed a heavy dose of negative narratives about recession, inflation and rising interest rates for most of 2022. Those negative narratives are set to be pierced by a different reality in 2023. Get your buying list ready for mid to late January.
Be the first to comment