

BTCUSD: Bullish Engulfing Pattern Above $38,000
Bitcoin’s bearish phase has ended after touching a low of $37,649 on March 14th. As of now, the price of BTCUSD is moving in a bullish momentum above the $40,000 handle.
A renewed interest in bitcoin is observed as an alternative means of currency in Russia after the global bans imposed against Russian banks. This is one of the reasons why many investors are now buying bitcoin at present market levels.
In today’s European trading session, the propagation of the bullish trend continues with bitcoin trading above $42,000.
We can clearly see a bullish engulfing pattern above the $38,000 handle which is a bullish reversal pattern because it signifies the end of a downtrend and a shift towards an uptrend.
The Stoch and Williams percent range are indicating an overbought level which means that in the immediate short term, a decline in the prices is expected.
The relative strength index is at 60 indicating a STRONG demand for bitcoin at the current market levels.
Bitcoin is now moving above its 100 hourly simple moving average and its 200 hourly EMA.
All of the major technical indicators are giving a STRONG BUY signal, which means that in the immediate short term we are expecting targets of $43,000 and $45,000.
The average true range is indicating HIGH market volatility with a strong bullish momentum.
- A bullish reversal is seen in bitcoin above $38,000
- The Williams percent range is indicating an OVERBOUGHT level
- The price is now trading just below its pivot level of $42,357
- All of the MAs are giving a STRONG BUY market signal
Bitcoin: Bullish Reversal Seen Above $38,000
Bitcoin continues its strong bullish momentum with an upwards projection towards the level of $43,000 in the European trading session today.
In the immediate term, we are expecting a continuation of this bullish trend with the price of bitcoin ranging between $41,000 and $44,000 as it is due to enter into a consolidation phase.
The surge in the prices of bitcoin can also be explained by the optimism around the widespread usage of bitcoin in international cross border transactions between Russia and its trade partners.
The immediate short-term outlook for bitcoin is strongly bullish; the medium-term outlook is neutral; and the long-term outlook remains neutral under present market conditions.
The price of BTCUSD is now facing its classic resistance level of $42,703 and Fibonacci resistance level of $43,197, after which the path towards $44,000 will get cleared.
We can see that the daily RSI is also printing at 56 which indicates that in the medium-term prices are expected to appreciate further.
In the last 24hrs, BTCUSD has gone UP by 2.45% with a price change of $1,009, and has a 24hr trading volume of 33.989 billion USD. We can see an increase of 53.18% in the trading volume as compared to yesterday, which is due to its increased global demands.
The Week Ahead
The price of bitcoin is due to enter a consolidation phase below $43,000. We can see some range-bound movements in its levels between $41,000 and $44,000.
The on-chain metrics are also indicating a bullish outlook for bitcoin in the short-term range.
In the immediate short term this week, bitcoin’s bullish momentum is expected to continue pushing its levels above the $44,000. Also this week, the price of BTCUSD will need to remain above the important support level of $40,000.
The weekly outlook is projected at $44,000 with a consolidation zone of $42,500.
Technical Indicators:
The relative strength index (14-day): at 56.28 indicating a BUY
The average directional change (14-day): at 20.49 indicating a BUY
The rate of price change: at 9.16 indicating a BUY
The MA convergence divergence (12,26): at 420.80 indicating a BUY
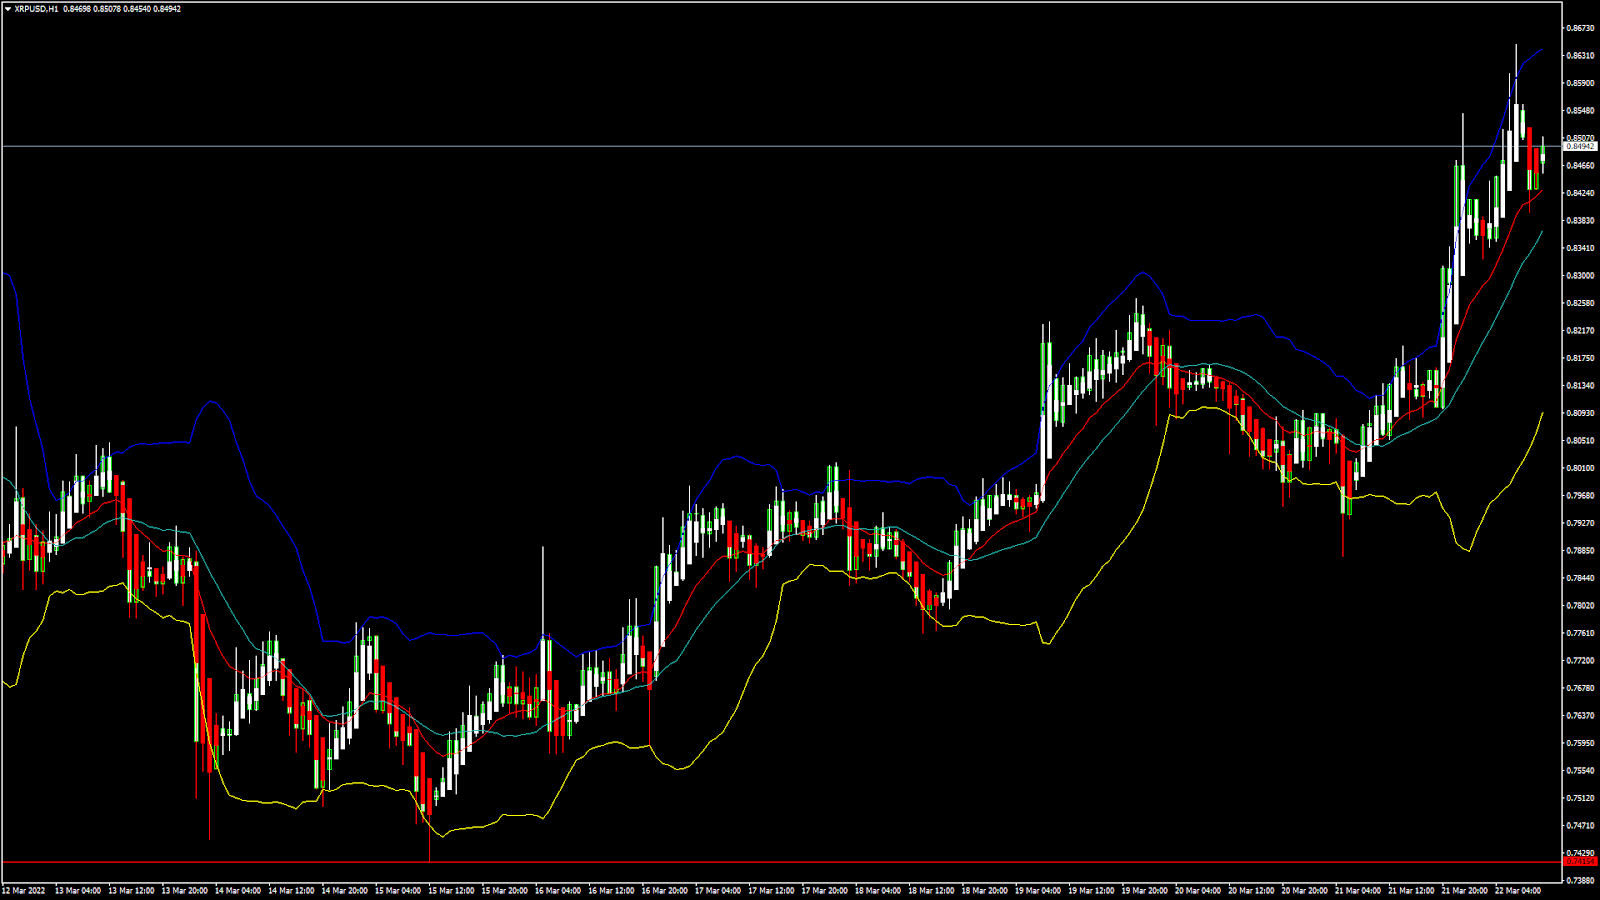
XRPUSD: Bullish Engulfing Pattern Above 0.7400
Ripple has ended its bearish phase and is now moving in a mild bullish phase above the 0.8000 handle in the European trading session today.
We can see that the appreciation in Ripple’s price continues after it touched a high of 0.8646 today in the Asian trading session.
The strength of the bullish momentum that we see today can be explained by the increased buying seen across the global cryptocurrency exchanges.
We can clearly see a bullish engulfing pattern above the 0.7400 handle which signifies the end of a downtrend and a shift towards an uptrend.
The short-term outlook for Ripple remains mildly bullish; the medium-term outlook remains neutral; and the long-term outlook is neutral.
The relative strength index is at 61 which signifies a STRONG demand for Ripple at the current market prices, and the continuation of buying pressure.
All of the moving averages are giving a STRONG BUY signal at the current market level of 0.8500.
Ripple is now trading above its pivot level of 0.8465, facing its classic resistance level of 0.8498 and Fibonacci resistance level of 0.8522, after which the path towards 0.8800 will get cleared.
- All of the technical indicators are giving a STRONG BUY signal
- Ripple continues its bullish momentum above 0.7400
- The StochRSI is giving an OVERSOLD signal
- The average true range indicates LESSER market volatility
Ripple: Bullish Momentum Seen Above 0.7400
In today’s European trading session, Ripple has been moving in a mildly bullish momentum at the level above 0.8000. The price of Ripple is making new highs which also suggests that we are expecting more upsides in the coming days. This bullish projection will result in its value appreciating above 0.8500, after which we can see some short-term correction in its prices.
The bullish trend is further validated by the daily RSI above 50 printing at 62 now, and the consolidation pattern seen this week.
The price of XRPUSD has gone UP by 4.69% with a price change of $0.03809 in the past 24hrs, and has a trading volume of 2.924 billion USD.
We can see an increase of 67.16% in the trading volume of Ripple as compared to yesterday, which is due to the increased buying seen across the global crypto markets.
This Week Ahead
The price of XRPUSD is now moving in a mildly bullish momentum above 0.8000, and we are expecting more upward swings towards the 0.9000 handle.
The price of Ripple is poised for a rally amid the global crisis and the increased reliance on XRP as a means of bank-to-bank settlements in Russia.
This week, the price of Ripple needs to remain above the crucial support level of $0.8000, after which we may see a progression of the bullish momentum.
The weekly outlook for Ripple is projected at 0.8500 with a consolidation zone of 0.8000.
Technical Indicators:
The MA convergence divergence (12,26): at 0.009 indicating a BUY
The average directional change (14-day): at 39.41 indicating a BUY
The commodity channel index (14-day): at 68.88 indicating a BUY
The Williams percent range: at -40.57 indicating a BUY
Be the first to comment