

BTC/USD, ETH/USD Price Analysis:
Bitcoin and Ethereum prices have soared in recent weeks, buoyed by rising demand for major cryptocurrencies and US Dollar weakness, with recent price action demonstrating ‘safe-haven’ characteristics of what would usually show in Gold and Silver, but have suspiciously been absent of late. However, unlike the precious metals who have faltered even with a return of USD-weakness, investors appear to be attracted to digital currencies amid increased speculation that large market players will adopt Bitcoin as an alternative payment method, driving BTC/USD above the key psychological level of $50,000, resulting in a new all-time high of$52,648, an advance of more than 58% over the past month.

Recommended by Tammy Da Costa
Download Your free Bitcoin Trading Guide
Bitcoin (BTC/USD) Technical Analysis
After retracing from yet another all-time high yesterday, the formation of a Doji candle, followed by a series of shallow candles suggests that the strong upward trajectory that has prevailed since last year, may be slowing down, with short-term price action stuck in a range between the recent high and the psychological level of $50,000. These markets have helped to define support and resistance for BTC/USD, with the 50 period Moving Average providing additional support at $48,290. Meanwhile, the Commodity Channel index (CCI) continues to test the upper bound of 100, currently resting just below, with a current reading of 82.
Bitcoin (BTC/USD) 4 Hour Chart

Chart prepared by Tammy Da Costa, IG
Ether (ETH/USD) Technical Analysis
Ethereum continues to follow in Bitcoin’s footsteps, with bulls driving price action to produce a series of fresh highs. For now, prices remain within the confines of the rising channel, looking to test the key psychological level of $2,000 for the first time ever. Would an initial inflection here be met with sellers? Or will the bullish enthusiasm that’s continued to drive allow for a clean breakout beyond the psychological level? Meanwhile, the CCI remains above 100, potentially indicating that the second biggest cryptocurrency may be treading in overbought territory.
Ethereum (ETH/USD) 4 Hour Chart
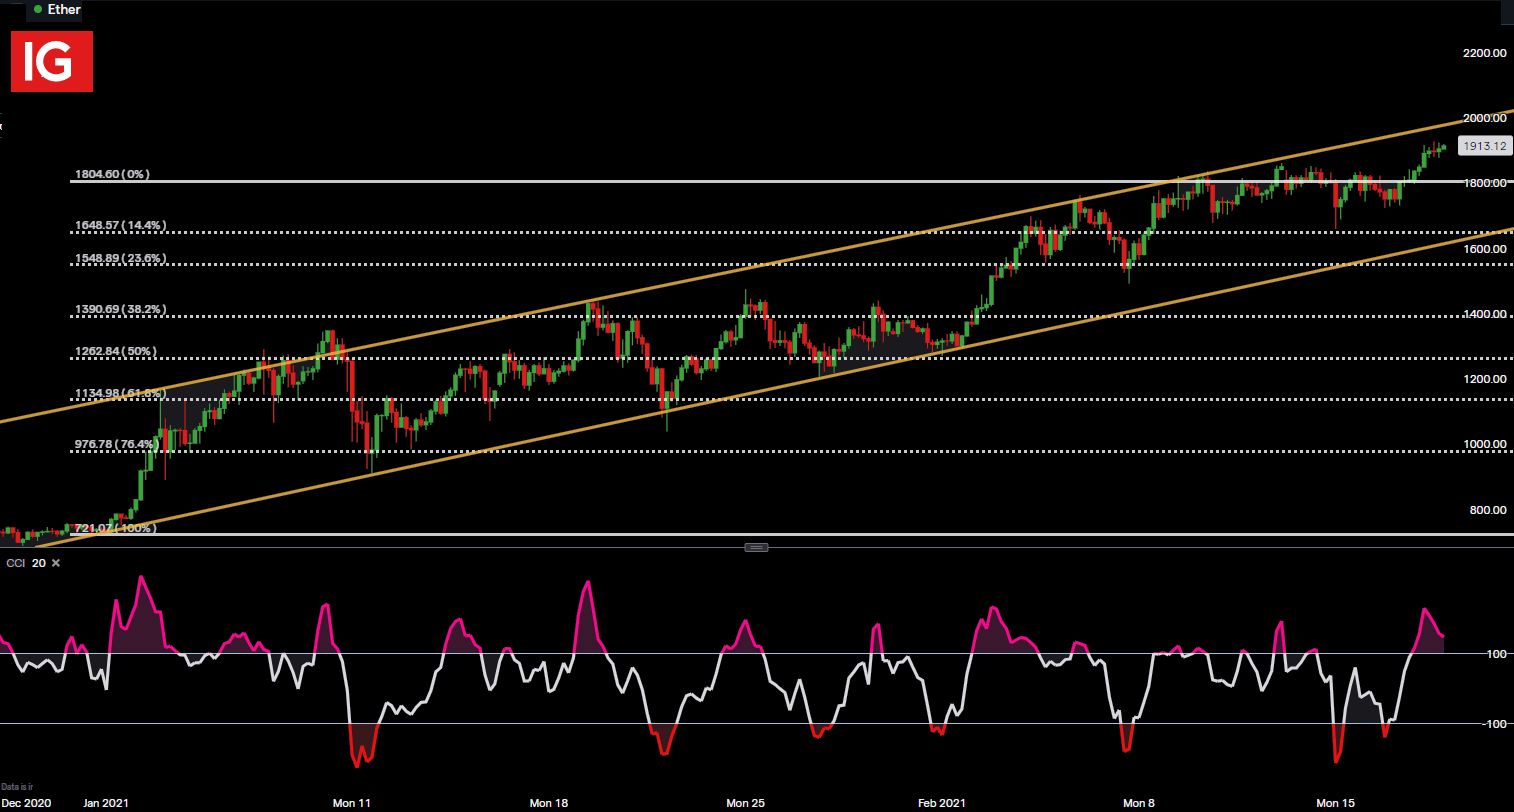
Chart prepared by Tammy Da Costa, IG
| Change in | Longs | Shorts | OI |
| Daily | -3% | 15% | -1% |
| Weekly | -3% | 5% | -2% |
— Written by Tammy Da Costa, Market Writer for DailyFX.com
Contact and follow Tammy on Twitter: @Tams707
Be the first to comment