

gorodenkoff/iStock via Getty Images
Investment Summary
Shares of Bruker Corporation (NASDAQ:BRKR) have broken out from a 12-month-long downtrend, and I opine this presents as a compelling opportunity to unlock value in this landscape. I sized up our original BRKR position last week after supportive market data and the company’s raised FY22 guidance. As seen in Exhibit 1, prices have poked above the long-term resistance line, after having bottomed at pre-pandemic levels. Further upside looks justified based on fundamentals and market data. Net-net, I rate BRKR a buy with a price target range of $75-$87.
Exhibit 1. BRKR 2-year price evolution with recent breakout above downtrend
Data: Updata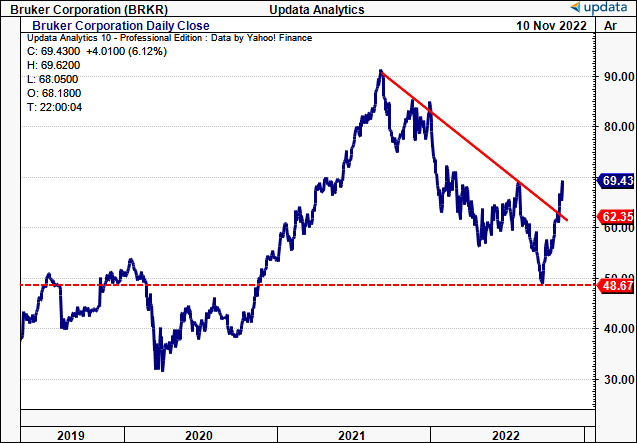
Recent developments for BRKR
BRKR announced the acquisition of Inscopix, Inc. on Nov 8. Specific details of the detail weren’t publicly disclosed. It was founded in 2011 and has niche expertise in the market for mini-microscopes, also known as “miniscopes.” This expertise has seen its products deployed amongst various biopharma and biotech companies worldwide in the fields of neuroscience.
Inscopix’s FY22 revenue is projected to be $20-$25mm, and BRKR forecast double-digit growth at the top-line for Inscopix looking ahead. The acquisition is, therefore, expected to be accretive to BRKR’s earnings and its position in the functional brain imaging segment.
Specifically, BRKR wants to coordinate its high-resolution multiphoton microscopy with Inscopix’s free-moving head-mounted imaging technology. We foresee this coming into effect from Q4, with similar integrations realized into FY23.
Second entry point for FY22
With the current state of equity markets, I’m now more broadly looking for the convergence of price distribution towards fundamentals in my positioning. BRKR came into FY22 with strong fundamental momentum, although this wasn’t enough to bypass the broad selloff in equities in FY21/22. Prices maintained a strong down-channel until finding a range around May.
As seen on the chart below (showing weekly bars), we made our first entry into BRKR on 13 May (FY22). I entered long after a volume reversal and breakout, coupled with the weekly close above the 50DMA.
To me, this indicated a substantial turning point with tremendous buying support, against trend. Whilst the move extended for 13 weeks, it then reversed course in July and lost relative strength vs. the SPX. As prices walked back below the 50DMA, I pruned the position by 50% as risk management. I eventually realized a 16% loss on initial capital at the bottom.
It was beginning to look bleak for BRKR, and further downside would have seen me exit the position completely with a c.20% loss on capital. Then in late September, BRKR produced another volume breakout and reversal, signifying an influx of buyers. The entire move led to a 12-week cup and handle formation (shown).
BRKR’s Q3 numbers then surprised to the upside, producing another volume breakout and reversal. This signified my second entry point at $59.30 given I had more confluence to work with, and prices were now trending above the 50DMA. I now see a bullish formation with the last 4-weeks closing in the green with successive new highs and look to see the stock close above its previous high of ~$70. Valuations are supportive of this (discussed later).
Exhibit 2. Now 7 weeks finishing higher following consolidation with volume breakout x2. Looks bullish and suggests further upside in next 2-3 months
Data: HB Insights; Updata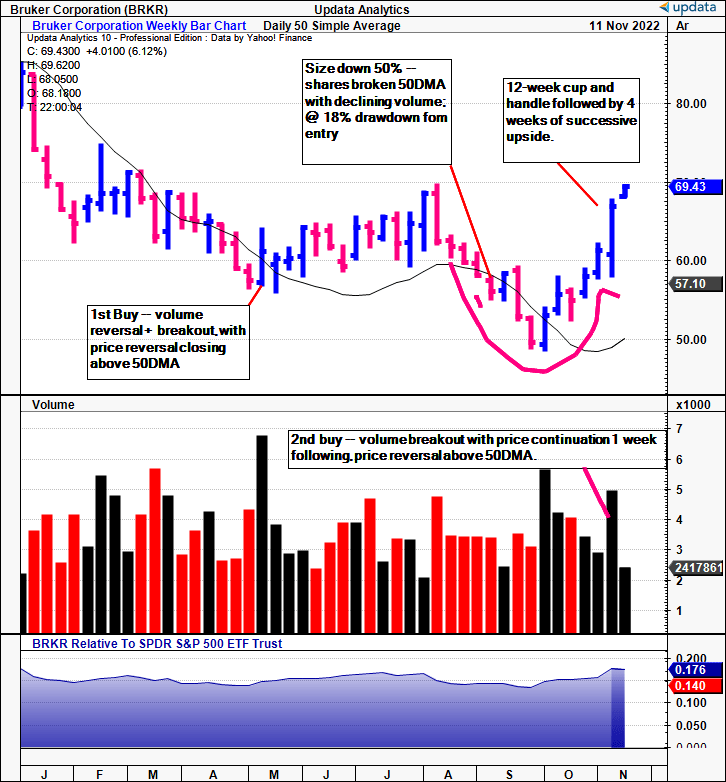
Validating the momentum for BRKR
With market data turning bullish for BRKR in my estimation, the question turns to what justifies the continuation of the recent uptrend.
The global scientific instruments market is expected to grow at CAGR 5.2% into 2030, valued at c.$39Bn in FY21. BRKR captured ~5.17% of this market last year (based on FY21 revenue). Meanwhile, the superconducting materials market is poised for 8.4% growth into 2030. BRKR has about 4.6% of market share and expects to benefit from the growth of the market. We project BRKR to exceed these market growth rates from FY24.
In addition, there looks to be substantial earnings upside over the coming quarters. We see ~20% YoY EPS growth in Q4 FY22, and another 20% in Q2 FY23. Management upgraded guidance on the Q3 earnings call too.
For FY22, BRKR now expects 8-10% growth at the top-line, calling for $2.66Bn in revenue. This bakes in an 800bps forex headwind as well and could be subject to change to the upside. We also project 10% YoY growth in EPS for FY22 to $2.31 with this stretching up another 9.75% and 12.2% into the years ahead.
Exhibit 3. BRKR forward earnings estimates
Data: HB Insights Estimates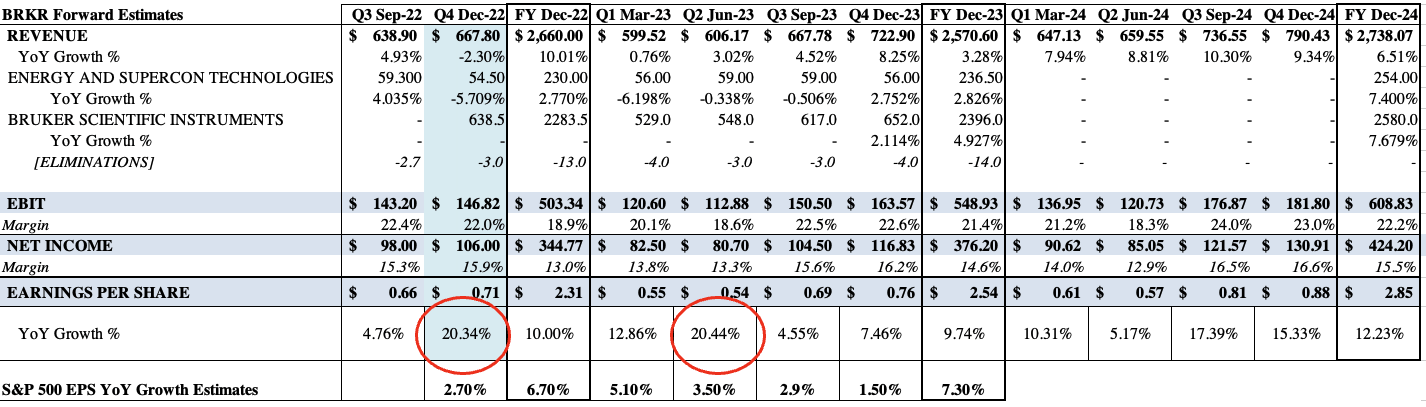
As seen in Exhibit 4, BRKR’s forecasted EPS growth looks set to outpace that of the SPX looking ahead. This divergence is another bullish weight to the risk/reward symmetry in my opinion.
With a slowdown in EPS likely as we head into FY23, BRKR’s earnings upside is likely to be rewarded by the market. We’ve projected BRKR to deliver an average 7.95 percentage point spread in EPS growth above the benchmark over the coming 2-years. This earnings upside suggests to me that further upside is warranted.
Exhibit 4. Average spread over SPX EPS growth est. = 7.95 percentage points
Data: HB Insights Estimates, Bloomberg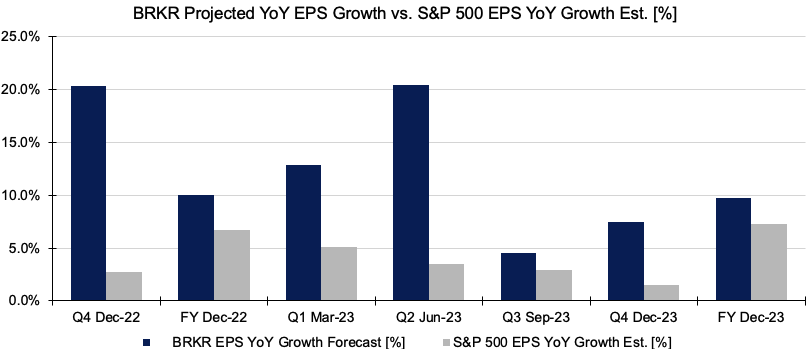
The relationship between free cash flow (“FCF”) and return on invested capital (“ROIC”) is also a standout for BRKR in my estimation. As seen in the chart below, FCF remains within its cyclical trend whilst ROIC has pushed from lows to c.14% on a TTM basis in the last quarter.
A negative/declining FCF is preferred when the ROIC is above the WACC hurdle, and there’s abundant liquidity. What’s satisfying to see for BRKR is that in times where FCF has reversed or produced an outflow, ROIC has trended higher.
As BRKR’s average FCF print has tightened from FY20, it has subsequently generated higher return on its investments. This is particularly true in Q2 FY22, where the FCF outflow of >$50mm has pulled through to TTM ROIC of 14.2%, above the WACC hurdle of 9.7%. This is another bullish weight in the investment debate in my opinion and evidence’s BRKR’s defensive characteristics.
Exhibit 5. Coupling of FCF and ROIC illustrates strength in generating income within each capital budgeting cycle
Data: HB Insights, BRKR SEC Filings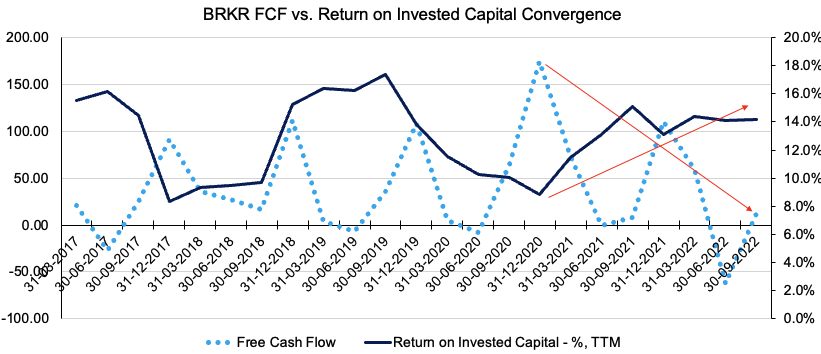
Technicals also supportive
As seen on the daily cloud chart below, shares have punched up through the cloud and the lag-line also rests in bullish territory. The move is further validated by the uptick in on balance volume that’s been in situ since late September, whilst momentum has followed suit. Trading above the cloud is bullish support and this is a further indication of the expected return for BRKR.
Exhibit 6. Trading above cloud support
Data: HB Insights, Updata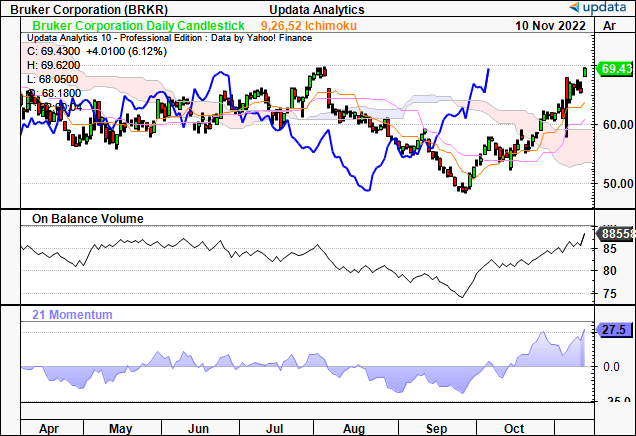
We, therefore, see upside targets to $74 for the BRKR share price based on point and figure charting seen below.
Exhibit 7. Upside targets to $74.50
Data: HB Insights, Updata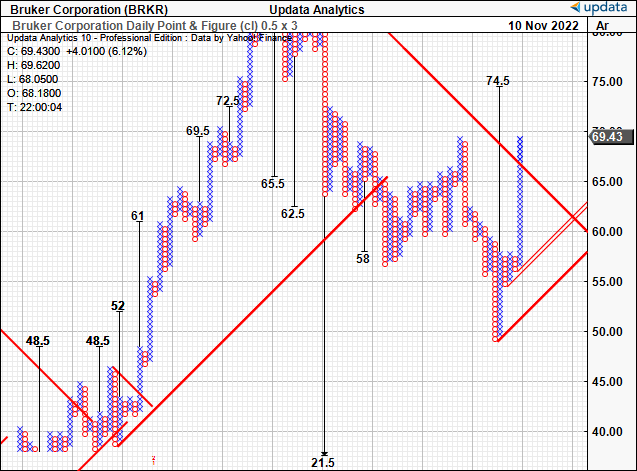
Valuation and conclusion
Shares trade at 38x trailing earnings, and consensus has BRKR priced at 30x forward P/E. The stock is richly priced at 9.5x book value, reducing the investor ROE to just 2.87% if paying this multiple.
Despite this, the CFFO to earnings ratio remains at ~1.1x on a forward basis, suggesting there’s a good deal of cash flow backing the company’s valuation (forward P/E). I’m therefore comfortable in valuing BRKR using forward earnings.
Exhibit 8. Forward earnings backed by robust cash flow
-
BRKR CFFO: Earnings ratio vs. Implied forward P/E.
Note: Implied forward P/E calculated as quarterly/annual EPS estimates with current share price as anchor. (Data: HB Insights Estimates)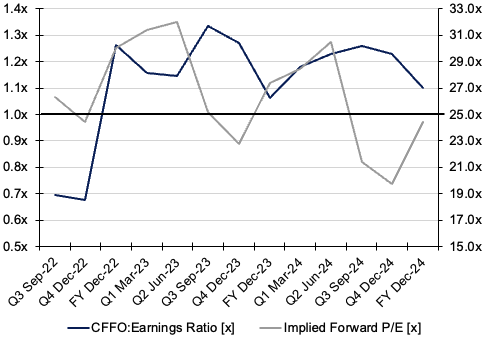
As seen below, our FY22 EPS estimates of $2.31 price BRKR at a fair forward P/E 37.7x, suggesting it’s worth $87, a 25.5% return objective. To pay a fair cost of equity of 2.65% (based on the math seen below) to earn 25.5% is equally attractive. Therefore, I advocate to buy BRKR at $69 for a 25% return objective.
Exhibit 9
Data: HB Insights Estimates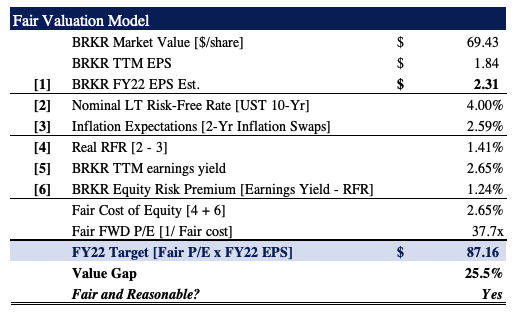
Net-net, I firmly believe BRKR’s recent breakout is justified and that further upside could be on the cards. We’ve sized up our original position following Q3 earnings, price action, and supportive valuations. Bruker Corporation appears fairly valued at $74-$87 based on discussions raised throughout this analysis. Rate buy.
Be the first to comment