

Justin Sullivan/Getty Images News
Broadcom Inc. (NASDAQ:AVGO) is a leading semiconductor company with a broad portfolio of patents (over 23,000) and market leadership in niche products of logic semiconductors such as ethernet switches (76%) and ASICs (35%) and analog semiconductors including fibre channel (75%). Also, we know that Broadcom has had an acquisition strategy based on its past M&A activities since 1960. We determined that its M&A strategy had been beneficial to its revenue growth, with M&A contributing to 54% of total revenue growth in the past 10 years.
Furthermore, we believed its acquisition of CA Technologies highlights its continued diversification into the software industry and confirmed its expansion with the acquisition of Symantec’s enterprise security business. Moreover, its software expansion is supported by its partnerships with major cloud service provider Google Cloud by migrating its suite of enterprise software to the cloud, improving its scale and deployment efficiencies. Following these acquisitions, we confirmed the integration of its infrastructure software businesses with the launch of integrated products and improved its profitability by leveraging its common customer base to streamline its SG&A activities and increase its focus on R&D.
Additionally, we determined that Broadcom has a dividend payment strategy based on cash flows (50%) and we forecasted its dividends per share to grow by 18% on average through 2024 based on expected cash flows. However, we see the company’s high and rising debt levels could be a concern for its acquisition strategy.
Recently, the company announced its acquisition of VMware (VMW) for a consideration of approximately $61 bln from an even split between cash and stock. This is expected to be completed by FY2023. The announcement of the deal is unsurprising to us, as we understood that the company has an acquisition strategy based on its past M&A activity since 1960. Previously, we already analyzed and expected the company to continue its diversification into the software industry as we saw it more progressively moving into software with 3 acquisitions, starting with Brocade in 2017 and expanding through its acquisitions such as CA Technologies in 2018 and Symantec Enterprise Security in 2019.
To determine the impact of the acquisition on the company, we first analyzed VMware’s products and customers. We estimated its potential revenue synergies by determining whether it serves a common customer base with Broadcom which are enterprise customers based on its business relationships with the Fortune 500 firms. Additionally, we then examined whether Broadcom is planning to shift VMware’s license customers to subscriptions and projected its revenue growth and contribution to Broadcom.
Moreover, we examined the potential for integration opportunities between Broadcom and VMware by targeting a common customer base on its operating expenses including SG&A and R&D by comparing Broadcom’s software segment margins with its previous acquisitions. We then projected the company’s operating margins through 2026 based on management’s targeted EBITDA contribution.
Lastly, we analyzed the deal’s acquisition cost with a mix of cash and stock to determine its impact on its cash flows and net debt through 2026. Also, we determined and analyzed its WACC pre-and post-acquisition with the increased debt.
VMware Revenue Opportunity
VMware provides a “core cloud infrastructure that powers modern enterprises.” The company’s product portfolio includes its
vSphere server virtualization platform, vSAN data storage virtualization solution, vRealize cloud management platform that provides automation, analytics and life cycle management for private cloud workloads and NSX.
Besides that, VMware’s Tanzu platform “provides an end-to-end modern application management platform and end-user and security solutions.” According to Gartner (IT), VMware was the market leader in the global virtualization infrastructure software market in 2021 with a market share of 72%.
According to Broadcom, the acquisition supports its software business and position to target the same type of large multinational enterprise customers. The company highlighted that its customers’ demands include retaining control over their infrastructure by deploying applications that require software to develop and run the applications.
By adding VMware, we will bring significant scale to Broadcom’s software business and reinforce our position as a premier provider of mission-critical platform solutions to enterprises globally. – Hock Tan, CEO
Additionally, management also highlighted the deal to target its common customer base. According to VMware, the company already serves 99% of Fortune 500 firms. In comparison, Broadcom’s software presentation highlighted that its software segment serves 80% of Fortune 500 firms. Thus, we believe that the acquisition of VMware could provide Broadcom with opportunities to strengthen its presence among enterprise customers by leveraging VMware’s solid market leadership and presence among the Fortune 500 firms and create revenue synergies for the company through upselling and cross-sell opportunities which are consistent to its overall software expansion strategy. Thus, we estimated its revenue synergies by calculating its software revenue based on its Fortune 500 customer presence pre-acquisition at 80% to 99% post-acquisition.
|
Estimated Revenue Synergies ($ mln) |
2021 |
|
Broadcom Software Revenue (‘a’) |
7,067 |
|
Enterprise Customer Presence (Pre-acquisition) (‘b’) |
80% |
|
Enterprise Customer Presence (Post-acquisition) (‘c’) |
99% |
|
Broadcom Estimated Software Revenue (With Increased Customer Presence) (‘d’) |
8,745 |
|
Revenue Synergies (‘e’) |
1,678 |
|
Revenue Synergies as % of Software Revenue |
24% |
*d = a/b x c
e = d – a
Source: Broadcom, VMware, Khaveen Investments
Based on the table above of our estimates of its revenue synergies, we expect the acquisition to generate $1,678 mln in revenue synergy opportunities for Broadcom’s software segment which is 24% of its 2021 segment revenue. Furthermore, Gartner highlighted in the quote below the synergies between Broadcom’s mainframe solutions with VMware’s Tanzu platform.
There are synergies with some of the CA tools for CI/CD and DevOps that could combine well with Tanzu, for those enterprises that are considering what to do with their legacy workloads, – Dennis Smith, Research VP in Gartner’s Infrastructure and Operations division
Furthermore, in line with its previous acquisitions including CA and Symantec’s enterprise security, the company explained that it is committed to shifting VMware’s perpetual license customers towards a subscription model.
The other top line is you can see that VMware has a perpetual model a lot in — a lot of their on-prem licenses, they have a substantial $3 billion perpetual. And we are converting them to over time — over the next couple of years to subscription. – Hock Tan, CEO
|
VMware Revenue Projections ($ mln) |
2016 |
2017 |
2018 |
2019 |
2020 |
2021 |
2022F |
2023F |
2024F |
2025F |
2026F |
|
License (switch to a subscription model) |
2,350 |
2,628 |
3,042 |
3,181 |
3,033 |
3,128 |
3,320 |
3,801 |
4,671 |
6,130 |
8,046 |
|
Growth % |
-2.2% |
11.8% |
15.8% |
4.6% |
-4.7% |
3.1% |
6.1% |
14.5% |
22.9% |
31.3% |
31.3% |
|
Subscription and SaaS |
687 |
927 |
1,303 |
1,877 |
2,587 |
3,205 |
3,596 |
4,720 |
6,195 |
8,131 |
10,672 |
|
Growth % |
36.9% |
34.9% |
40.6% |
44.1% |
37.8% |
23.9% |
31.3% |
31.3% |
31.3% |
31.3% |
31.3% |
|
Services |
4,403 |
4,781 |
5,268 |
5,753 |
6,147 |
6,518 |
7,051 |
7,627 |
8,250 |
8,924 |
9,654 |
|
Growth % |
9.7% |
8.6% |
10.2% |
9.2% |
6.8% |
6.0% |
8.2% |
8.2% |
8.2% |
8.2% |
8.2% |
|
Total |
7,440 |
8,336 |
9,613 |
10,811 |
11,767 |
12,851 |
13,966 |
16,148 |
19,116 |
23,186 |
28,372 |
|
Growth % |
7.5% |
12.0% |
15.3% |
12.5% |
8.8% |
9.2% |
8.7% |
15.6% |
18.4% |
21.3% |
22.4% |
Source: VMWare, Khaveen Investments
Based on VMware’s revenue breakdown, its subscription service represented 25% of its total revenues and was its fastest-growing segment with 10-year average revenue growth of 36.4%. On the other hand, its license revenue was 24% of its total revenue with an average growth rate of 4.7%. We forecasted VMware’s revenue based on its license, subscription and segment revenue based on its past 5-year average growth rate. For its subscription segment, we tapered down its average growth by 5% as a conservative estimate. To account for the switch from license revenue to subscriptions, we assumed its revenue growth to accelerate to 31.3% by 2025 based on its average subscription growth rate tapered down by 5% (31.3%).
|
Acquisition |
Pre-Acquisition (5-year Average Revenue Growth %) |
Post-Acquisition (2-year Revenue Growth) |
|
CA Technologies |
-2.4% |
N/A |
|
Brocade |
1.8% |
N/A |
|
Symantec Enterprise Security |
2.6% |
N/A |
|
Average |
0.04% |
17.5% |
|
VMware |
11.6% |
17.0% |
Source: CA, Brocade, Symantec, VMware, Khaveen Investments
For a comparison with its previous acquisitions, VMware had a higher average 5-year revenue growth rate before the acquisition (11.6%) than all 3 of its previous acquisitions which had a weighted average growth of only 0.04%. In comparison, its 2-year average software segment post-acquisition had an average growth rate of 17.5% which we believe highlights its revenue growth acceleration following Broadcom’s shifting its focus on enterprise clients and from a license to a subscription model. Therefore, we expect VMware growth to accelerate following its acquisition as the company shifts towards subscriptions as well and we forecasted its 2-year average growth post-acquisition to increase to 17% from 11.6%.
According to Broadcom, the deal is expected to be completed by FY2023 subject to regulatory and shareholder approval. Based on our revenue projections for Broadcom from our previous analysis, we factored in VMware’s revenue contribution in FY2023.
|
Broadcom Revenue Projections ($ mln) |
2020 |
2021 |
2022F |
2023F |
2024F |
2025F |
2026F |
|
Semiconductor Solutions |
17,267 |
20,383 |
22,043 |
23,839 |
25,780 |
27,880 |
30,151 |
|
Semiconductor Solutions Growth % |
18.05% |
8.15% |
8.15% |
8.15% |
8.15% |
8.15% |
|
|
Infrastructure Software |
6,621 |
7,067 |
7,622 |
8,221 |
8,869 |
9,570 |
10,329 |
|
Infrastructure Software Growth % |
28.31% |
6.74% |
7.85% |
7.87% |
7.88% |
7.90% |
7.92% |
|
Total Broadcom |
23,888 |
27,450 |
29,665 |
32,060 |
34,650 |
37,451 |
40,480 |
|
Growth % |
14.9% |
8.1% |
8.1% |
8.1% |
8.1% |
8.1% |
|
|
M&A Related Revenue Growth % |
1,327 |
1,327 |
1,327 |
1,327 |
1,327 |
||
|
Total Broadcom (With M&A) |
23,888 |
27,450 |
30,991 |
33,386 |
35,976 |
38,777 |
41,806 |
|
Total Growth % |
14.9% |
12.9% |
7.7% |
7.8% |
7.8% |
7.8% |
|
|
VMware Revenue |
16,148 |
19,116 |
23,186 |
28,372 |
|||
|
VMware Revenue Synergies |
559 |
559 |
559 |
||||
|
Total Revenue (Post-Acquisition) |
23,888 |
27,450 |
30,991 |
50,094 |
55,651 |
62,522 |
70,178 |
|
Growth % |
14.9% |
12.9% |
61.6% |
11.1% |
12.3% |
12.2% |
Source: Broadcom, VMware, Khaveen Investments
All in all, we believe the acquisition of VMware as the market leader in virtualization software with a 72% market share in 2021 could provide opportunities for Broadcom to create revenue synergies by leveraging its common target customer base of enterprise customers. Additionally, as VMware’s presence among the Fortune 500 firms is 99% and higher than Broadcom (80%), we believe this could provide revenue synergy creation and forecasted its revenue synergies to be $1.9bln across 3 years. In FY2023, we expect VMware’s revenue to account for 32.2% of its total revenues and represent 85% of its revenue increase for the year. Beyond that, we expect through the shift towards subscriptions, its revenue growth to accelerate at an average growth rate of 17% in 2 years post-acquisition.
Integration with VMware
As highlighted from our previous analysis, we
believe another key opportunity for Broadcom is to integrate its acquired companies selling & admin operations with its sales force and provide an opportunity to leverage Broadcom’s existing relationships with key enterprise clients.
This is as its SG&A as a % of revenue declined while its R&D expenses increase as it shifted its focus on R&D. Moreover, we compared Broadcom’s Infrastructure Software segment operating margin in the table below. We adjusted its Infrastructure Software segment margin with its unallocated expenses of $1.9 bln which we prorated based on its segment revenue breakdown.
|
Margins |
Operating Margins % |
|
CA Technologies (pre-acquisition) |
28.12% |
|
Brocade (pre-acquisition) |
13.09% |
|
Symantec Enterprise Security (pre-acquisition) |
18.52% |
|
Broadcom Adjusted Software Segment (current) |
42.91% |
Source: Broadcom, CA, Brocade, Symantec, Khaveen Investments
From the table above, Broadcom’s adjusted software margins (42.91%) were higher than CA Technologies (28.12%), Brocade (13.09%) and Symantec’s Enterprise Security (18.52%) margins pre-acquisition. Additionally, in the table below, Broadcom’s adjusted software segment margins had also consistently increased in the past 3 years from 28.2% in 2019 to 42.9% in 2021.
|
Broadcom |
2019 |
2020 |
2021 |
|
Infrastructure Software Revenue ($ mln) |
5,156 |
6,621 |
7,067 |
|
Infrastructure Software Adjusted Margin |
28.2% |
28.5% |
42.9% |
Source: Broadcom, Khaveen Investments
To compare the margins and expense breakdown between VMware and Broadcom’s software segment, we examined its SG&A and R&D expenses as a % of revenue after adjusting for Broadcom’s unallocated expenses in the table below.
|
Expenses |
VMware |
Broadcom Infrastructure Software |
|
SG&A Expenses as % of revenue |
39.5% |
17.6% |
|
R&D Expenses as % of revenue |
23.8% |
29.0% |
|
Operating Margins |
19.1% |
42.9% |
Source: Broadcom, VMware, Khaveen Investments
Based on VMware’s operating expense breakdown, its SG&A expenses were the largest expense at 39.5% of revenue followed by R&D at 23.8% of revenue. In contrast, Broadcom has a lower SG&A but higher R&D spending for its software segment and had a higher operating margin of 42.9% compared to VMware at only 19.1%.
From its earnings briefing, Broadcom’s management highlighted its opportunity to derive synergies to reduce its SG&A through the integration of its direct sales force with VMware.
And so we have a direct sales force, and we’re going to leverage the fact that we have common coverage in both of those areas and take advantage of getting synergies there. – Tom Krause, CFO
Additionally, the company also highlighted potential employee layoffs as it mentioned to “eliminate duplicative administrative functions” across “IT, finance, legal, human resources and facilities”.
However, a difference in this acquisition compared to its past acquisitions is that the company had also indicated that it intends to retain VMware’s channel distribution model. Based on its annual report, VMware has a channel partner network including system integrators and resellers.
And we think from learning about how we and Symantec, and frankly some of the revenues that we gave up, we think we can actually go back and reinvest in the channel and continue to drive revenue growth profitably. We don’t want to walk away from the channel. We actually want to embrace it, – Tom Krause, CFO
According to the company, it expects the acquisition to generate $8.5 bln in EBITDA within 3 years following the deal closing. Based on its target, we calculated the expected operating margin in 2025 assuming the deal closes in 2023 and depreciation of $593 mln to derive its EBIT target of $7,907 mln which we estimate to be an operating margin of 33.2% based on our revenue forecast in 2025 from the previous point.
|
VMware ($ mln) |
2021 |
2025F |
|
Revenue (‘a’) |
12,851 |
23,186 |
|
EBIT (‘b’) |
2,451 |
7,907 |
|
Operating Margin (‘c’) |
19.1% |
34.1% |
|
Depreciation (‘d’) |
593 |
593 |
|
EBITDA (‘e’) |
3,044 |
8,500 |
*b = e – d
c = b/a
Source: Broadcom, VMware, Khaveen Investments
Based on the company’s operating margins by segments, we forecasted the total operating margins for Broadcom post-acquisition.
|
Broadcom Operating Margin ($ mln) |
2019 |
2020 |
2021 |
2022F |
2023F |
2024F |
2025F |
2026F |
|
Semiconductor Solutions Revenue |
17,441 |
17,267 |
20,383 |
22,043 |
23,839 |
25,780 |
27,880 |
30,151 |
|
Semiconductor Solutions Operating Margins |
11.4% |
12.3% |
26.9% |
26.9% |
26.9% |
26.9% |
26.9% |
26.9% |
|
Infrastructure Software Revenue |
5,156 |
6,621 |
7,067 |
8,948 |
9,548 |
10,196 |
10,897 |
11,655 |
|
Infrastructure Software Operating Margins |
28.2% |
28.5% |
42.9% |
42.9% |
42.9% |
42.9% |
42.9% |
42.9% |
|
VMware Revenue |
16,148 |
19,116 |
23,186 |
28,372 |
||||
|
VMware Operating Margins |
19.1% |
24.1% |
29.1% |
34.1% |
34.1% |
|||
|
Total Operating Income |
3,444 |
4,014 |
8,519 |
9,773 |
14,402 |
16,876 |
20,087 |
22,793 |
|
Total Operating Margins |
16.8% |
31.0% |
31.5% |
28.8% |
30.3% |
32.1% |
32.5% |
Source: Broadcom, VMware, Khaveen Investments
Overall, we expect Broadcom to integrate its direct sales force with VMware and indicated potential layoffs across multiple business functions. However, unlike prior acquisitions, the company indicated its intention to leverage VMware’s channel partner network. Thus, we forecasted VMware’s operating margins to reach 34.1% by 2025 based on its guided EBITDA target of $8.5 bln within 3 years post-acquisition completion. However, its margins are lower in comparison to Broadcom’s adjusted software margins at 42.9% and we expect it to weigh down on its overall operating margins to 28.8% in 2023 but gradually improve with the increase of VMware’s margins. Despite the lower margins, we still expect the company’s total operating income to continue growing driven by the higher revenue growth of VMware.
Financial Impact
Based on the deal, Broadcom will pay VMware shareholders either $142.50 in cash or 0.2520 shares of Broadcom for each VMware share subjected to proration resulting in 50% of VMware shares exchanged for cash and half for Broadcom stock. Based on our calculations, we derived a total consideration of $59bln compared to its approximation of $61 bln from the announcement.
|
VMware Deal |
Consideration Per Share |
Total Consideration ($ mln) |
Proration (50%) ($ mln) |
|
Cash |
142.5 |
60,056 |
30,028 |
|
Broadcom Stock |
138.2 |
58,256 |
29,128 |
|
Total Consideration |
59,156 |
Source: Broadcom, VMware, Khaveen Investments
After calculating the estimated acquisition cost, we factored this impact into our projection of Broadcom’s cash flows in FY2023. Also, we accounted for the Capex of VMware in our projections based on its 10-year average Capex as a % of revenue (3.7%).
|
Capex Projections ($ mln) |
2022F |
2023F |
2024F |
2025F |
2026F |
|
Broadcom Revenue |
30,991 |
33,386 |
35,976 |
38,777 |
41,806 |
|
Broadcom Capex |
4,080 |
4,149 |
4,225 |
4,307 |
4,395 |
|
VMware Revenue |
16,707 |
19,675 |
23,745 |
28,372 |
|
|
VMware Capex |
626 |
737 |
890 |
1,063 |
|
|
Acquisition Costs |
30,028 |
||||
|
Total Revenue |
30,991 |
50,094 |
55,651 |
62,522 |
70,178 |
|
Total Capex |
4,080 |
34,804 |
4,962 |
5,196 |
5,458 |
|
Capex as % of Revenue |
13% |
69% |
9% |
8% |
8% |
Source: Broadcom, VMware, Khaveen Investments
Broadcom, VMware, Khaveen Investments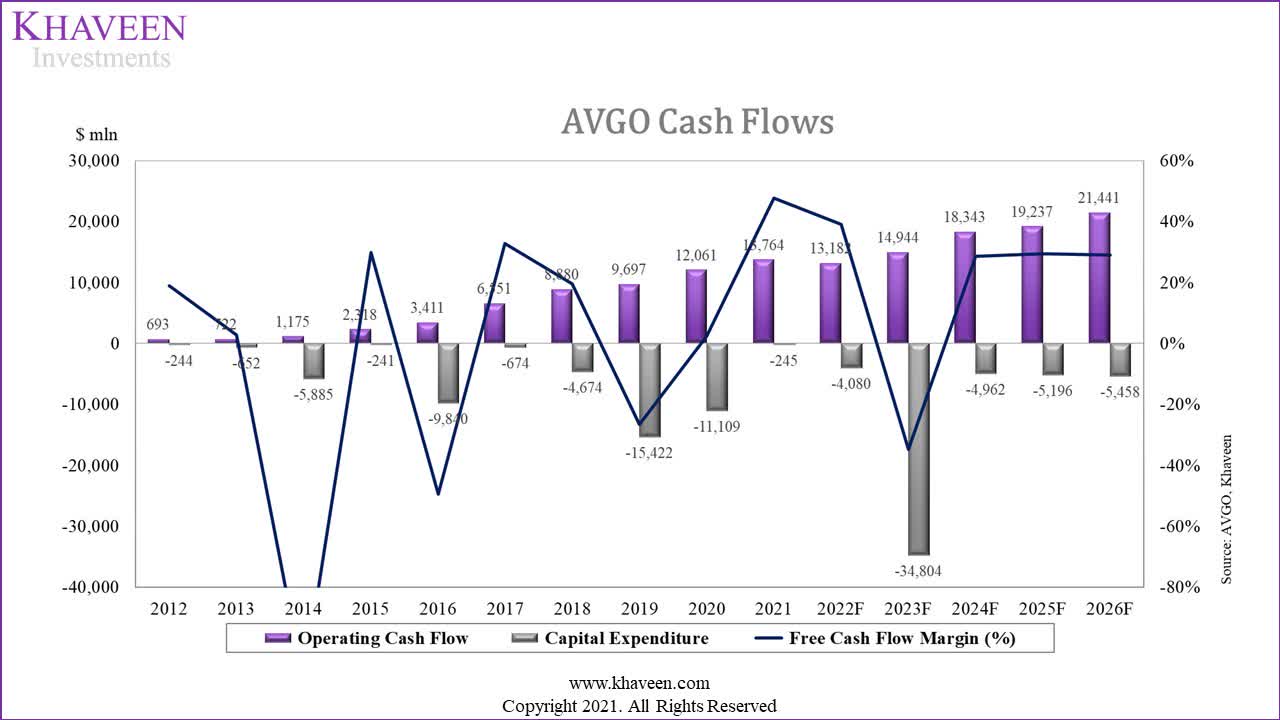
Based on our cash flow forecast in the chart above, the acquisition cost is expected to weigh on its FCF margins at -34.7% in 2023. Beyond that, we forecasted its average FCF margin of 29%. Additionally, Broadcom obtained commitments from a consortium of banks for $32 bln in debt financing. Additionally, the company will assume $8 bln of net debt from VMware according to Broadcom.
Broadcom, VMware, Khaveen Investments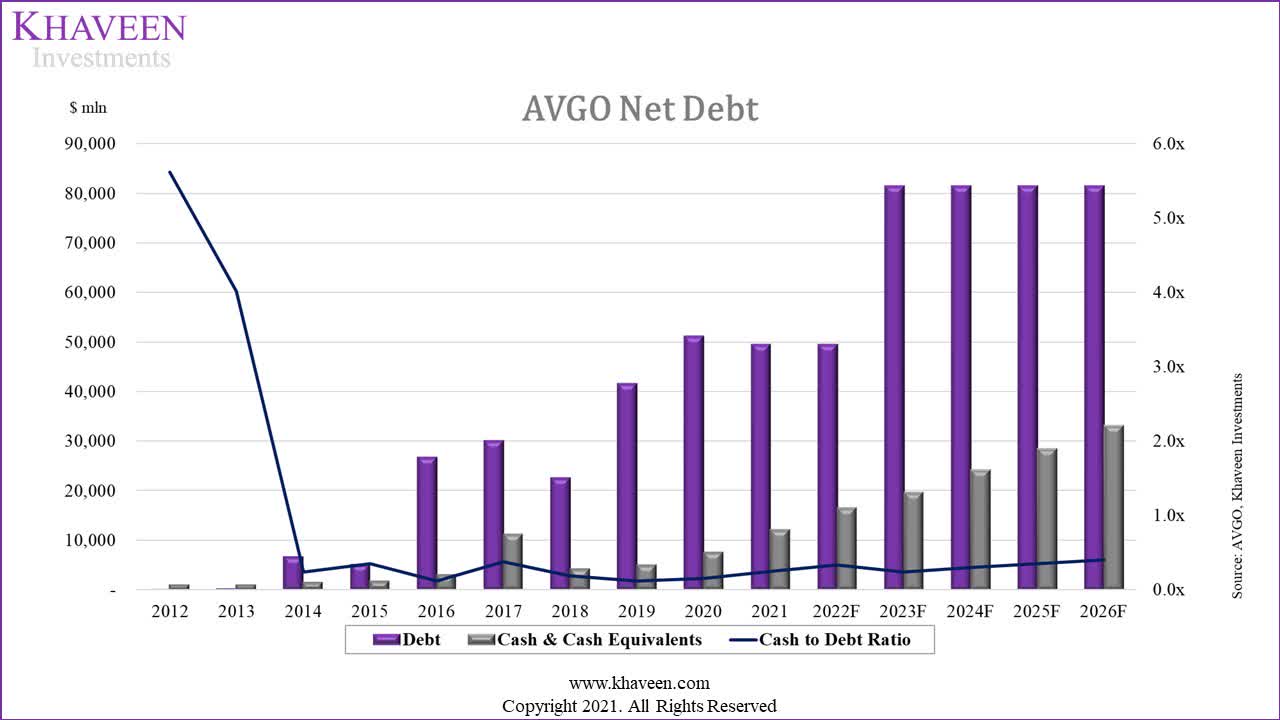
Assuming the deal is completed by FY2023 as planned, we forecasted Broadcom’s debt to increase by 64.7% in 2023 and its cash to debt ratio to be impacted from 0.33x in 2022 to 0.24x in 2023. Due to the strong FCF cash generation of Broadcom, our model shows its cash to debt ratio recovering to 0.41x by 2026.
|
Credit Analysis |
2012 |
2013 |
2014 |
2015 |
2016 |
2017 |
2018 |
2019 |
2020 |
2021 |
|
EBITDA interest coverage |
N/A |
N/A |
14.5x |
15.5x |
8.5x |
18.1x |
18.6x |
7.5x |
6.5x |
7.9x |
|
EBITDA/Net Debt |
N/A |
N/A |
0.3x |
0.8x |
0.2x |
0.4x |
0.5x |
0.3x |
0.3x |
0.4x |
Source: Broadcom, VMware, Khaveen Investments
Furthermore, in terms of credit ratio analysis, its EBITDA interest coverage had deteriorated in the past 7 years as its interest expense rose but improved in 2021 to 7.9x. Moreover, its EBITDA/Net debt had remained stagnant in the past 10 years to 0.4x in 2021. Overall, we believe this highlights its deteriorating ability to repay its debt obligations with its increased debt.
|
Pre-Acquisition |
Value ($ mln) |
Weight |
Cost |
|
Equity |
204,215 |
80.6% |
9.6% |
|
Debt |
49,152 |
19.4% |
2.1% |
|
WACC |
8.1% |
||
|
Post-Acquisition |
Value ($ mln) |
Weight |
Cost |
|
Equity |
204,215 |
71.5% |
9.6% |
|
Debt |
81,495 |
28.5% |
2.1% |
|
WACC |
7.4% |
Source: Khaveen Investments
With the expected increase in its debt, we calculated the company’s WACC pre-and post-acquisition. Based on the table, we expect its debt weight to increase from 19.4% to 28.5%. As its cost of debt (2.1%) is lower than its cost of equity (9.6%), its post-acquisition WACC shows a decline to 7.4% from 8.1%.
Overall, while we expect the deal to weigh on Broadcom’s FCF margin in FY2023 at -34.7% with an acquisition cost of $59 bln and increase its debt by 65%, however, we still believe the acquisition could provide a positive contribution to the company’s financials with a better capital structure with a lower WACC from 8.1% to 7.4% due to the increase of its debt weight to 28.5%. Furthermore, we believe that Broadcom’s cash to debt would improve to 0.41x by 2026 from 0.24x in 2023 supported by its strong cash flow generating abilities with a forecasted average FCF margin of 29% beyond 2023. All in all, we believe that the company’s financials should be able to support this acquisition.
Risk: Competitive Threats
According to Forrester Research, it highlighted that the company could be faced with challenges from other competitors such as Nutanix (NTNX), IBM Red Hat (IBM) and the major public cloud players like AWS (AMZN), Microsoft Azure (MSFT) and Google Cloud (GOOG). While VMware had dominated the virtualization software market, according to VMware’s annual report, the company highlighted that it faces the risk of new applications being developed on public cloud providers which could reduce the demand for its products and services. However, the company had also partnered with cloud providers such as Microsoft which also competes against VMware with its Hyper V software. Additionally, other cloud-based competitors include Oracle (ORCL) VM server and Enterprise Linux with Smart Virtualization by Red Hat.
Valuation
We valued the company with a DCF valuation as we expect the company to continue generating positive free cash flows post-acquisition. We based its terminal value on the chipmaker’s average EV/EBITDA of 18.44x.
SeekingAlpha, Khaveen Investments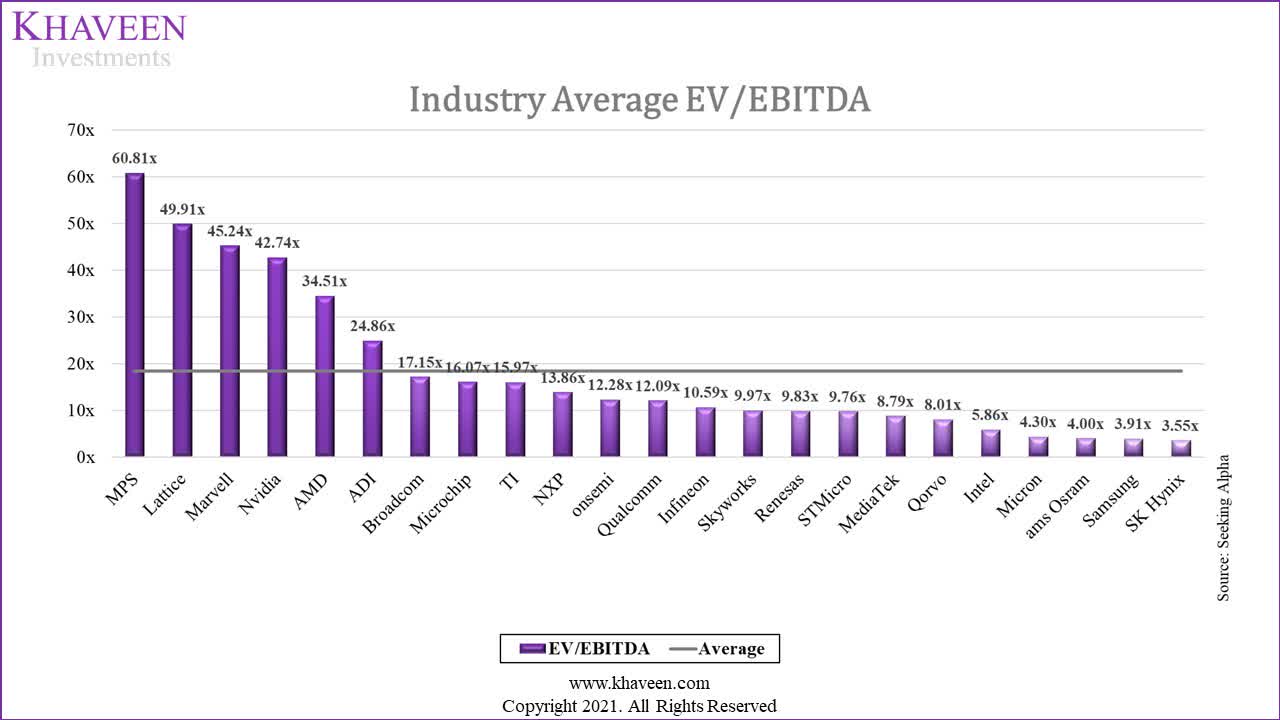
Based on a discount rate of 7.4% (company’s WACC post-acquisition) and accounting for its post-acquisition share outstanding of 615 mln, our model shows an upside of 44.5%
Khaveen Investments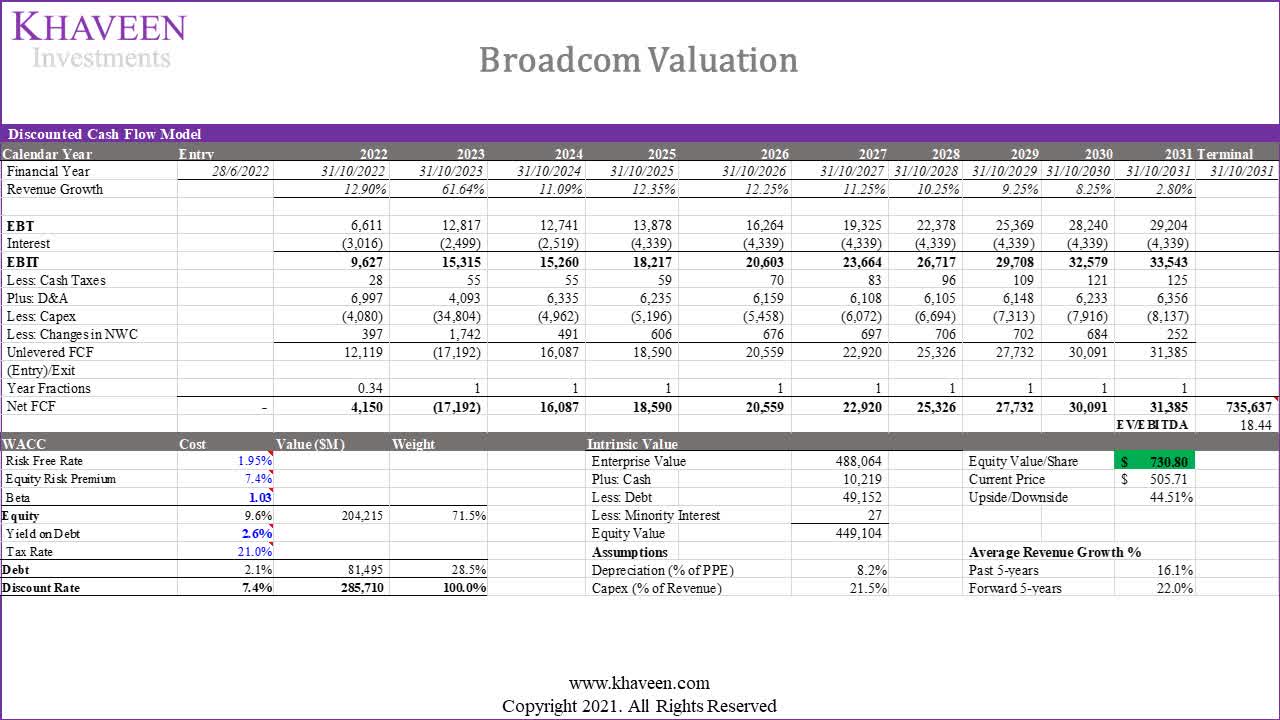
|
Equity Value ($mln) |
Pre-Acquisition |
Post-Acquisition |
|
Enterprise Value |
488,064 |
488,064 |
|
Plus: Cash |
10,219 |
19,719 |
|
Less: Debt |
49,152 |
81,495 |
|
Less: Minority Interest |
– |
– |
|
Equity Value |
449,131 |
426,288 |
|
Average FCF (5-year Forward) |
12,948 |
20,696 |
Source: Khaveen Investments
Additionally, following the acquisition, we estimated its equity value to decrease to $426 bln from $449 bln due to the increase of its debt from $49 bln to $81.5 bln despite the increase of its cash from $10 bln to $19.7 bln. Although we expect its equity value to decrease with the acquisition, however, we projected its average FCFs to increase with the acquisition with a difference of $7.7 bln in the 5 years post-acquisition.
Verdict
To conclude, we analyzed the company’s planned acquisition of VMware at a cost of around $59 bln based on a mix of cash and debt expected to be completed in FY2023. Not only is the deal expected to contribute 85% of revenue increase for the company and represent 32% of its total revenue, but we also expect the deal to create revenue synergy opportunities for the company as the market leader in virtualization software and have a common customer base of enterprise customers at an estimate of $1.9 bln. Also, we believe its shift towards a subscription model could support its revenue growth acceleration at an average of 17% from its past 5-year average of 11.6%. Moreover, we believe that through the integration of its sales force and elimination of redundancies, the VMware’s operating margins could increase to 34.1% by 2025 from 19.1%. While this is lower than Broadcom’s margins, we expect its operating income to continue growing due to VMware’s superior revenue growth.
While we expect a financial impact on the company post-acquisition with its FCF margins forecasted to decline to -34.7% and its debt to increase by 65%, we believe that the acquisition is still positive as we expect its capital structure to improve with a reduced WACC to 7.4% from 8.1%. Additionally, despite the increase in its debt, its debt weight would increase to only 28.5% from 19.4% previously. Moreover, we forecasted its cash-to-debt ratio to improve to 0.41x by 2026 supported by its strong cash-generating abilities with a forecasted average FCF margin of 29% through 2026.
Most importantly, compared to our previous analysis, our forecasted revenue growth accounting for the acquisition has increased to a 5-year forward of 22% compared to 8.8% in our previous analysis. Overall, we rate the company as a Strong Buy with a target price of $730.80.
Be the first to comment