

GBP/USD – Prices, Charts, and Analysis
The UK remains in a mess with record energy prices, double-digit inflation, stuttering growth, continued strike action, and a complete lack of leadership from No.10 leaving the country rudderless. One investment bank’s recent note suggested that UK inflation could hit 18% early next year, prompting a round of sensationalist headlines. While this may happen, a new PM will be decided on September 5th, and inflation and energy costs, will be on top of their agenda. Against this dire backdrop, and with the US dollar resuming its run higher, it is no wonder that cable remains weak and under considerable downside pressure.
British Pound (GBP/USD) Slumps, UK Consumer’s Mood Darkens
After printing a fresh two-and-a-half-year low on Tuesday (1.1718), cable pushed higher in the afternoon session yesterday after the latest US PMI readings missed expectations by a margin. Coming up today is the latest look at US durable goods orders for July at 13:30 UK.
For all market-moving economic data and events, refer to the DailyFX calendar
With the US dollar currently dominating most USD pairs, traders should be aware of events and releases in the US going towards the weekend. On Thursday, the 2nd look at US Q2 GDP which is expected to show a 0.8% contraction in GDP, for the second quarter in a row, while on Friday there is the latest look at US Core PCE, while 90 minutes later the event of the week, Fed chair Jerome Powell’s speech at the Jackson Hole Symposium. The markets have already priced in a hawkish speech by chair Powell who is expected to reiterate that the central bank will continue to take whatever measures are needed to stamp down on red-hot inflation. Any deviation from this stance, either uber-hawkish or dovish, will spark a bout of volatility going into the weekend.
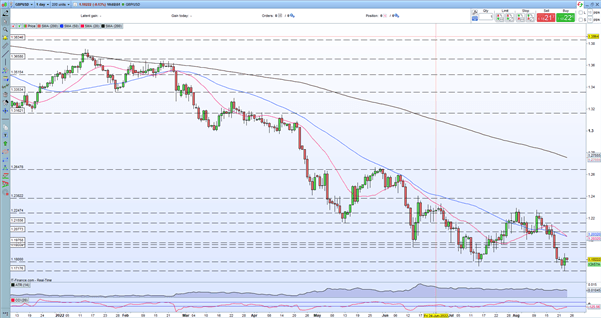
The daily GBP/USD chart shows the current weak state of the pair. The recent set of highs between 1.2245 and 1.2295 will prove to be very difficult to overcome in the medium- to long-term, while in the short-term the cluster of prior low prints on either side of 1.1950 will keep bulls at bay. One positive on the chart is Tuesday’s bullish engulfing candle which normally suggests a trend reversal and a move higher. If this isn’t the case, the next technical level of support for cable is the March 2020 low at 1.1412.
GBP/USD Daily Price Chart – August 24, 2022
Retail trader data show 79.78% of traders are net-long with the ratio of traders long to short at 3.95 to 1. The number of traders net-long is 7.47% lower than yesterday and 23.28% higher from last week, while the number of traders net-short is 3.20% higher than yesterday and 26.97% lower from last week.
We typically take a contrarian view to crowd sentiment, and the fact traders are net-long suggests GBP/USD prices may continue to fall. Positioning is less net-long than yesterday but more net-long from last week. The combination of current sentiment and recent changes gives us a further mixed GBP/USD trading bias.
What is your view on the British Pound – bullish or bearish?? You can let us know via the form at the end of this piece or you can contact the author via Twitter @nickcawley1.
Be the first to comment