

Sterling Technical Price Outlook: GBP/USD Trade Levels
- Sterling technical trade level update – Daily & Intraday Charts
- GBP/USD testing near-term uptrend support after BoE emergency rate cut
- British Pound short-side vulnerable into monthly open support / 1.2821
The British Pound is the worst performing major currency against the US Dollar today after the Bank of England announced an emergency interest rate cut of 50bps in response to the growing Coronavirus threat. The move comes on the heels of 2.5% decline off the monthly highs in Sterling and takes price into a key near-term support zone- looking for a reaction down here. These are the updated targets and invalidation levels that matter on the GBP/USD price charts. Review my latest Weekly Strategy Webinar for an in-depth breakdown of this Cable trade setup and more.
Starts in:
Live now:
Mar 16
( 12:03 GMT )
Live Weekly Strategy Webinars on Mondays at 12:30GMT
Weekly Scalping Webinar
Sterling Price Chart – GBP/USD Daily

Chart Prepared by Michael Boutros, Technical Strategist; GBP/USD on Tradingview
Technical Outlook: In my latest Sterling Price Outlook we noted that British Pound recovery was, “approaching multi-week downtrend resistance just higher and we’re looking for a reaction on a stretch towards the upper parallel for guidance.” A breakout last week fueled a rally into former slope support (red) before faltering at a critical resistance zone define by the February open / 61.8% retracement of the December decline at 1.3199-1.3213.
The pullback approached the March open today at 1.2821 and the focus is on a reaction into this zone – a break lower would once again expose key support at the 2019 yearly open / November low at 1.2754/69. Daily resistance stands at 1.3058 with a breach above the December trendline needed to shift the Sterling focus back to the long-side.
Sterling Price Chart – GBP/USD 120min

Notes: A closer look at Sterling price action shows GBP/USD trading within the confines of the ascending pitchfork formation we’ve been tracking off the February lows. The sell-off is now testing the lower parallel with a break / close below the 78.6% retracement / monthly open support at 1.2821/26 would be needed to invalidate the recent breakout. Such a scenario would expose subsequent support objectives at 1.2753 backed by the 100% extension of the December decline at 1.2674. Initial resistance stands at 1.2968 backed by 1.3013 – key near-term resistance / bearish invalidation at Friday’s close / 61.38% retracement at 1.3044/57– look for a larger reaction in price there IF reached.

Recommended by Michael Boutros
Download our latest quarterly GBP/USD Price Forecast
Bottom line: The Sterling breakdown is confluence support and we’re looking for a reaction just lower for guidance. From a trading standpoint, look to reduce short-exposure / lower protective stops on a test of monthly open support. IF price can hold this slope, look for a breach above the objective weekly open to mark resumption of the early month breakout. On the lookout for possible downside exhaustion here but use caution here, a break lower could see accelerated losses for the British Pound. Review my latest British Pound Weekly Price Outlook for a closer look at the longer-term GBP/USD technical trade levels.
For a complete breakdown of Michael’s trading strategy, review his Foundations of Technical Analysis series on Building a Trading Strategy
Sterling Trader Sentiment – GBP/USD Price Chart
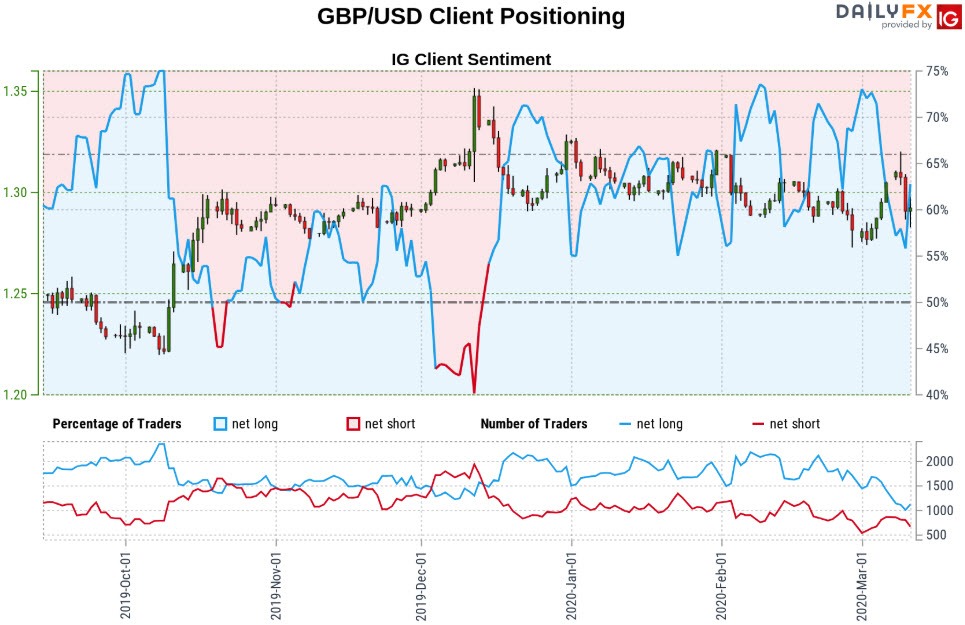
- A summary of IG Client Sentiment shows traders are net-long GBP/USD – the ratio stands at +1.61 (61.72% of traders are long) – bearish reading
- Long positions are17.61% higher than yesterday and 30.08% lower from last week
- Short positions are22.60% lower than yesterday and 2.85% lower from last week
- We typically take a contrarian view to crowd sentiment, and the fact traders are net-long suggests GBP/USD prices may continue to fall. Yet traders are more net-long than yesterday but less net-long from last week and the combination of current positioning and recent changes gives us a further mixed GBP/USD trading bias from a sentiment standpoint.
| Change in | Longs | Shorts | OI |
| Daily | 7% | 1% | 5% |
| Weekly | -30% | 1% | -20% |
—
Key UK / US Data Releases

Economic Calendar – latest economic developments and upcoming event risk.
Active Trade Setups
– Written by Michael Boutros, Currency Strategist with DailyFX
Follow Michael on Twitter @MBForex
Be the first to comment