

AndreyKrav/iStock via Getty Images
Earnings of Bridgewater Bancshares, Inc. (NASDAQ:BWB) will most probably continue to surge this year on the back of robust balance sheet growth. The company’s loan portfolio has grown at a phenomenal rate since its IPO, and the growth momentum is likely to continue through the middle of 2022. However, headwinds are likely to slow down loan growth in the last quarter of the year. Meanwhile, the net interest margin is likely to somewhat benefit from a rising interest-rate environment. Overall, I’m expecting Bridgewater Bancshares to report earnings of $1.70 per share for 2022, up 11% year-over-year. The year-end target price suggests a high upside from the current market price. Therefore, I’m adopting a buy rating on Bridgewater Bancshares.
Several Catalysts for Loan Growth Ahead
Bridgewater Bancshares reported remarkable loan growth of 6% in the first quarter of 2022. Loan growth has been phenomenal since the IPO of the company in 2018. The loan portfolio has in fact grown at a compounded annual growth rate of 20% from 2017 to 2021.
For full-year 2022, loan growth is likely to be in at least the mid-teen percentage range thanks to the following catalysts.
- The recent expansion of lending teams. As mentioned in the earnings presentation, merger and acquisition-related disruption in Bridgewater’s markets has resulted in client and banker acquisition opportunities. The company has recently hired some lenders and intends to continue to hire in the near future.
- New loan origination system. Bridgewater Bancshares launched a new commercial loan origination system in March 2022, as mentioned in the latest investor presentation. The impact of this digital platform will be visible in the coming quarters.
- Strength in the regional economy. Bridgewater Bancshares operates in Minnesota, which currently has a strong job market. The state had an unemployment rate of only 2.0% in May 2022, which is one of the lowest unemployment rates in the country.
- M&A activity. Management mentioned in the earnings presentation that some M&A discussions with potential targets are ongoing. However, the company is yet to announce any merger agreement so far this year.
- Robust loan pipeline. Management mentioned in the earnings presentation that its loan pipeline was quite strong and diversified among various asset classes at the end of March 2022.
Due to the above factors, loan growth will most probably remain strong in the next two quarters. However, loan growth will most probably slow down by the end of the year due to the rising rate environment. The Federal Reserve projects the fed funds rate to almost double from the current level of 1.75% to around 3.50% later this year. Further, the fed funds rate is likely to start declining late next year. Therefore, it’s reasonable to expect borrowers to either pre-empt the rate hike and borrow now or wait for rates to fall again next year before borrowing. It would not be wise to borrow at the apparent peak of the rate cycle later this year unless it was absolutely necessary.
Management mentioned in the earnings presentation that it expects annualized loan growth (ex-Paycheck Protection Program loans) to be in the mid-to-high teen-percentage range for 2022. Given my expectation of a slowdown in loan growth later this year, I’m anticipating the loan growth to be at the lower end of management’s guidance. I’m expecting the loan portfolio to increase by 15.9% by the end of December 2022 from the end of 2021. Meanwhile, I’m expecting deposits to grow mostly in line with loans for the remainder of the year. The following table shows my balance sheet estimates.
| FY18 | FY19 | FY20 | FY21 | FY22E | |
| Financial Position | |||||
| Net Loans | 1,640 | 1,884 | 2,282 | 2,770 | 3,210 |
| Growth of Net Loans | 23.7% | 14.9% | 21.1% | 21.4% | 15.9% |
| Other Earning Assets | 257 | 293 | 393 | 441 | 488 |
| Deposits | 1,561 | 1,823 | 2,502 | 2,946 | 3,317 |
| Borrowings and Sub-Debt | 182 | 174 | 142 | 135 | 168 |
| Common equity | 221 | 245 | 265 | 313 | 351 |
| Book Value Per Share ($) | 7.5 | 8.2 | 9.1 | 10.8 | 12.1 |
| Tangible BVPS ($) | 7.4 | 8.0 | 9.0 | 10.7 | 11.9 |
|
Source: SEC Filings, Author’s Estimates (In USD million unless otherwise specified) |
Margin is Barely Sensitive to Interest Rate Hikes
Due to the loan portfolio’s concentration in real estate loans, the portfolio is largely fixed rate based. Moreover, the loan portfolio is most sensitive to changes in the five-to-ten-year portion of the yield curve, as mentioned in the earnings presentation. This suggests that only a small part of the loan portfolio will re-price this year.
1Q 2022 Earnings Presentation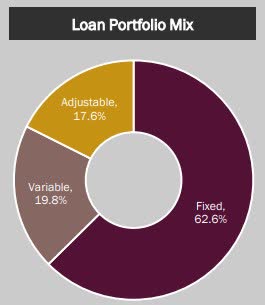
To top it off, the deposit book is quite rate-sensitive. Only 27.5% of the deposit book is non-interest bearing and therefore will not re-price after rate hikes. Due to the combination of the loan and deposit mixes, the net interest income is barely sensitive to interest rate changes. Management’s interest-rate sensitivity analysis given in the 10-Q filing shows that a 200 basis points rise in interest rates could boost the net interest income by only 2.12% over twelve months.
However, the margin will receive some benefit from the upcoming time deposit maturity. As mentioned in the earnings presentation, $123 million of time deposits will mature over the next five quarters at a blended cost of 1.47%. Currently, the average certificate of deposit cost in the country is just 0.48%, according to FDIC. Therefore, I believe it’s safe to assume that Bridgewater Bancshares can replace the outgoing time deposits with new deposits carrying rates that are at least 50 to 75 basis points lower. Such replacement can reduce the average deposit cost by around two to three basis points, according to my calculations.
Considering these factors, I’m expecting the margin to increase by ten basis points in the last nine months of 2022 from 3.60% in the first quarter of the year.
Provision Normalization on the Cards
The sharp rise in interest rates this year is likely to take a toll on borrowers’ ability to service their debt. However, I’m not too concerned about the upcoming deterioration of the asset quality because the allowance level is currently quite high relative to the portfolio’s credit risk. Allowances made up 1.4% of total loans at the end of March 2022. In comparison, non-performing assets were just 0.02% of total assets at the end of March 2022, as mentioned in the earnings presentation.
Overall, I’m expecting the provision expense to remain at a normal level this year. I’m expecting the net provision expense to make up 0.24% of total loans in 2022. In comparison, the provision expense averaged 0.23% of total loans from 2017 to 2019.
Expecting Earnings to Grow by 11% Year-Over-Year
The anticipated loan growth will likely be the chief driver of earnings this year. Further, the slight margin expansion will likely lift the bottom line. On the other hand, provision normalization will restrict earnings growth on a year-over-year basis. Overall, I’m expecting Bridgewater Bancshares to report earnings of $1.70 per share for 2022, up 11% year-over-year. The following table shows my income statement estimates.
| FY18 | FY19 | FY20 | FY21 | FY22E | |||||
| Income Statement | |||||||||
| Net interest income | 65 | 74 | 88 | 110 | 130 | ||||
| Provision for loan losses | 4 | 3 | 13 | 5 | 8 | ||||
| Non-interest income | 3 | 4 | 6 | 5 | 6 | ||||
| Non-interest expense | 32 | 37 | 45 | 48 | 58 | ||||
| Net income – Common Sh. | 27 | 31 | 27 | 45 | 50 | ||||
| EPS – Diluted ($) | 0.91 | 1.05 | 0.93 | 1.54 | 1.70 | ||||
|
Source: SEC Filings, Earnings Releases, Author’s Estimates (In USD million unless otherwise specified) |
|||||||||
Actual earnings may differ materially from estimates because of the risks and uncertainties related to inflation, and consequently the timing and magnitude of interest rate hikes. Further, the threat of a recession can increase the provisioning for expected loan losses beyond my expectation.
High Price Upside Justifies a Buy Rating
I’m using the historical price-to-tangible book (“P/TB”) and price-to-earnings (“P/E”) multiples to value Bridgewater Bancshares. The stock has traded at an average P/TB ratio of 1.46 in the past, as shown below.
| FY18 | FY19 | FY20 | FY21 | Average | |
| T. Book Value per Share ($) | 7.4 | 8.0 | 9.0 | 10.7 | |
| Average Market Price ($) | 12.5 | 11.5 | 10.7 | 16.4 | |
| Historical P/TB | 1.69x | 1.43x | 1.20x | 1.54x | 1.46x |
| Source: Company Financials, Yahoo Finance, Author’s Estimates | |||||
Multiplying the average P/TB multiple with the forecast tangible book value per share of $11.9 gives a target price of $17.50 for the end of 2022. This price target implies a 9.5% upside from the June 30 closing price. The following table shows the sensitivity of the target price to the P/TB ratio.
| P/TB Multiple | 1.26x | 1.36x | 1.46x | 1.56x | 1.66x |
| TBVPS – Dec 2022 ($) | 11.9 | 11.9 | 11.9 | 11.9 | 11.9 |
| Target Price ($) | 15.1 | 16.3 | 17.5 | 18.7 | 19.9 |
| Market Price ($) | 16.0 | 16.0 | 16.0 | 16.0 | 16.0 |
| Upside/(Downside) | (5.4)% | 2.1% | 9.5% | 17.0% | 24.5% |
| Source: Author’s Estimates |
The stock has traded at an average P/E ratio of around 11.7x in the past, as shown below.
| FY18 | FY19 | FY20 | FY21 | Average | |
| Earnings per Share ($) | 0.91 | 1.05 | 0.93 | 1.54 | |
| Average Market Price ($) | 12.5 | 11.5 | 10.7 | 16.4 | |
| Historical P/E | 13.7x | 11.0x | 11.5x | 10.7x | 11.7x |
| Source: Company Financials, Yahoo Finance, Author’s Estimates | |||||
Multiplying the average P/E multiple with the forecast earnings per share of $1.70 gives a target price of $20.00 for the end of 2022. This price target implies a 25.1% upside from the June 30 closing price. The following table shows the sensitivity of the target price to the P/E ratio.
| P/E Multiple | 9.7x | 10.7x | 11.7x | 12.7x | 13.7x |
| EPS 2022 ($) | 1.70 | 1.70 | 1.70 | 1.70 | 1.70 |
| Target Price ($) | 16.6 | 18.3 | 20.0 | 21.7 | 23.4 |
| Market Price ($) | 16.0 | 16.0 | 16.0 | 16.0 | 16.0 |
| Upside/(Downside) | 3.7% | 14.4% | 25.1% | 35.7% | 46.4% |
| Source: Author’s Estimates |
Equally weighting the target prices from the two valuation methods gives a combined target price of $18.70, which implies a sizable 17.3% upside from the current market price. As a result, I’m adopting a buy rating on Bridgewater Bancshares.
Be the first to comment