

Taiyou Nomachi/DigitalVision via Getty Images
Intro
Boise Cascade (NYSE:BCC) is a stock that has seen revenue and cash flow soar amid unprecedented pricing ability over the last two years associated with lumber-related products. As supply chain snarls work themselves out and commodity prices normalize in upcoming years, however, the stock’s earnings are vulnerable to a sizeable hit. Even with this being the case, I believe the market is unfairly valuing a company that will still generate impressive cash flows despite downside pressure from current levels being unavoidable, creating an opportunity for investors to get in on a stock after a recent drop in its price.
My method of analysis rests in looking at the past two earnings calls of companies and seeing what changed vs. what stayed the same. I’ll then talk about what those similarities and differences mean for the stock going forward as well as how it plays into my valuation of the company through a DCF/3-Statement Model. First, some quick earnings numbers:
Company Financials Company Earnings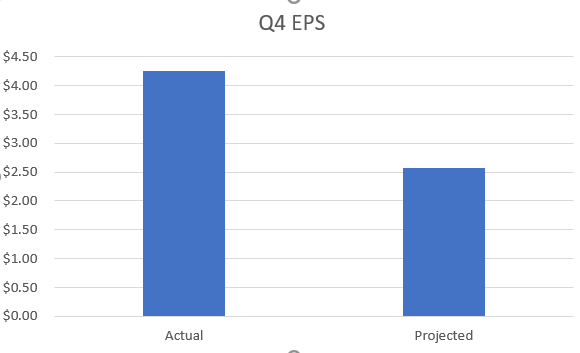
What Stayed the Same from Q3 to Q4
Significantly Higher Selling Prices Compared to 2020
The company’s ability to effectively raise prices was a noticeable strength in each of the two earnings calls, especially in their Building Materials Distribution segment (BMD). Compared to Q3 ’20, Q3 ’21 BMD average selling prices were up 23%, helping offset a 3% volume loss compared to the same period and ultimately driving $300 million of revenue growth for the business unit. The ’21 Q4 earnings call revealed a similar trend with BMD selling prices coming in at 19% higher than Q4 ’20, again being the driver of ~$300 million of top-line growth quarter over quarter.
We’ve been able to see a lot of building material companies pass along these sort of price increases. The ability is incredibly important as most are seeing unprecedented rises in commodity prices, especially wood-related products. Here’s a snippet from BCC’s most recent 10-K demonstrating just how substantial raw material costs have been. With wood fiber costs making up about 45% of COGS, the overall lumber market is something prospective investors need to take into account.
Company 10-K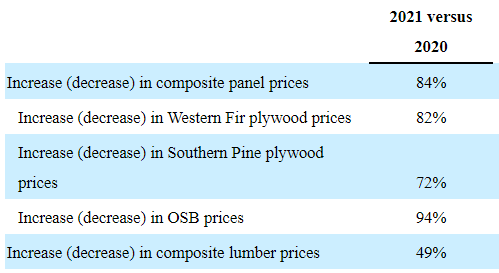
Being able to pass along costs to customers is certainly a valuable tool in this market, but something that tends to be overlooked is the impact of any sort of mean reversion of pricing or the volume side of the revenue equation. Although the company said to expect mid-single-digit price increases in Q1 ’22 and beyond, I’ll direct more of my attention to the volume side of things. Throughout all of 2021, BMD segment volumes were up a measly 3% relative to 2020, while pricing was up a whopping 42%. As commodities find their footing in the future and this pricing power dissipates, I want the company’s management to speak more to their plans of improving volume. As it stands right now, there seems to be a little bit of hesitation on this front amid concerns on how long it would take to complete a greenfield site expansion.
Little to No Margin Guidance
Especially to someone who utilizes financial models to estimate a company’s value, lack of margin guidance can be frustrating. It’s understandable how recent volatility can deter management from revealing their 2022 planned profit margins, but even a nearer term outlook would prove useful. The closest thing I could find to any sort of margin guidance came from the Q3 call, as an analyst probed enough where the speaker finally said a 13% gross margin for the BMD segment was a good goal for Boise Cascade going into the fourth quarter. Well, with Q4 finally wrapped up, gross margin for the BMD segment came in at 16.2%, a large beat of 320 basis points from what they guided in the Q3 call. It’s no wonder Q4 EPS came in at ~70% better than consensus estimates- analysts firstly have little to no info to go off of, and second, the little info that is provided is largely inaccurate.
One could make the argument that this volatility is the exact reason Boise Cascade doesn’t provide a forecasted margin profile, but the pessimist in me believes that they simply need to do a better job forecasting or not sandbag as much in their estimates- especially if they’re asked to project ahead for a single quarter. This instability led to a large earnings beat in Q4, but I worry that the company won’t give enough info or guidance to investors before a large negative margin impact event occurs. Nonetheless, margin improvement was a good thing for the company in Q4 and hopefully we start seeing some more accurate estimates as commodity markets calm down (hopefully soon).
What Changed from Q3 to Q4
Plywood Pricing
Plywood and many other wood-related products have experienced some of their most volatile times in the last 2 years. In the Q3 call, the company spoke of historic declines in commodity pricing, which contributed to the BMD segment only generating $16.6 million in income on about $1.7 billion in sales. A big driver of that was plywood pricing, which dropped as much as 36% sequentially for the company. Below we see how drastically the PPI for plywood and other engineered wood products dropped in a short 3-month time frame, according to the Federal Reserve.
Federal Reserve Database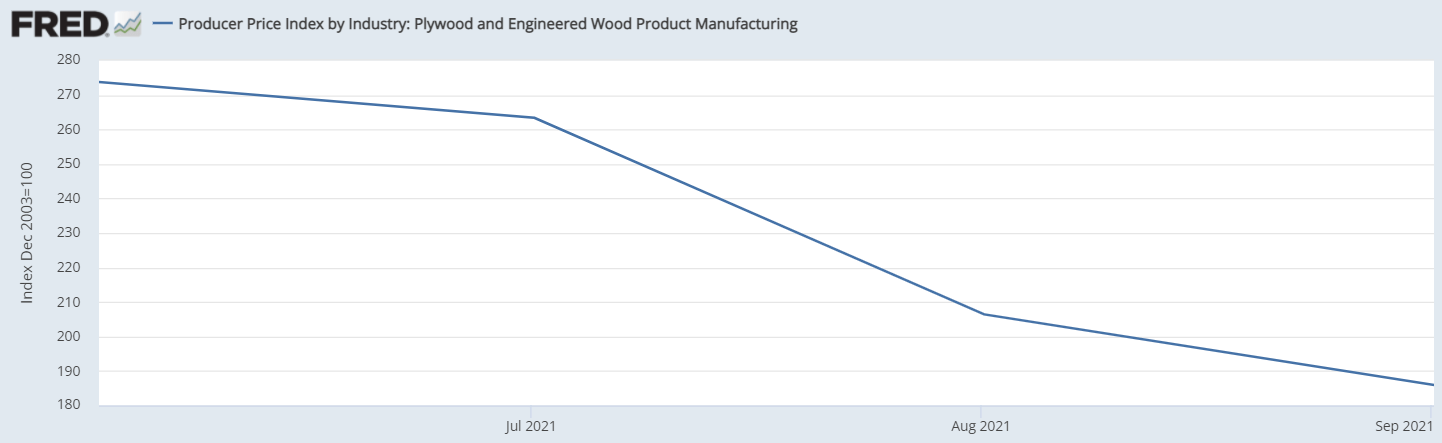
It’s now evident why margins were so razor-thin at the end of this period, buoyed by the fact that the company was in process of getting high-priced inventory off the books in July and August. As BCC finished out the year, there was some stabilization in plywood prices and even a slight increase. Profits returned to normal levels as gross margins sequentially improved by nearly 900 basis points in the BMD segment to 16.2%. Here’s a quick snapshot of the PPI for Q4 plywood pricing:
Federal Reserve Database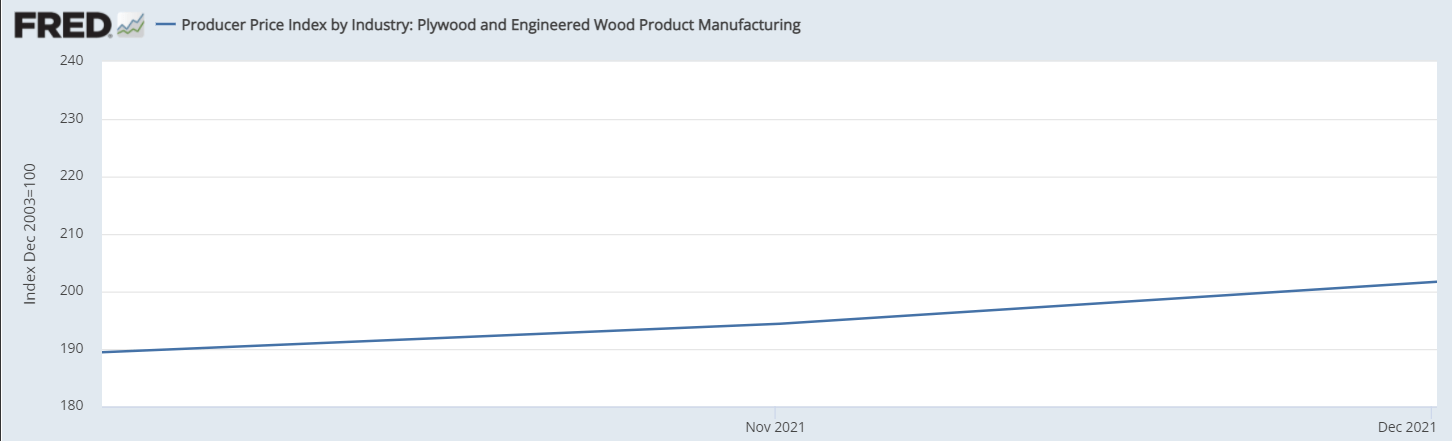
Another thing the company left us with was that thus far in 2022, plywood prices have risen sharply, with average net selling prices already being 60% higher than the average selling price in Q4 ’21. This significant rise is illustrated below, along with where prices stand now after several months of notable volatility. Even though prices are so much higher than Q4 2021, they are well below levels seen in the first half of 2021.
Federal Reserve Database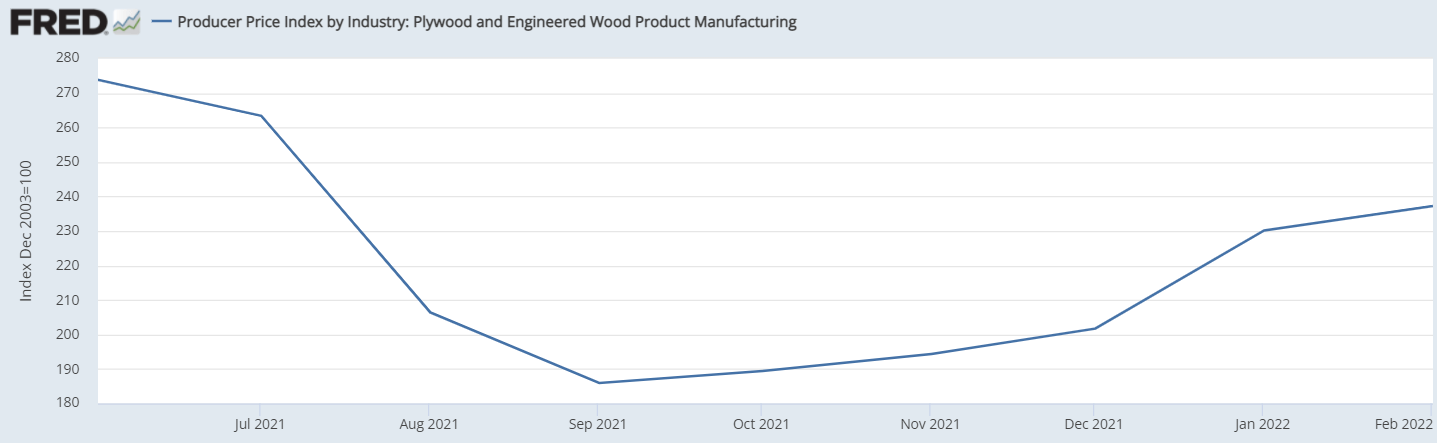
All of this creates a lot of noise on the margin front. One month can see phenomenal price realizations only for the next few to see large drops like we saw in Q3 ’21. That’s certainly a risk that investors need to be aware of, but what concerns me most is that amid all of these price increases and decreases, wood-related pricing remains at historically high levels. Here’s a glimpse into how high plywood prices are relative to historical levels.
Federal Reserve Database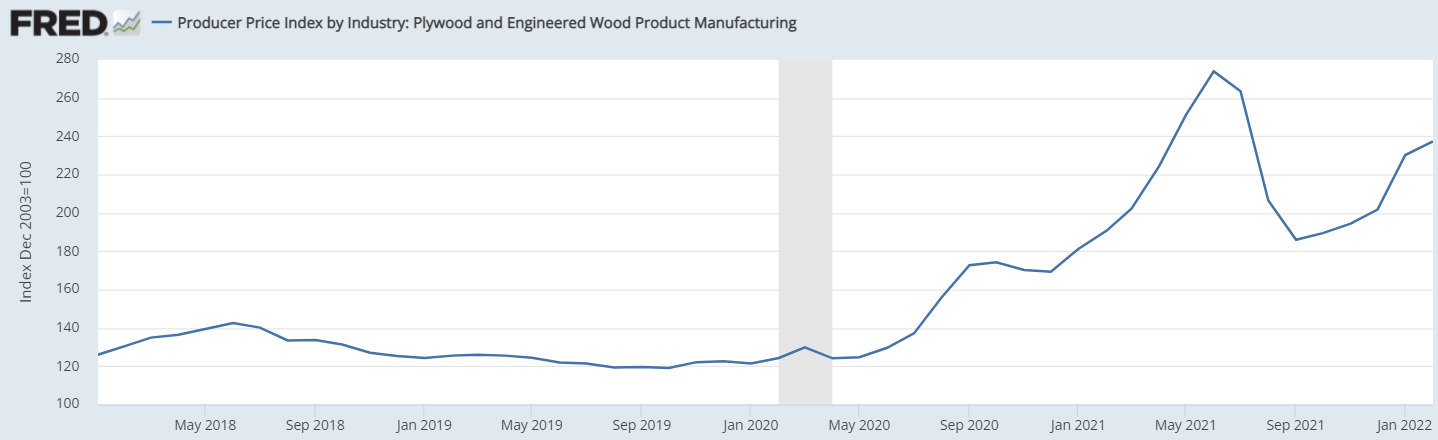
With such dependency on these prices for BCC’s top-line growth and profit margins along with how much a mean reversion in prices would affect these numbers, I would need to be able to start a position in this stock at a very favorable price at a valuation that takes into account an eventual normalization in pricing.
What This All Means for BCC’s Valuation
As mentioned in the intro of my article, I derive my share price targets from a discounted cash flow model that is driven by a full three-statement model for each company I analyze. At a high level, here are some assumptions for 2022 and beyond I gained from each earnings call that is input into my models.
1. The company has yet to provide margin guidance for 2022, so unlike my previous articles where my model could be tied to a concrete profit margin number for the upcoming year, that cannot be the case. Instead, I will be tying to 2022 and 2023 consensus EPS estimates for the year, which most recently stood at $15.07 for 2022 and $8.88 for 2023.
2. There will be no revenue growth in 2022 and 2023 will see a YoY decrease. My logic here lies in the assumption that commodity markets will normalize and BCC will face headwinds in terms of both revenue and profits as this correction takes place. This assumption really oversimplifies things, but I wanted my valuation to reflect a drop in earning power for the company over the next couple years so the share price that gets churned out of my DCF is relatively conservative.
3. CapEx guidance for 2022 in both the Q3 and Q4 calls was between $110 and $130 million. I have adjusted the capex as a % of revenue in my three statement model so that 2022 annual capital expenditures fall in between this range. The company also guided that effective tax rates would be between 25-27%, so 26% was the number I hardcoded into my model.
4. $50 million principal on variable interest rate debt will come due in 2025. The timing and amount of this cash outflow is input into my model.
For those familiar with these types of models, there are obviously a lot more assumptions that go into it. In future articles, I plan on digging into my assumptions and what went wrong versus what went right. But to oversimplify everything and provide some numbers, here is a snippet of a valuation sensitivity table with a range of WACC (Weighted Average Cost of Capital) and Long-term growth rate assumptions (both very important for the terminal value of a DCF).
Personal Financial Model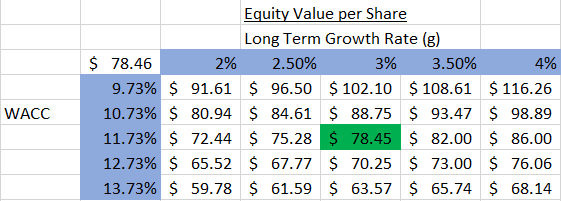
A few notes about the inner workings of my model and DCFs in general. A DCF sums the present value of all future years’ cash flows. There are two periods we project unlevered free cash flow for. The first stage is your forecast period, which for this model is 5 years. The stage one cash flows are ultimately determined by various assumptions such as revenue growth rate and profit margins, among other things. These 5 years of free cash flows are then discounted by some factor to get the present value of each and then summed together. For Boise Cascade, the sum of its present valued cash flows for the next 5 years is $1.27 billion, with the company seeing a gradual decrease in record setting free cash flows from its most recently completed year.
This completes the first half of the enterprise value calculation. The remaining step is to find a way to quantify the present value of all future cash flows after the initial 5-year forecast period. There are a few methods of doing this, but I use the Perpetuity Growth Model. At a high level, this model assumes an infinite long-term growth rate of free cash flows and utilizes this growth rate and Weighted Average Cost of Capital to arrive at the terminal value. This terminal value is then discounted to find the present value, and for BCC, this number is $2.12 billion. Adding this $2.12 billion terminal value of cash flows to the $1.27 billion of stage 1 cash flows brings us to the Enterprise Value of $3.4 billion.
We then need to get to Equity Value, which is obtained by subtracting long-term debt from cash & equivalents to get Net Debt. For BCC, Net Debt is equal to -$303 million (more cash and short term equivalents on the books than long term debt). This number is subtracted from Enterprise Value and leaves us with an Equity Value of $3.1 billion. To get our final share price estimate, take this equity value and divide it by our diluted common shares outstanding (39.375 million) to get an average share price of $78.46.
As mentioned earlier, I will be reviewing particular assumptions and their accuracy (or lack thereof) in future articles when more company actuals are available.
Risks
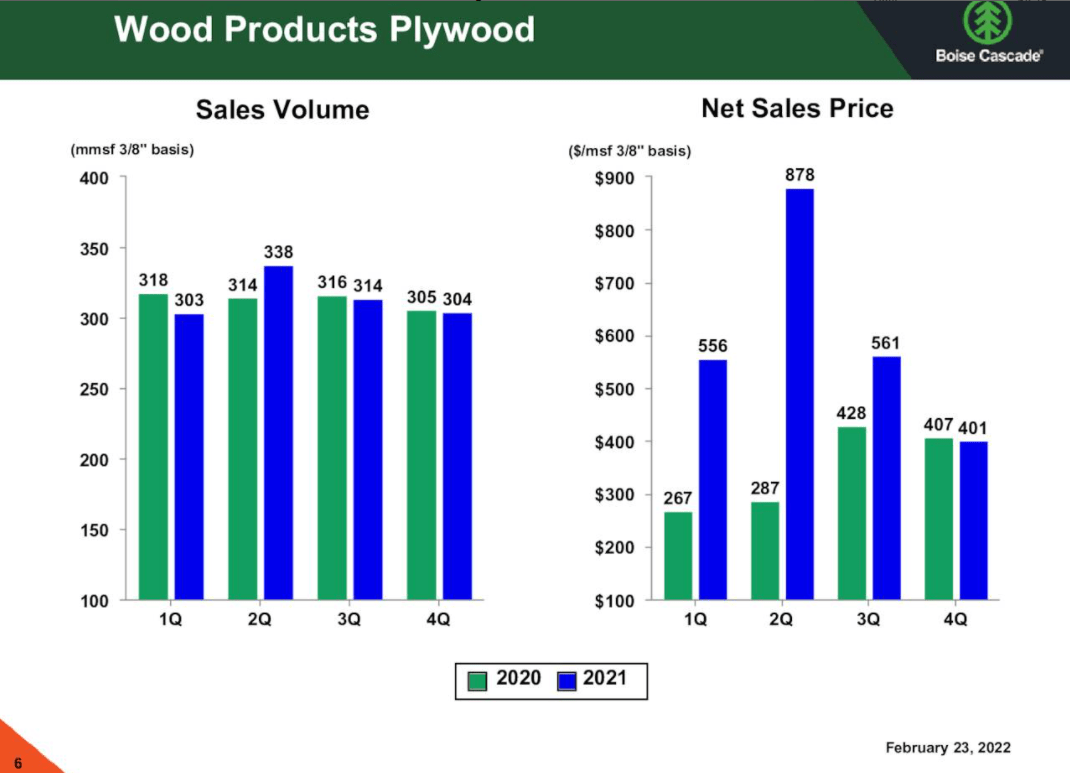
As already touched upon, commodity pricing will be a sizeable risk to Boise Cascade’s business and my valuation. Wood fiber makes up 45% of company’s cost of goods sold and also plays a role in how much the company can increase prices for their products, and when such a large percentage of a stock’s costs and revenue are associated with a volatile commodity, the downside risks must be considered. With that being said, a large drop in prices is currently baked into my analysis of the company. But as evidenced in the first image below, if lumber prices work their way anywhere near 2019 levels, a big bite could be taken out of BCC’s revenue. The second image demonstrates how heavily the Wood Product’s revenue growth over the past year has relied on pricing growth rather than volume, further emphasizing top-line downside risk if prices were to drop.
Q4 Earnings Presentation Q4 Earnings Presentation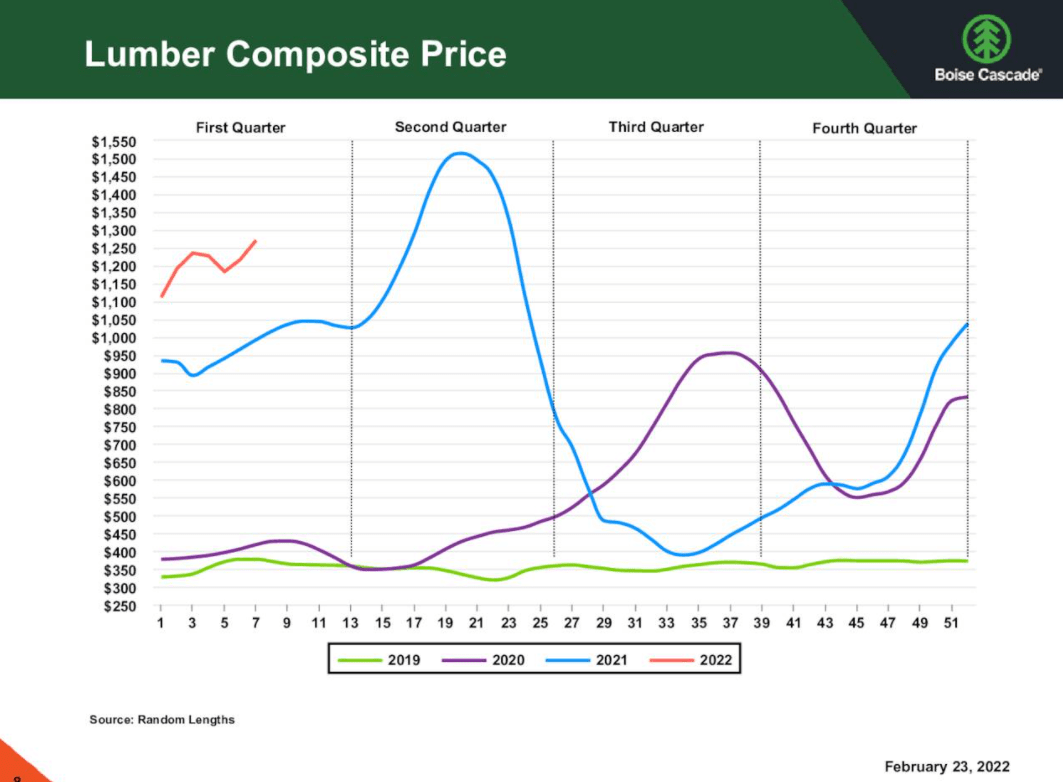
Another risk is end market demand. After an incredible hot streak, there’s some signs of the housing market- something BCC’s business is highly correlated to- slowing down a bit. Affordability is becoming a key point of concern for prospective buyers. Sticker prices in most housing markets have been on the radars of most consumers for some time now, but another aspect of affordability has crept into the conversation: mortgage rates. While still historically low, a sharp run up of nearly 2 percentage points in the fixed 30-year mortgage rate over the course of the last 6 months is starting to worry some investors and buyers. Additional concerns mount as the consensus emerges that these rates will only continue their upward trend as the Fed will further lift their benchmark rate to battle inflation.
Even with all of this going on, some still see plenty of room for the market to run. A 3/31 WSJ article seemed to claim that there was no evidence recent rises in mortgage rates were affecting demand since the number of mortgage applications had risen in 3 of the past 4 weeks. In my opinion, the more likely explanation for this phenomena is that since buyers know rates are bound to go so much higher, they are scrambling to settle their mortgages and lock in a lower rate than what they would get in 6 months from now. Despite this being a strong risk in my mind, for me it’s too early in the cycle to definitively say whether the housing market is in store for a large cool-down. Higher rates have certainly sent vibrations throughout all levels of the market, but there’s so much liquidity from consumers and such sizeable backlogs from home builders where I think there’s still room for the housing market to grow- and Boise Cascade along with it.
Comps
For reference sake, here are some comparable companies and how Boise Cascade stacks up in regards to some key ratios. Apples to apple comps are impossible to find in any industry, but both Louisiana-Pacific (LPX) and Builders FirstSource (BLDR) are pretty close. BCC seems to be valued on the lower end amongst the group, especially if you put any stake in EV ratios. The stock also trades at a comparatively low earnings multiple while boasting the highest EPS of the peer group. Clearly the sector has been hit pretty hard in the past month, but I view it as a good buying opportunity especially considering the intrinsic value of Boise Cascade.
| Boise Cascade | Louisiana Pacific | Builders FirstSource | |
| P/E Ratio | 4.90 | 4.77 | 6.48 |
| ’21 EPS | $18.07 | $14.02 | $8.55 |
| EV/EBITDA | 2.35 | 2.58 | 4.77 |
| EV/Sales | .31 | 1.11 | .70 |
| 1 Month Performance | -9.78% | -9.67% | -14.82% |
Source: Seeking Alpha Financials
The Bottom Line
There are certainly shortcomings to primarily analyzing earnings calls, but I believe it can be a very useful tool in a holistic analysis of a stock – especially as wording from executives across these calls can be so strategic and have a deeper meaning than face-value. Financial models also rely on forecasts and input assumptions, but just like earnings calls, if they are utilized correctly they can provide valuable insights into the valuation and financial health of a company.
My Discounted Cash Flow valuation model suggests the intrinsic value of Boise Cascade’s stock is $78.46, representing a ~14% upside from the most recent closing price of $68.82. The company has really benefitted from higher pricing power over the past couple of years, but amid this solid run there has been growing concern about how much a seemingly inevitable downswing could affect revenue and profits. However, I think the risk is already baked into the valuation as can be seen from my three statement model and discounted cash flow analysis. The stock is able to generate a lot of cash and I firmly believe this will lead to solid returns for investors in the future.
Be the first to comment