


koyu
Boeing (NYSE:BA) is rising, phoenix-like, from the ashes and is flashing our most important fundamental/technical Buy Signal which is our proprietary score of 82 out of a possible perfect score of 100. It appears on our “Smart Money” and “Insider Buying” lists of stocks, as well as being picked by our Robo program.
It is bouncing up after putting a bullish double bottom in place, as you can see on the monthly chart below. You can see all the buy signals on the chart. The price trends have changed from down to up and it is outperforming the Index. Most importantly, money flow is improving. This did not happen on the first bounce off the bottom. Another big change from the last bounce is the breakout in price performance above the downtrend. BA is now outperforming the Index on a trend basis.
Naturally, we want to do our fundamental due diligence on our computer scoring system. The first place we go to is Seeking Alpha’s articles and SA’s complete fundamental data on Boeing. The SA quantitative ratings are very good for profitability, growth, and momentum, but failing grades for valuation and revisions.
By hitting the valuation tab we can see the specifics. BA is grossly overvalued based on Forward PE, Enterprise Value and Price to Cash Flow. If we hit the Financials tab we can go to the Balance Sheet and see the enormous debt hole that BA is digging itself out of now and in the future. Debt jumped from $8 billion to over $60 billion during the crisis and now has dropped back to over $50 billion.
If we hit the Earnings tab we can see the disaster. Almost all of the analysts are revising downward. The 4th quarter was a big miss in earnings. However, this is not surprising. The strategy during a bad year is to write-off as much as you can in the fourth quarter to help earnings in the coming year. Actually, investors are looking out 5 years for BA and ignoring the expected poor earnings short term.
BA is looking to beat downward revisions in earnings, which will help price during 2023. Revenues are projected to jump this year, with earnings and cash flow finally turning positive. So you can see why we can go with the high grades for growth. profitability and momentum given by SA’s scoring system. The market is looking over the valley to the long term valuation and upward earnings revisions for BA, rather than the short term downward revisions.
Why did the bottom fishers start buying at $125 and continued buying for the last four months, taking price to $213 today? Why did institutional ownership increase from 52% to 57%? Obviously they have calculated that BA is worth a lot more than $125. One of these calculations is to take the present value of the income stream based on the 5-year backlog of planes that BA has sold, but still has to produce and deliver.
The bottom fishers doing this calculation have come up with a value. My guess is that value is close to $278 because that was the high of the first bounce off the bottom. That was the last time they made this same calculation. This bounce has better buy signals on the chart below than the last bounce. Plus the classical double bottom is now in place. The first bounce was premature.
Here is our monthly chart and we have identified all the buy signals for you.
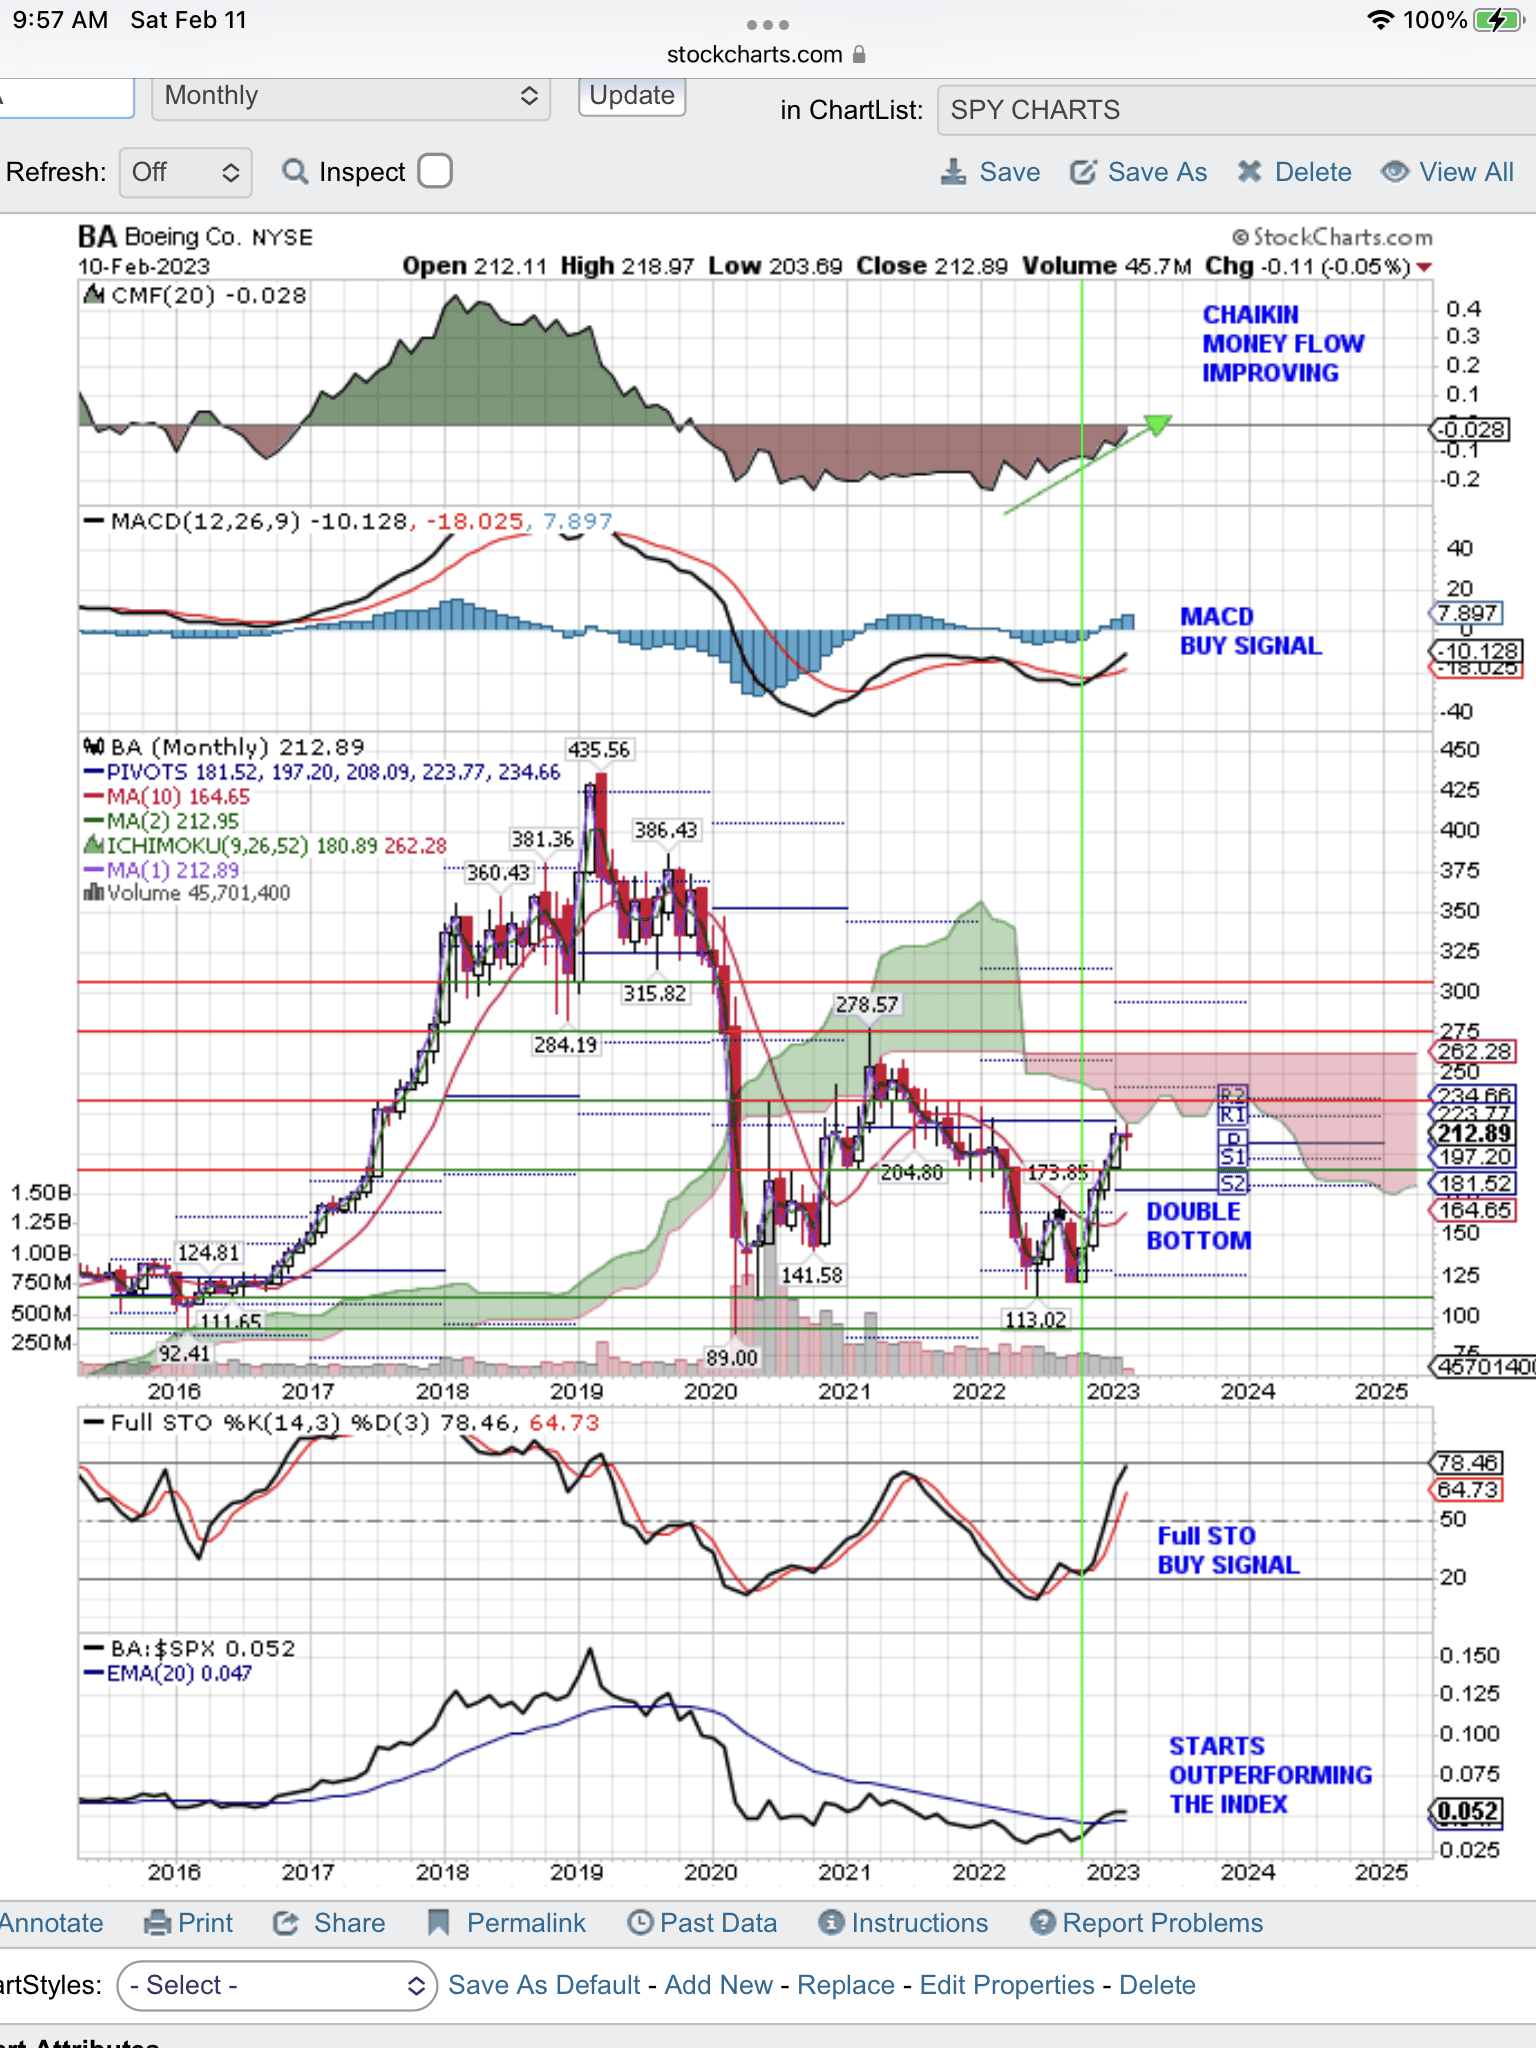
Boeing Buy Signals (StockCharts.com)
NOTE: The light green, vertical line, Buy Signal as bottom fishers started buying at $120 and continued buying for the last four months taking price up, off the bottom. This bounce has two buy signals that the last bounce did not have, namely the green arrow in Chaikin Money Flow and the green, vertical line, buy signal triggered by breaking above the downtrend in Price relative to the Index shown at the bottom of the chart. (Also note the horizontal lines we have drawn on the chart to identify support and resistance levels.)
Be the first to comment