

John-Kelly
Introduction
Investing in blue-chip companies that pay dividends, relentlessly focusing on reinvesting the proceeds, is a proven strategy for reliable long-term returns, also thanks to the beneficial effect of compounding. I discussed this topic in my last article using five companies with solid track records as examples.
But what if the rare black swan shows up? What if one of the seemingly bluest of blue chips is hit by potentially devastating litigation? What if earnings growth turns out to be the result of financial engineering? What about overlooked liabilities on the balance sheet, such as unfunded pension liabilities?
As an investor, I’m well aware of the many cognitive biases to which the human mind can fall prey. One example of such a bias is confirmation bias – we construct our thesis and unconsciously look for aspects that confirm that thesis, and have difficulty properly considering possible negative aspects. Therefore, I usually force myself to focus on the negative aspects I encounter in my due diligence. I try to invert my thesis and consider what could go wrong.
In this article, I want to discuss some (more or less) red flags at certain blue chip companies. Of course, this does not mean that the companies I mention are bad investments – in fact, with two exceptions, I think they’re good to formidable investments. Read on to find out what I consider to be potential red flags in some of the large blue chips and what conclusions I have come to in my own due diligence. I will discuss one company at a time, so readers who are particularly interested in a single company can scroll directly to that section. At the end, I will summarize the key findings.
Lockheed Martin
After a relatively lackluster performance since 2019, shares of defense contractor and maker of the famous F-35 combat aircraft Lockheed Martin (LMT) began to rise – hardly surprisingly – as tensions between Russia and Ukraine increased. I last reported on the stock in October 2022, when it was trading around $400 (which I think is a good value), so I refer readers to that article for my reasons for choosing LMT as a long-term position.
In addition to all the undeniable positives, LMT is still a company that operates in an “old” industry with conventional compensation models. As such, it carries a significant pension liability on its balance sheet, part of which is unfunded and sensitive to stock- and bond market gyrations – a liability definitely worth considering in one’s due diligence. At the end of 2021, the company’s total defined benefit obligation was $43.5 billion. That represents about 86% of LMT’s total assets in 2021, or 6.5 times LMT’s 2021 free cash flow, normalized for working capital movements and adjusted for stock-based compensation expense (normalized FCF, nFCF). Of course, I’m not suggesting that these liabilities are entirely unfunded. At the end of 2021, LMT had pension plan-related assets with a gross fair value of $35.2 billion on its books, which translates an actual unfunded liability of about $8.3 billion – still a significant amount, especially when compared to peer group members Boeing (BA), Northrop Grumman (NOC), General Dynamics (GD), Raytheon Technologies (RTX), and L3Harris Technologies (LHX) – see Table 1.
Table 1: Pension- and healthcare-related liabilities in percent of total assets of LMT, BA, NOC, GD, RTX and LHX (own work, based on the companies’ 2021 10-Ks)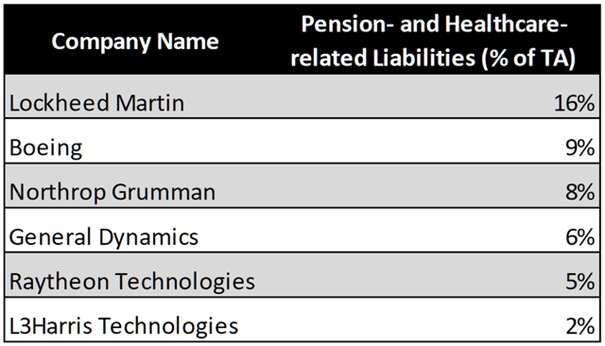
On a comparable basis, unfunded pension liabilities are expected to look worse at the end of 2022 due to the bear market. However, Lockheed management is relentlessly focused on reducing risk by offloading these liabilities. For example, in August 2021, the company purchased group annuity contracts that allowed it to transfer nearly $5 billion in pension liabilities and related assets to Athene Holding (ATH). Similarly, LMT reduced its exposure by $1.9 billion and $3.6 billion in 2012 and 2018, respectively, and the company’s most recent balance sheet ( third quarter 2022) shows $5.7 billion in accrued pension liabilities, indicating further “outsourcing” this year. LMT’s cash flow statement for the first nine months of 2022 shows a $1.5 billion pension settlement charge, and the company issued a press release in June 2022 confirming the purchase of additional group annuity contracts from Athene that allowed it to reduce its gross obligation by $4.3 billion.
While I continue to monitor LMT’s unfunded pension liabilities, I welcome the company’s continued emphasis on reducing its unfunded pension liability on a net basis. From this perspective, I am not the least bit concerned about my long-term position in LMT.
Kimberly-Clark (KMB)
Kimberly-Clark, the company behind consumer staples brands such as Huggies, Cottonelle, Scott, Kleenex and many others, is a favorite blue-0chip company for many investors. I do not question the strength of Kimberly-Clark’s brand portfolio at all, but I do believe that the company is worse positioned than its peers, as I pointed out in my October 2021 article. At the time, I held a very modest position that I intended to grow over time. However, the company’s continued uninspiring performance confirmed my view, and I decided to sell my shares during a period of consolidation of my portfolio holdings. This is not to say that you should do the same, of course – I’m just pointing out why I personally think Kimberly-Clark is a questionable investment, especially as a long-term investor.
KMB’s FAST Graphs chart in Figure 1 shows that the company’s earnings grew like clockwork between 2001 and 2020. During the Great Recession, earnings declined slightly as consumers shifted to low-cost brands, but the COVID-19 pandemic obviously gave the company a significant tailwind. Between 2001 and 2021, earnings grew by an average of 3.9% per year, and by 3.4% between 2010 and 2021. Inflationary pressures, underscoring KMB’s comparatively weak market position, caused profits to fall 20% and 9% year-over-year in 2021 and 2022, respectively. Gross margin declined 484 basis points in 2021. However, as the company continues to raise prices (being careful not to lose market share to competitors) and improve its supply chain, margins should gradually recover – as indicated by analyst estimates for 2023 and beyond (Figure 1, dashed lines).
Figure 1: FAST Graphs chart of Kimberly-Clark [KMB] (obtained with permission from www.fastgraphs.com)![FAST Graphs chart of Kimberly-Clark [KMB]](https://static.seekingalpha.com/uploads/2023/1/18/49694823-16740444267343454_origin.png)
However, there’s one aspect that is rarely mentioned on Wall Street, which is usually obsessed with tracking performance on a per-share basis.
Most, if not all, long-term investors hold KMB as a dividend stock, expecting a continuation of the growth trend that has been unbroken for 51 years and that marks the company as a rare dividend king. Since 2010, the dividend has grown at an average annual growth rate of 4.7%, slightly faster but still in line with earnings growth, considering that KMB’s earnings growth trend was intact until 2020. In addition, KMB is one of those companies that’s very well managed from a working capital perspective – its cash conversion cycle has declined from about 30 days to about seven days over the past decade, largely due to extended payment terms with suppliers and well-managed inventory levels.
What’s not to like, you might ask? It’s the free cash flow that worries quite a bit. Since at least 2010, free cash flow, normalized for working capital movements and adjusted for stock-based compensation expense, has been treading water (nFCF, Figure 2). So how has KMB managed to grow its earnings at an average annual growth rate of 3.9%? After all, revenue has also been stagnant since at least 2010 ($19.8 billion in 2010 versus $19.4 billion in 2021).
Figure 2: Kimberly-Clark’s [KMB] historical free cash flow, normalized with respect to working capital movements and adjusted for stock-based compensation expense (own work, based on the company’s 2010 to 2021 10-Ks)![Kimberly-Clark's [KMB] historical free cash flow, normalized with respect to working capital movements and adjusted for stock-based compensation expense](https://static.seekingalpha.com/uploads/2023/1/18/49694823-1674044474083584_origin.png)
In addition to the working capital improvements already mentioned, share repurchases are the elephant in the room – over the last 12 years, KMB repurchased $11.7 billion worth of shares, or $9.3 billion net of proceeds from stock options exercised. It almost goes without saying that KMB has not been able to fund all of the repurchases with free cash flow, as underscored by the increase in net debt from $5.3 billion at the end of 2010 to more than $8.8 billion at the end of 2021. During this period, the number of diluted shares outstanding declined from 414 million to 339 million, resulting in a 22.3% increase in earnings per share. This represents an average annual “growth rate” of 1.9%, or more than 50% of EPS growth over the same period. I leave it to the reader to decide whether such growth should be classified as sustainable or rather financial engineering.
Overall, I dislike the fact that management continues to paper over the lack of organic growth with excessive share buybacks. It’s true that the company is very well managed from a working capital perspective, but the cash conversion cycle can only be optimized so far. I doubt there’s much leverage on that front left. Finally, the fact that KMB’s net debt has increased by nearly 70% between 2010 and 2021 makes it extremely unlikely that the company will be able to grow through acquisitions – especially in a higher interest rate environment. Certainly, the dividend will likely continue to grow for the foreseeable future, but the payout ratio of 80% of three-year average nFCF suggests relatively little headroom.
In summary, I do not view KMB as a worthwhile long-term investment, as the company is maneuvering itself into a corner from a balance sheet perspective and appears unable to generate meaningful organic growth. Kimberly-Clark is a textbook example of why investors should not rely on per-share metrics and should not invest carelessly in a company just because it is a dividend king. Suffice it to say, I have no plans to re-open a position in this stock.
Merck & Co. (MRK)
I was always a little skeptical of Merck. However, after taking a closer look at the company around New Year 2022, I concluded that I was probably too negative in my due diligence. I explained my reasons in my March 2022 article and built a position in the company in the first quarter of 2022 and to a lesser extent in the second quarter. Since then, the market has been very appreciative of Merck in general and its key blockbuster cancer treatment Keytruda (pembrolizumab) in particular. For example, the drug is used as a first-line treatment for metastatic bladder cancer in certain patients and as a first-line treatment for metastatic non-small cell lung cancer in certain cases. The number of indications grows rapidly. With the cash cow Keytruda in mind, as well as other blockbusters such as the human papillomavirus (HPV) vaccine Gardasil, the company looks pretty well positioned and is also much more focused since the 2021 spin-off of Organon (OGN), itself focusing on contraception, psychiatry and hormone replacement therapy, among others.
However, if there is one thing that is to dislike about Merck, it’s the (over)reliance on Keytruda. Most of the expected earnings growth in 2024 (17%) and 2025 (11%) will be attributable to Keytruda (Figure 3), which is likely to become the world’s top-selling drug by 2026.
Figure 3: FAST Graphs chart of Merck & Co [MRK] (obtained with permission from www.fastgraphs.com)![FAST Graphs chart of Merck & Co [MRK]](https://static.seekingalpha.com/uploads/2023/1/18/49694823-1674044529476983_origin.png)
According to the company’s 2022 third quarter 10-Q, Keytruda generated $15.5 billion in sales, up 23% YoY. Gardasil grew 31% YoY, and total Pharmaceutical segment sales increased 30% to $39.0 billion from $30.7 billion. Excluding Lagevrio (molnupiravir, COVID-19 treatment, $4.9 billion), sales growth would still be significant at 14% YoY in the first nine months of 2022. Keytruda accounted for 44.3% of total Pharmaceutical segment sales, adjusted for Lagevrio, or nearly half of the segment’s sales (Figure 4). Merck’s other segment, Animal Health, contributed $4.3 billion in sales – not insignificant, but a figure definitely dwarfed by Keytruda sales. Aside from Merck’s concentration risk with Keytruda (risk of still unknown side effects or more effective treatments from competitors), it’s also important to remember that the company generates about 48% of its Pharmaceutical segment sales in the U.S., or 50% when excluding Lagevrio. This trend has “worsened” compared to prior years (see my December 2021 article). Gardasil somewhat improves Merck’s international exposure (67% of total drug sales), while Keytruda sales are split roughly 60/40 between the U.S. and international markets as of Q3 2022.
Figure 4: Product sales in Merck’s Pharmaceutical segment for the first nine months of 2022 (own work, based on the company’s 2022 10-Q3)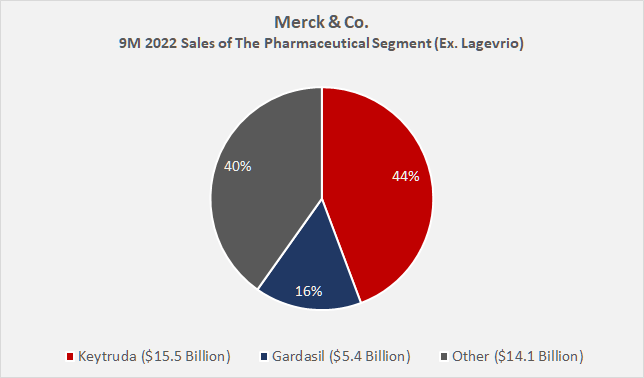
Of course, there are other big pharma companies with far more significant exposure to the U.S., such as AbbVie (ABBV) or Amgen (AMGN). The former generated 78% of its 2022 nine-month sales in the U.S., and the latter 71%, so they are theoretically both more exposed to the impact of the Inflation Reduction Act and the Drug Price Negotiation Initiative (accurate conclusions require a review on a per-treatment basis). Of course, AbbVie also serves as a good (and well-known) example of a pharmaceutical company with product-related concentration risk. Humira (adalimumab), its successful TNFα inactivator, was still responsible for 36% of the company’s sales in the first nine months of 2022.
I do not want to be misunderstood here – I’m not questioning Merck’s return to meaningful growth and I’m very confident about the company’s prospects. However, I think it’s important to consider the increasing reliance on Keytruda in one’s due diligence on the one hand and on the U.S. market on the other. For the purpose of risk management, I therefore hold a broadly diversified portfolio of pharmaceutical companies.
Philip Morris International (PM) And Altria Group (MO)
International tobacco giant PM, separated from the original Philip Morris (now Altria Group) in 2008, is the undisputed leader in modified-risk products such as vapes, heated tobacco, and oral tobacco products. I first reported on the company in July 2022 and provided an update in October after it was announced that PMI had increased its bid for Swedish Match, the company behind the top-selling nicotine pouch brand Zyn, from SEK 106 to SEK 116. The acquisition will position PMI as a major player in the oral nicotine products segment as the company regains access to the high-margin U.S. market. PMI also will have fairly unrestricted access to the heated tobacco products market in the U.S. after reaching an agreement with Altria Group (MO) that will allow it to market IQOS in the U.S. starting in May 2024. Altria will pursue its own ambitions in the heated tobacco products segment, but has arguably gotten off to a very slow start compared to PMI or British American Tobacco (BTI, OTCPK:BTAFF).
In terms of the product and brand portfolio, I’m very positive about PMI’s future – at least as positive as one can be when investing in a company with a de facto dying core business. However, as an income-oriented investor, I keep a close eye on the company’s free cash flow. Figure 5 compares PMI’s normalized free cash flow (as above) to Altria’s, and it’s easy to see that the former has not shown any significant growth since 2010, while the latter seems to have reached a plateau only since 2018 (2016 and 2017 were impacted by the AB InBev/SABMiller transaction, tax provisions, and accrued settlement charges). To be fair, Altria has benefited from stronger margins in the U.S. market and thus from greater leverage in improving profitability over the years (Altria’s operating margin increased from 37% in 2010 to 55% in 2021). To some extent, PMI’s weak nFCF growth is also due to its significant reinvestment in the business. While Altria reinvested only 3.7% of its total normalized operating cash flow from 2010 to 2021, PMI reinvested 11.2%, or $12.3 billion.
Figure 5: Altria’s [MO] and Philip Morris’ [PM] free cash flow, normalized with respect to working capital movements and adjusted for stock-based compensation expense (own work, based on the companies’ 2010 to 2021 10-Ks)![Altria's [MO] and Philip Morris' [PM] free cash flow, normalized with respect to working capital movements and adjusted for stock-based compensation expense](https://static.seekingalpha.com/uploads/2023/1/18/49694823-16740445890683916_origin.png)
Similar to KMB, EPS growth at PMI was partially driven by share buybacks. Between 2010 and 2021, PMI retired nearly 14% of its outstanding shares, boosting EPS by nearly 16%, or an average of 1.4% per year. However, PMI’s management was far less aggressive than KMB’s, with operating earnings per share rising an average of 4.2% p.a. during that period. Still, one’s due diligence should take into account that PMI is growing at a somewhat slow pace without the added benefit of share repurchases. Of course, the declining core business also needs to be considered in this context. However, and in contrast to KMB, it seems worth noting that Philip Morris returned less cash to shareholders via dividends and share repurchases between 2010 and 2021 than it generated in terms of nFCF ($102 billion spent versus $110 billion generated).
All in all, of course, I would not go so far as to view PM’s weak FCF growth as a red flag. PMI has fueled its somewhat weak EPS growth with buybacks (same as a plethora of other companies), but unlike KMB, the company has returned less cash to shareholders than it has actually generated. Given PMI’s strong investment in and growth in the modified-risk products sector through the IQOS franchise, and the added benefit that the company will soon be the leading supplier of oral nicotine products, I’m not concerned about the intermittent weak FCF growth and I’m quite comfortable with my investment in PMI. However, I will not add to my position as I think the valuation is a bit high (P/E of over 17, nFCF yield of under 6%).
From a free cash flow growth perspective, Altria looks much better as it operates in a much more favorable market from this perspective and has also invested far less back in the business than PMI (aside from the failed inorganic growth attempt through its 35% stake in JUUL, of course). However, it should be noted that the better profitability comes with a high concentration risk (Altria operates its tobacco business only in the U.S.). It’s clearly a riskier investment than PM (underlined by its dividend yield of over 8%).
Johnson & Johnson (JNJ)
Just recently, I covered JNJ, the major healthcare blue chip, and explained why I think it’s a better dividend growth stock than Switzerland’s Roche Holding AG (OTCQX:RHHBY, OTCQX:RHHBF). Understandably, JNJ is highly regarded by investors for its wide economic moat, economies of scale, strong diversification, and shareholder-friendly management. However, litigation related to the company’s talc-containing products (e.g., Johnson’s baby powder) created uncertainty and unease among investors, especially after a $4.7 billion verdict in 2018. Just to be clear: I’m not discussing the social aspects here, and of course I do not mean to disparage the people who have health issues and are taking action against JNJ. I will discuss the matter from a shareholder’s perspective and decide whether the company’s recent actions will be able to limit liabilities to a level that will ensure continued operations and represent a manageable impact on earnings. In this brief analysis, however, I will not discuss other litigation related to opioids, surgical mesh products, and the company’s schizophrenia drug Risperdal (risperidone).
JNJ’s primary strategy since 2021 has been to ensure that pending cases are heard in bankruptcy court, thereby limiting the company’s financial risk. To that end, LTL Management LLC, a subsidiary that holds and manages litigation claims, was formed and received permission to file for Chapter 11 in North Carolina. JNJ will provide LTL with funds to pay the amount currently owed and will also establish a $2 billion fund and allocate certain royalty income (currently valued at approximately $350 million) to settle future claims.
The restructuring into two successors – one assuming the aforementioned liabilities and the other continuing operations as normal – and the subsequent bankruptcy of the former is known as the “Texas Two-Step.” The S-1 registration document, recently filed by Kenvue (KVUE) (the name of JNJ’s Consumer Health division after its initial public offering), on page F-55 et seq. explains the process in detail. Briefly, JNJ formed a limited liability company in Texas, which was then merged with the Consumer Health division. This step was necessary to permit a separation under the divisional merger law of Texas and to create one subsidiary that would assume the liabilities and another that would continue to operate normally. In this context, it’s certainly interesting to note that, according to JNJ’s Alex Gorsky, litigation played no role in the decision to spin off the Consumer Health division.
The S-1 registration document mentions in its summary of risk factors (p. 12 et seq.) [L]egal proceedings related to talc or talc-containing products, such as Johnson’s Baby Powder, sold outside the United States and Canada. It goes on to state that Johnson & Johnson will retain talc-related liabilities for products sold in the United States and Canada. In my opinion, this suggests that the liabilities related to claims in the U.S. (likely the lion’s share) are capped by the bankruptcy filing of LTL Management – a subsidiary of Johnson & Johnson. The change in JNJ’s outlook from negative to stable in early 2022 by ratings agency Moody’s, citing the following, supports this thesis:
The outlook change to stable from negative reflects J&J’s ongoing progress at resolving litigation uncertainties. Combined with strong operating performance and rising cash levels, J&J is likely to absorb litigation liabilities without material credit profile degradation.
– Michael Levesque, Moody’s Senior Vice President
This assumes, of course, that the bankruptcy is not challenged – a number of plaintiffs asked a panel of the 3rd U.S. Circuit Court of Appeals to dismiss LTL’s bankruptcy. However, not being a lawyer myself, I cannot comment on the potential impact of this motion.
However, it’s also necessary to look at the situation from a non-U.S. perspective, i.e., the risk that Kenvue will be held accountable. JNJ will receive net proceeds from KVUE’s initial public offering, and it has been rumored that shareholders will not receive any shares in the process. Thus, one might conclude that the liabilities associated with the litigation are a resolved issue from the perspective of JNJ shareholders. However, according to p. 79 of Kenvue’s S-1, JNJ owns at least 80.1% of KVUE’s voting rights, but intends to make a tax-free distribution to its shareholders for at least part of the equity interest. In my opinion, this means that JNJ’s owners will also be (diluted) owners of KVUE.
It follows that litigation outside the U.S. and Canada will likely weigh on Kenvue’s balance sheet, and therefore investors who intend to hold the shares should consider this risk in their due diligence. Personally, I believe that the lawsuits filed by U.S. plaintiffs account for the lion’s share, and therefore I currently expect to hold on to my KVUE shares. Of course, I will hold on to my significant position in JNJ.
3M Company (MMM)
Like the other stocks discussed in this article, 3M Company is a classic income stock – even more so after the renewed sell-off since late 2021. The stock currently trades with a dividend yield of 4.6%, is a dividend king with 61 years of uninterrupted increases, and boasts a 10-year compound annual dividend growth rate of 7.1%. In the short term, however, dividend growth has faltered – the five-year compound annual growth rate has fallen to 2.4%, and the last increase was a paltry 0.7%.
In part, this is due to a somewhat weakening competitive position over the last couple of years and, of course, partially unresolved headwinds related to the pandemic and its associated effects. The elephant in the room, however, is litigation, which some believe could even drive the company into bankruptcy. Of course, this is probably an overly pessimistic assessment. Equity investors still value the company, with its tens of thousands of patents and undeniable competitive advantages, at a market capitalization of about $73 billion. Still, the decline in the stock price from around $200 since 2021 suggests that 3M has significant problems, as does the increase in yield in 3M’s long-term bonds. Certainly, rising interest rates have contributed to the rise in yields, but, for example, the April 2050 3.7% senior unsecured notes (CUSIP 88579YBP5) currently trade for about 80 cents on the dollar, representing a yield to maturity of nearly 5%. The bond price recovered from its all-time low of about 69 cents on the dollar in October 2022, as did the stock, which recovered from $107 to about $127 currently. So in this column, I would like to offer my own take on things, as I also own a significant position in the company.
3M is facing litigation related to per- and polyfluoroalkyl substances (PFAS, PFCs), which are responsible for severe environmental damage, as well as earplugs that were allegedly defective and caused hearing damage. As in the JNJ case, of course, in my discussion of the situation from a shareholder’s perspective, I’m not trying to disparage anyone who suffers directly or indirectly from PFAS-related health problems or from the alleged defects in 3M’s earplugs.
The PFAS litigation dates back at least to 2010, when the Minnesota Attorney General sued 3M for allegedly harming drinking water and natural resources in the Twin Cities metropolitan area. The lawsuit was settled in 2018 for $850 million. Other examples include the state of New York or North Carolina, also involving The Chemours Company (CC) and DuPont de Nemours (DD). In connection with PFAS and perfluorosulfonic acids (PFSAs), 3M also is facing pressure from the European Union, particularly Belgium. All of these events are understandably damaging to the company’s reputation, which should be taken into account when valuing its stock. In fairness, however, it should also be taken into account that 3M has voluntarily discontinued the use of certain “forever” chemicals, increased research, improved detection, and implemented voluntary cleanup initiatives. Morningstar estimates the financial liability at about $7.5 billion, based on a study of comparable cases. That compares to 1.3 times the company’s average normalized free cash flow for 2019 through 2021 – certainly substantial, but manageable.
The earplug-related litigation is a different story. So far, 3M Company has lost 10 of 16 bellwether trials. I’m not a lawyer and would have expected that the advertised use case of the earplugs should matter, i.e., such a product cannot be expected to prevent hearing damage in the first place. In a product explanation of the CAEv2 earplugs, 3M does mention that the product reduces noise as intended at any frequency, but does not claim that it can prevent hearing loss.
However, I think it’s important to focus on the fact that the lawsuits allege that the hearing loss or problems (e.g., tinnitus) were due to defective design. In this context, it seems to me that Mr. Berger’s (former head of the 3M Personal Safety Division, now retired) testimony is important because it was used to demonstrate that the defect was due to a design flaw that was not communicated to the military (source, scroll down to March 30, 2022). In this context, it also seems worth noting that a U.S. District Judge from Florida rejected 3M/Aearo’s argument that any defect was based on a design mandated by the U.S. Army (source).
3M subsidiary Aearo Technologies is the company behind the earplugs. In July 2022, the subsidiary and related entities have voluntarily initiated chapter 11 proceedings seeking court supervision to help establish a trust – funded by 3M – to efficiently and equitably resolve all claims determined to be entitled to compensation. This reads similar to JNJ’s course of actions, but a U.S. bankruptcy judge in August 2022 declined to put the litigation on hold. In December, a federal judge ordered that 3M cannot argue that Aearo is the sole defendant. In contrast, the U.S. Chamber of Commerce argued that bankruptcy is often the only way for an otherwise healthy company to resolve mass tort exposure.
The fact that rating agency Moody’s changed 3M’s outlook from negative to stable in February 2022 and affirmed its A1 unsecured rating (equivalent to A+ at S&P) is reassuring in principle. However, the rating agency only mentioned PFAS-related liabilities in its rationale, which it considers “relatively modest” at around $412 million at the end of 2021. Still, it seems unlikely that Moody’s ignored the earplug-related litigation, which was already widely known at the time, in its analysis. In a later analysis, the agency wrote that Aearo’s bankruptcy plan was credit negative because of its dampening effect on 3M’s ability to reduce debt, but that the action would reduce uncertainty related to the litigation. This assumes, of course, that 3M successfully executes this strategy.
The outcome is uncertain at this point, but the longer the case drags on, the more likely it is that the plaintiffs will eventually settle. However, a move similar to JNJ, i.e., a “Texas Two-Step,” seems out of the question here. 3M has committed to pay $1 billion into the aforementioned trust, a sum that Morningstar believes is too low and instead estimates $3 billion is roughly fair for Combat Arms, based on comparable fact patterns on a per-plaintiff basis, adjusted for inflation (Morningstar analysis update from January 04, 2023).
Overall, the current estimate of about $10 billion to settle all claims (PFAS and earplugs) is certainly a significant amount for a company like 3M, but one that can be absorbed.
At a share price of around $130, I believe the risks are appropriately priced in. However, taking into account the litigation liabilities, 3M stock is not what I would call “deep value,” even though it trades at a P/E of 12.5 and an nFCF yield of 8%. Conversely, I do not think it’s appropriate to sell the stock at these levels. However, it should be clear that I hold 3M in a broadly diversified portfolio. I would not want to hold 3M in a concentrated portfolio, but of course that is a very personal decision that depends on the risk tolerance of the investor.
From a dividend perspective, I think it’s reasonable to expect further token increases, and with the upcoming increase in February, 3M would pay out a round $6.0 per share on an annualized basis. Income investors’ patience is likely to be tested for quite some time, as larger dividend increases would only lead to more negative headlines – something 3M does not need at all right now.
Key Takeaways
Clearly, investing in long-established blue chip companies is not a fool-proof way to get rich. Several blue chip companies face more or less significant risks or operational issues that need to be carefully considered by potential investors in their due diligence.
JNJ and 3M are currently facing significant litigation. In the case of JNJ, the issues seem to have been resolved and the impact on Kenvue appears to me to be manageable, although not capped as is most likely the case with JNJ. 3M’s earplug litigation is rightly weighing on the stock price because of the ongoing uncertainty. A similar outcome to JNJ seems unrealistic to me (I am not a lawyer), but I doubt the final liability will bankrupt the company. However, from a political standpoint, 3M stock should no longer be considered an inflation-beating dividend stock, even though the company will likely still generate $2 billion in annual free cash flow after dividends, even when including payments for the PFAS and earplug liabilities if they are funded over several years.
Lockheed Martin has a relatively high level of unfunded pension liabilities compared to its peer group. However, given the company’s strong and reliable free cash flow and ongoing efforts to offload the claims, I would not overemphasize this risk.
Merck suffers from a significant and growing concentration risk related to its key blockbuster cancer treatment Keytruda. However, this is part of the “cost of doing business” associated with investing in big pharma. I personally mitigate this risk by investing in multiple companies.
Finally, Kimberly-Clark and Philip Morris suffer from weak free cash flow growth, an aspect that is overlooked when focusing on per share metrics, as Wall Street is so accustomed to. In the case of KMB, I decided to sell my shares because I see no tangible growth prospects and the company is operating from a rather weak competitive position. Obviously, management has been glossing over weak earnings growth with excessive share buybacks. In PM’s case, I see it somewhat differently, as the company has invested heavily in modified-risk products, a segment in which I believe it holds the top position among peers. EPS improvement due to share buybacks has also been less aggressive. PM’s sister company in the U.S., Altria Group, obviously does not have a meaningful portfolio of modified-risk products and suffers from significant concentration risk (it sells cigarettes only domestically), but at the same time benefits from huge margin opportunities. The way management has improved profitability over the past decade is simply astounding. Despite all the risks associated with investing in the tobacco sector, I can sleep well at night holding such companies in a broadly diversified portfolio.
Thank you very much for taking the time to read my article. How did you like it, my style of presentation, the level of detail? If there is anything you’d like me to improve or expand upon in future articles, do let me know in the comments section below.
Be the first to comment