

Massimo Giachetti/iStock Editorial via Getty Images
Investment Thesis
The Invesco QQQ ETF (NASDAQ:QQQ) has trailed the SPDR S&P 500 Trust ETF (SPY) by 4.37% YTD but has not meaningfully closed its significant forward P/E premium of over six points. Last quarter’s earnings season was disappointing for many mega-cap constituents, and aggregate large-cap stock earnings surprises are trending downward. With the yield curve recently inverting and the Fed ready to tackle inflation with rapidly increasing interest rates, I’m still awaiting a substantial correction before issuing a buy rating. The risk-reward doesn’t make sense, and I look forward to taking you through the most up-to-date numbers to explain why.
QQQ Overview
The Nasdaq-100 Index includes 100 of the largest domestic and international non-financial companies on the Nasdaq Exchange. Alternatives to QQQ include QQQM and QQMG, but QQQ is the biggest and has an expense ratio of 0.20%. The sector exposures are listed below relative to the SPDR S&P 500 Trust ETF, showing how QQQ overweights Technology, Consumer Discretionary, and Communication Services. You can use QQMG to be even more aggressive in Technology at the expense of Consumer Discretionary, but it’s probably not going to change future returns too much.
Morningstar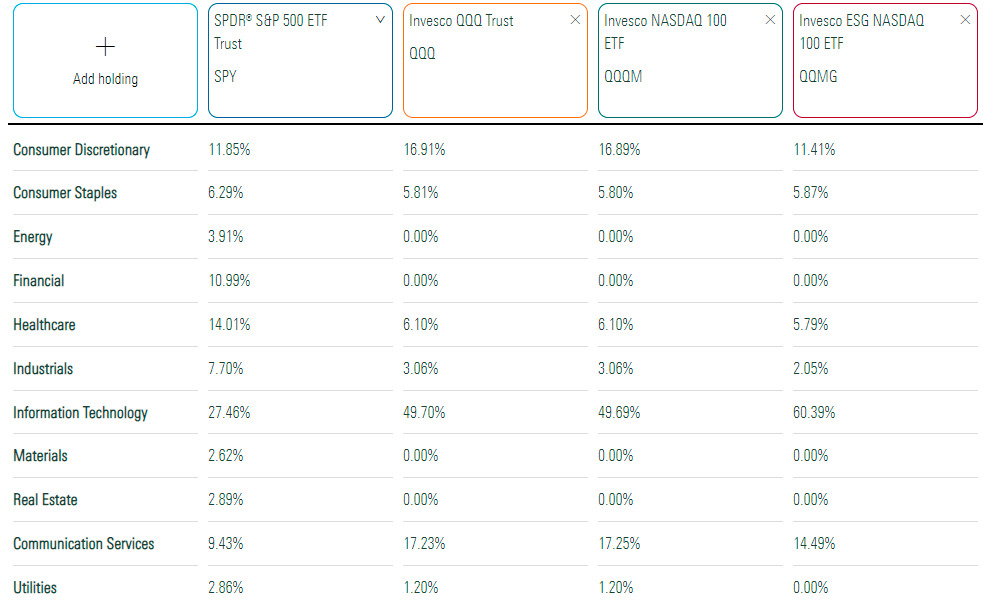
QQQ is cap-weighted, and with the top five holdings each with trillion-dollar valuations, it’s an ultra-concentrated ETF. The top 10 holdings total 53.46%, and the top 20 holdings total 68.72%. For those concerned about this, check out the First Trust NASDAQ-100 Equal Weight Index ETF (QQEW) or the Direxion NASDAQ-100 Equal Weighted Index Shares (QQQE).
Invesco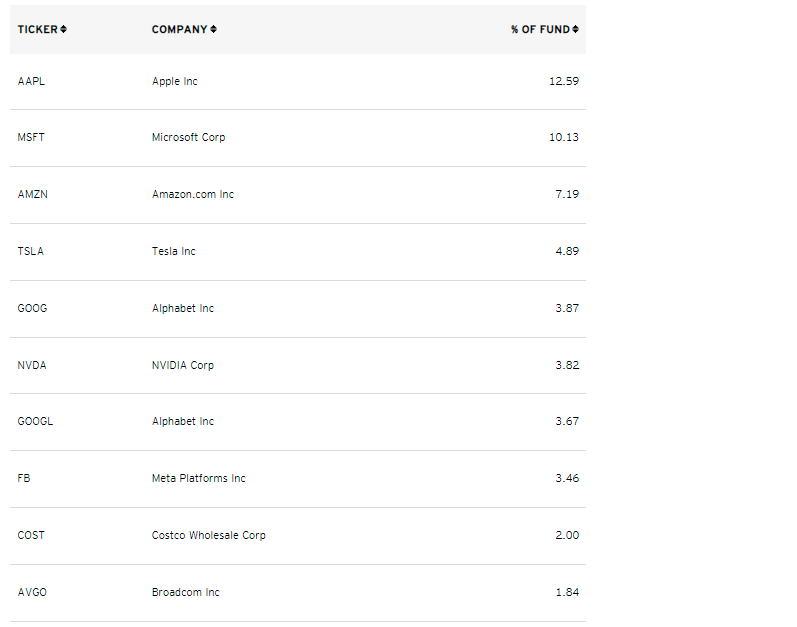
As shown, Apple (AAPL), Microsoft (MSFT), Amazon (AMZN), Tesla (TSLA), and Alphabet (GOOG, GOOGL) top the list. PepsiCo (PEP) is also a top ten holding if we were to combine Alphabet’s two classes of shares.
Performance-wise, QQQ has been a stellar product. At the risk of cherry-picking performance timeframes, readers might appreciate an annualized five-year rolling return chart more like the one below (link here). Since the Great Financial Crisis, QQQ has always been superior to SPY. Investors rewarded the most profitable companies the most, as you’d expect.
Portfolio Visualizer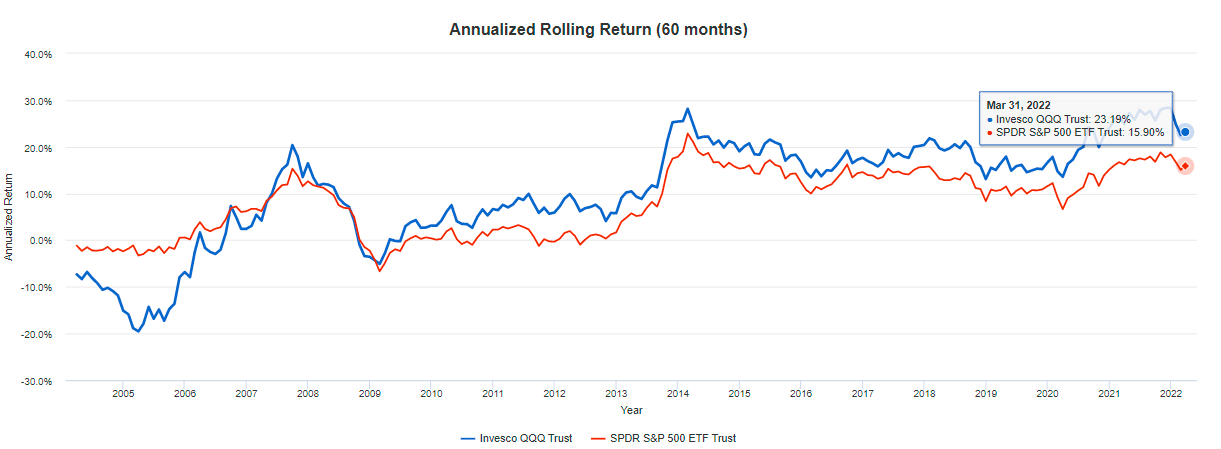
QQQ Snapshot
By Industry
The table below summarizes key fundamental metrics for QQQ’s top 20 industries. I outline all ETFs this way to bridge the gap between a narrow analysis of a fund’s top ten holdings and an overly broad sector analysis that’s not always helpful.
Author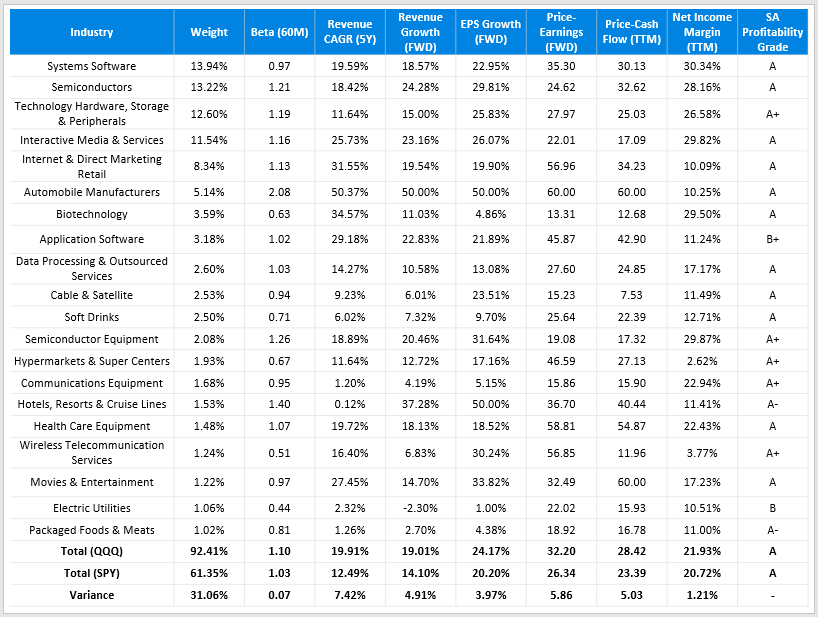
At a high level, 92.41% of QQQ is held in 20 industries compared with just 61.35% for SPY. QQQ is a bit more volatile, as suggested by its higher five-year beta (1.10 vs. 1.03), but has grown sales at nearly double the annualized rate in the last five years (19.91% vs. 12.49%). Interestingly, while analysts estimate sales to drop to 19.01% for the next twelve months, SPY’s growth is estimated to accelerate from 12.49% to 14.10%. The tech-heavy Nasdaq-100 ETF has a better forward EPS growth rate, though some may find the 3.97% difference negligible. QQQ also has an edge in net income margins and profitability, but the differences are minor.
QQQ continues to trade at a fairly steep premium. When I reviewed the fund three months ago, QQQ’s forward P/E premium was about the same at 6.13x (35.37 vs. 29.24), but its forward EPS growth was 6.82% higher (24.66% vs. 17.84%). The reason for the gap closing is linked to S&P 500 bank stocks, and the higher profits analysts expect due to rising interest rates.
By Company
Here’s a more detailed look at QQQ’s top 20 companies. I’ve included the same growth and valuation metrics but added some additional ones on recent price performance, last quarter’s revenue surprises, and Seeking Alpha’s EPS Revision Grades.
Author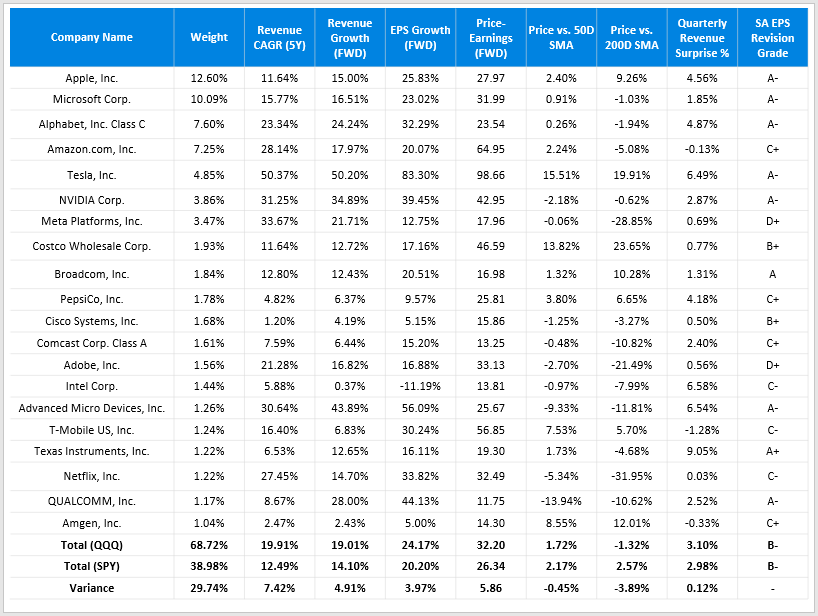
These additional data suggest QQQ had similar earnings results to SPY last quarter, and analysts have no preference, as indicated by the identical EPS Revisions Scores. The only real issue is valuation, so let’s look closer at four companies QQQ overweights:
- Apple: 5.59%
- Microsoft: 4.15%
- Amazon: 3.63%
- Alphabet: 3.46%
Apple
Apple is expected to report earnings after the close on or around April 28, 2022, with analysts expecting $94.10 billion in revenue and normalized EPS of $1.44. It’s one mega-cap stock where I’m not concerned about its valuation, which is 27.97x forward earnings. It continues to beat earnings expectations every single time despite analysts’ boosted earnings targets. Out of 28 analysts Seeking Alpha tracks, 27 revised earnings targets upward, earning the company an A- EPS Revisions Grade.
Seeking Alpha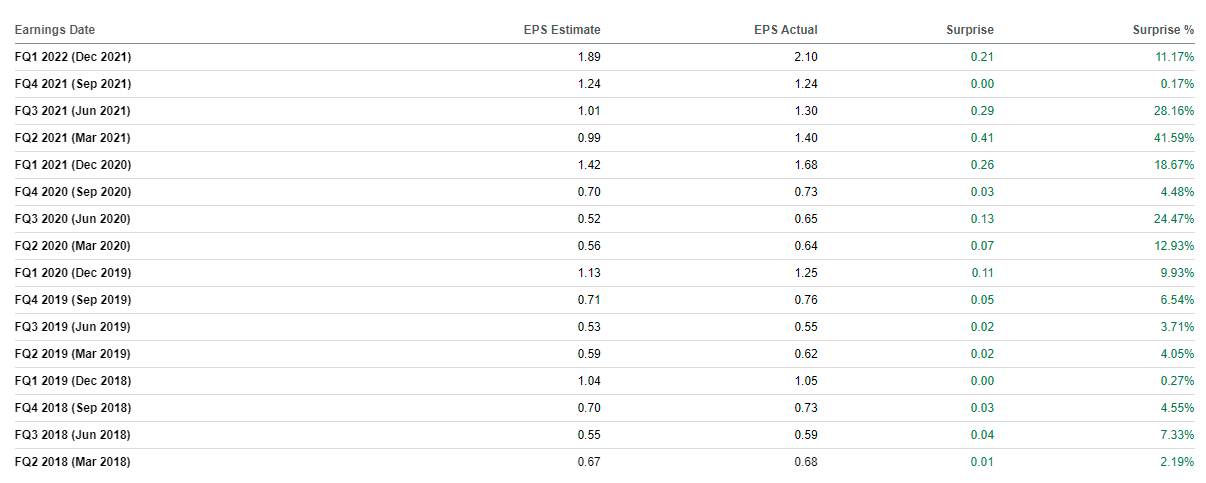
In my view, these results are a big reason why Apple’s stock continues to soar. Since it reported earnings on January 27, 2022, its price has increased by over 8%, nearly double that of SPY. I’ll continue to look to Apple to set the tone for this earnings season, especially since aggregate S&P 500 earnings surprises have trended downward for three consecutive quarters. On a historical basis, Q4 revenue surprises remain elevated at 2.50% compared to the ten-year average of about 1%. However, the Q4 earnings surprise of 5.80% is in line with pre-pandemic levels. The downward trend is consistent with recent weak market returns, and a poor earnings season could act as a catalyst to push both Indexes into correction territory.
Chart: Author, Source: Yardeni Research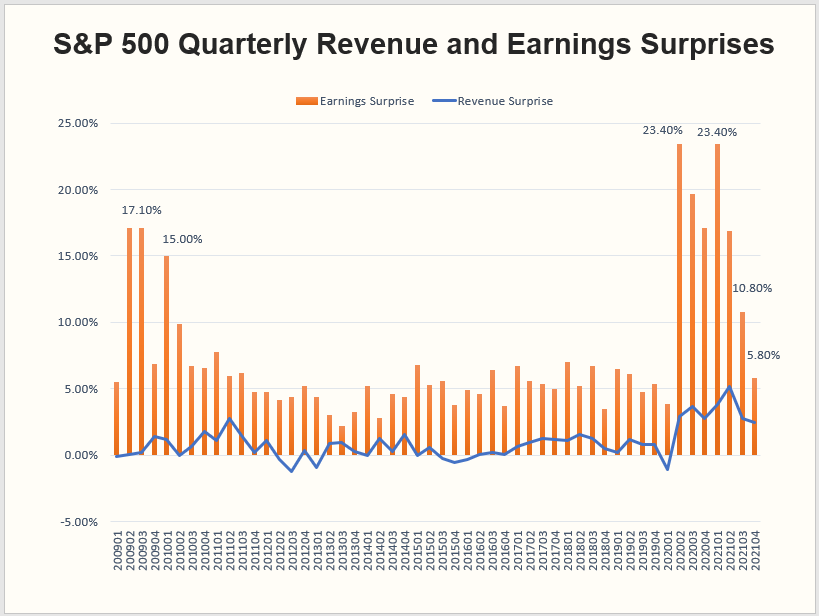
Microsoft
Microsoft is also set to report earnings on or around April 28, 2022. Like Apple, Microsoft has a strong history of beating analyst estimates:
Seeking Alpha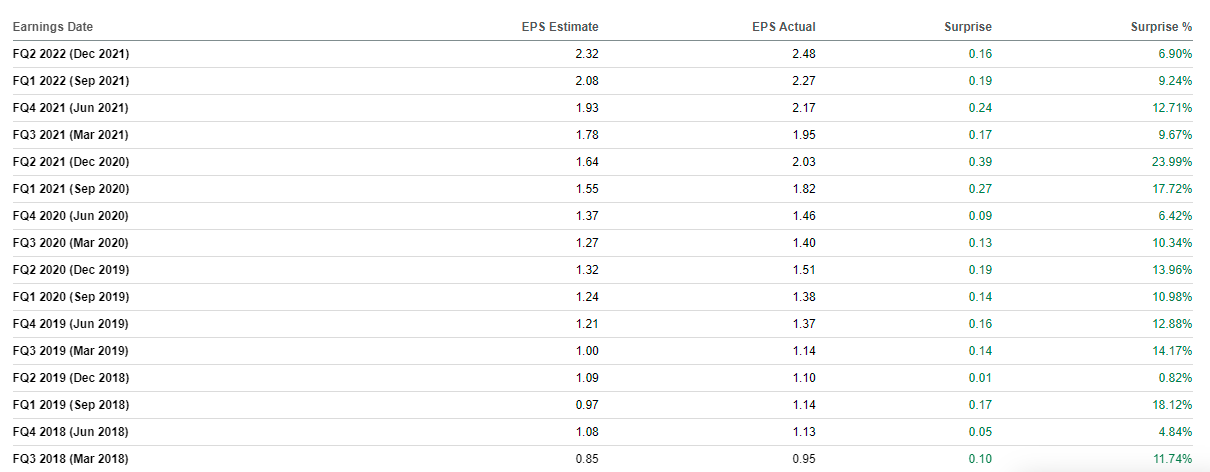
However, expectations are mixed this quarter, with only 16 / 28 analysts revising EPS estimates upward. This may be why the stock continues to trade near its 200-day moving average price. Microsoft has a trailing and forward P/E ratio of 33.98 and 31.99, which is average for the last five years. Analysts expect $49.04 billion in revenue this quarter and a normalized EPS of $2.19.
Alphabet
Alphabet is another excellent long-term stock, and its relatively low forward P/E ratio of 23.54 suggests it’s not as vulnerable to the growth-to-value rotation as its peers. That’s a key consideration given recent trends. From my monthly dividend ETF report, the table below shows how median returns for large-cap growth ETFs have substantially trailed large-cap value ETFs in the last six months. In my view, Alphabet is a great growth-at-a-reasonable-price stock, with a forward PEG ratio of 1.23. Overweighting stocks like these may be wise for those reluctant to give up on growth just yet.
Author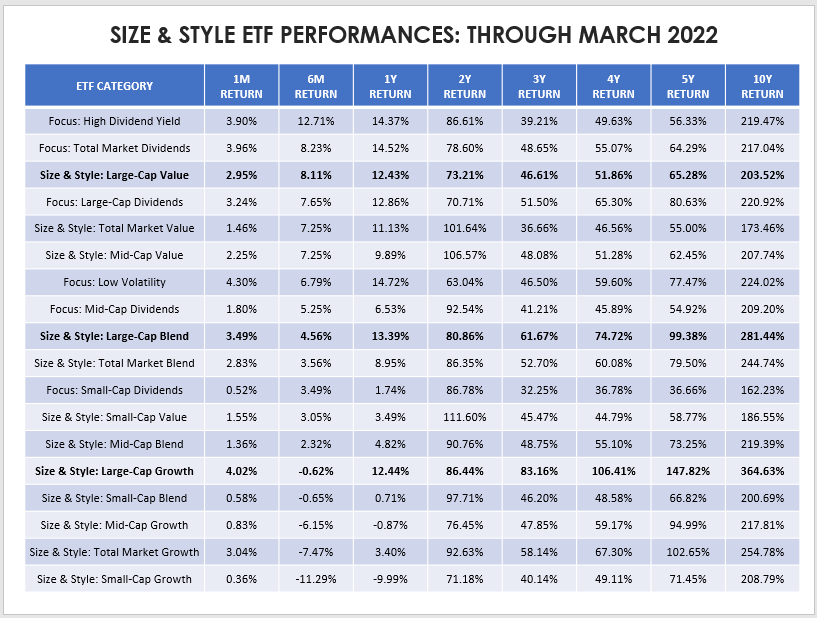
In addition, Alphabet has a solid earnings and revenue surprise history. Analysts expect revenue of $67.90 billion and EPS of $25.66 when they report on or around April 26, 2022, and 15 / 17 analysts have revised EPS estimates upward in the last three months.
Seeking Alpha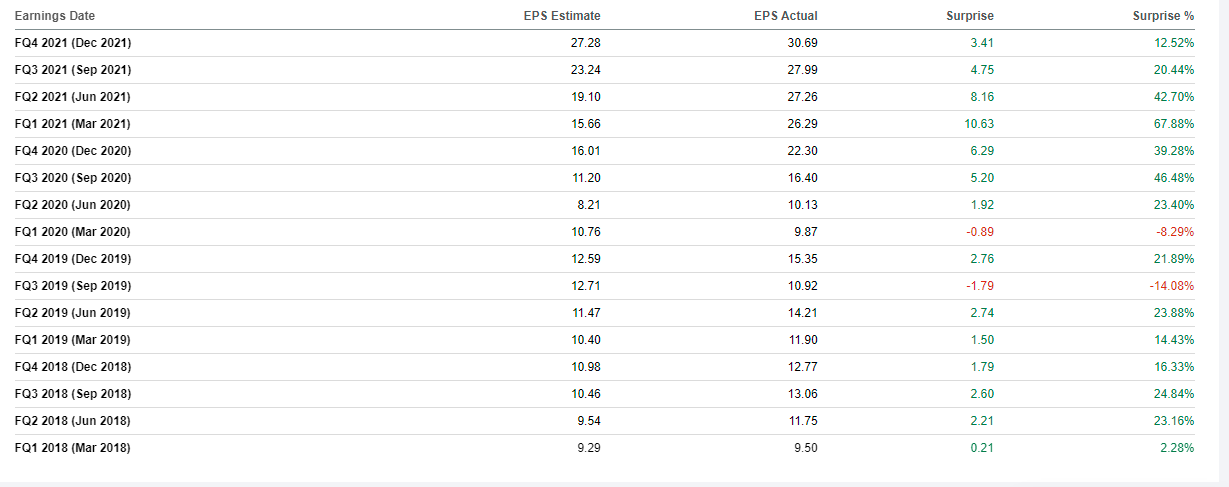
Amazon
While I believe Apple and Microsoft are excellent long-term holds, I’m less confident in Amazon. Its earnings surprise history is mixed, but more telling is that revenue surprises are down for three consecutive quarters.
Seeking Alpha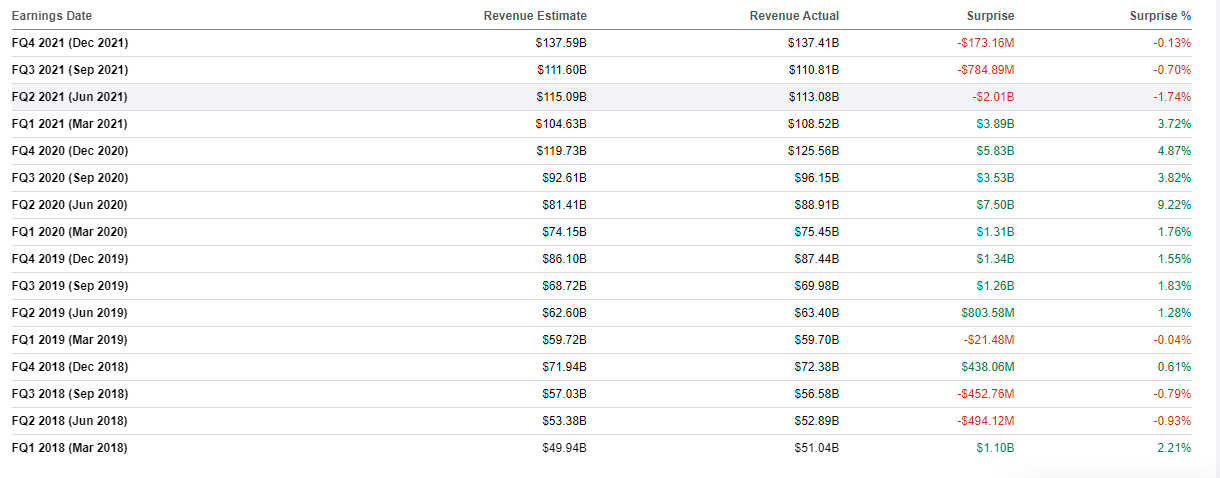
Since Amazon reported FQ2 2021 results on July 29, 2021, the stock has fallen 12.34% compared to 3.38% for QQQ and a gain of 1.84% for SPY.
Seeking Alpha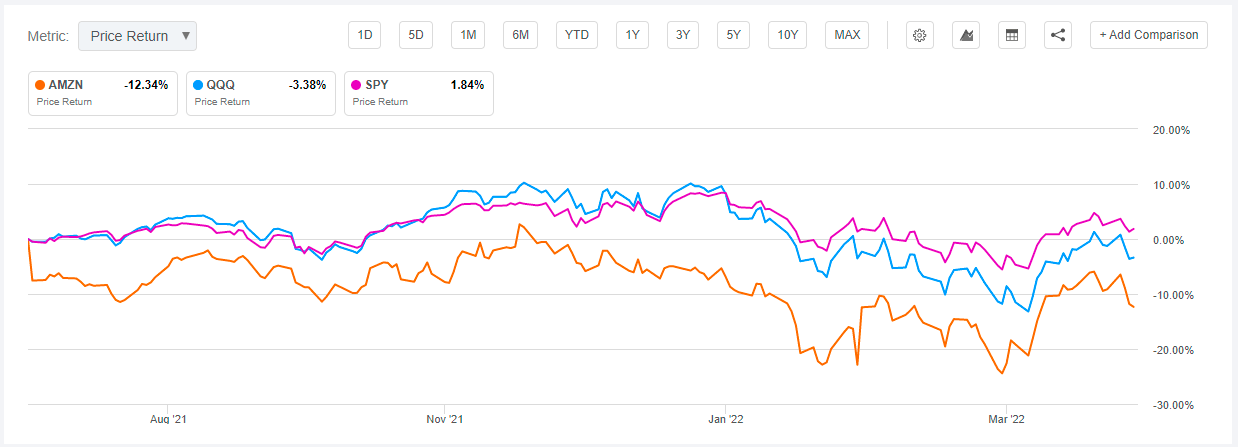
Negative surprises matter and can overshadow positive news throughout the quarter, like the 20-1 stock split and $10 billion share repurchase announcement (filing here) or the price hike on Amazon Prime memberships effective March 25, 2022. The elephant in the room is Amazon’s trailing and forward non-GAAP P/E ratio of 48.71 and 64.95, which has been on a steady decline recently. Analysts expect $116.44 billion in sales and EPS of $8.76, but notably, 19 / 25 have revised EPS expectations downward over the last three months. The stock remains a significant risk, and it’s prudent to minimize exposure until the trend reverses. Amazon is expected to report on or around April 28, 2022.
Seeking Alpha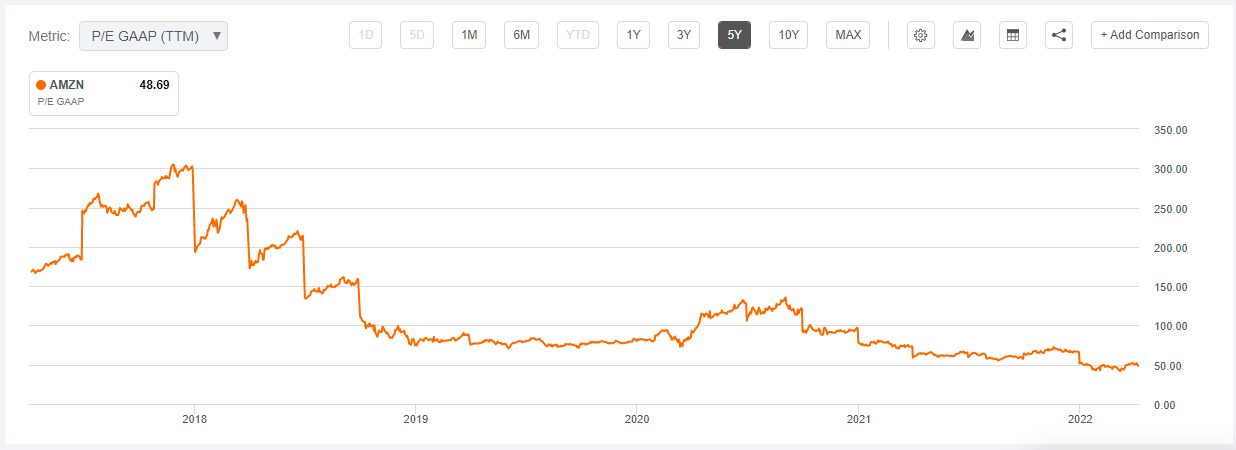
Investment Recommendation
QQQ investors have done well for themselves since the Great Financial Crisis, outperforming the S&P 500 on a rolling five-year basis without exception. Their outstanding profitability metrics have shined, and the mega-caps consistently delivered considerable returns, further fueling an expansion of their price multiples. However, the trend for large-cap growth stocks is negative, as is the direction in quarterly S&P 500 revenue and earnings surprises. Interest rates are rapidly rising, the Fed is determined to control inflation, and providers like Vanguard predict a decade of declines for U.S. growth stocks. It’s a lot to handle, and being asked to pay 32.20x forward earnings (six points higher than SPY) for what’s only a few extra percentage points in estimated growth isn’t reasonable.
In January, I suggested investors wait for the earnings season to pass before taking a position in QQQ. A drop materialized, and I hope you were able to take advantage. However, the valuation gap with SPY didn’t close, so my message this quarter is the same. QQQ is an excellent long-term holding, but over the next couple of months, it has way too much risk for only marginal reward compared to SPY. Keep your money in value- and blend ETFs for now, and I think your patience will be rewarded sooner rather than later.
Be the first to comment