

Eoneren
% Average annual total returns as of 9/30/2024
|
3Q24* (not annualized) |
YTD (not annualized) |
1 Year |
3 Years |
5 Years |
10 Years |
|
|
Institutional |
2.60% |
2.80% |
6.56% |
2.95% |
3.55% |
4.53% |
|
Investor A (Without Sales Charges) |
2.42% |
2.52% |
6.19% |
2.67% |
3.27% |
4.26% |
|
Investor A (With Sales Charges) |
-2.96% |
-2.86% |
0.62% |
0.84% |
2.16% |
3.69% |
|
ICEBofAML3-MoU.S. Treas Bill Index2 |
1.37% |
4.03% |
5.46% |
3.50% |
2.32% |
1.65% |
Performance data quoted represents past performance and is no guarantee of future results. Investment returns and principal values may fluctuate so that an investor’s shares, when redeemed, may be worth more or less than their original cost. All returns assume reinvestment of dividends and capital gains. Current performance may be lower or higher than that shown. Refer to Investment Management & Financial Services | BlackRock for most recent month-end performance.
Investment returns reflect total fund operating expenses, net of all fees, waivers and/or expense reimbursements. Expenses, as stated in the fund’s most recent prospectus, for Institutional/ Investor A shares: Total, 1.37%/1.60%;Net, Including Investment Related Expenses (dividend expense, interest expense, acquired fund fees and expenses and certain other fund expenses): 1.29%/1.51%. Institutional and Investor A have contractual waivers with an end date of 6/30/26 terminable upon 90 days’ notice. Index performance is shown for illustrative purposes only. It is not possible to invest directly in an unmanaged index. Share classes have different sales charges, fees and other features. Returns with sales charge reflect deduction of current maximum initial sales charge of 5.25% for Investor A shares. Institutional shares have no front or back-end load. Institutional shares have limited availability and may be purchased at various minimums. See prospectus for details.
The fund’s returns prior to May 8, 2015 are the returns of the fund when it followed different investment strategies under the name “BlackRock Large Cap Core Plus Fund,” which focused on establishing long and short positions in a diversified portfolio of equity securities issued primarily by large cap companies located in the United States.
Performance: The Fund was up over the quarter with hard catalyst, soft catalyst, and credit investments all contributing to returns. Merger spreads generally tightened during the period, but moves were largely driven by deal-specific events or concerns. Broadening investor focus beyond the Magnificent Seven supported idiosyncratic catalysts in some of the portfolio’s key soft catalyst positions. After materially growing the credit book over the past year, performance was primarily driven by selective situations oriented towards high-quality, modest-duration, and catalyst-rich credits.
Positioning: The Fund remains well-diversified with 74 investments across the spectrum of corporate events. Fund LMV deployed in hard catalyst investments increased modestly throughout the quarter as capital deployed into new investments and incremental additions to high-conviction positions outpaced the capital returned from the completion of several other transactions the Fund had investments in. Additionally, the Fund’s exposure to soft catalyst and credit investments also increased moderately over the quarter.
Based on performance since strategy inception (5/8/15) through 9/30/2024. Highlighted periods deemed periods of “market stress,” defined by a three-month period where the S&P 500 had a peak to trough drawdown of 5% or more. Performance shown is gross of fees and expenses. Institutional shares may not be available to all investors.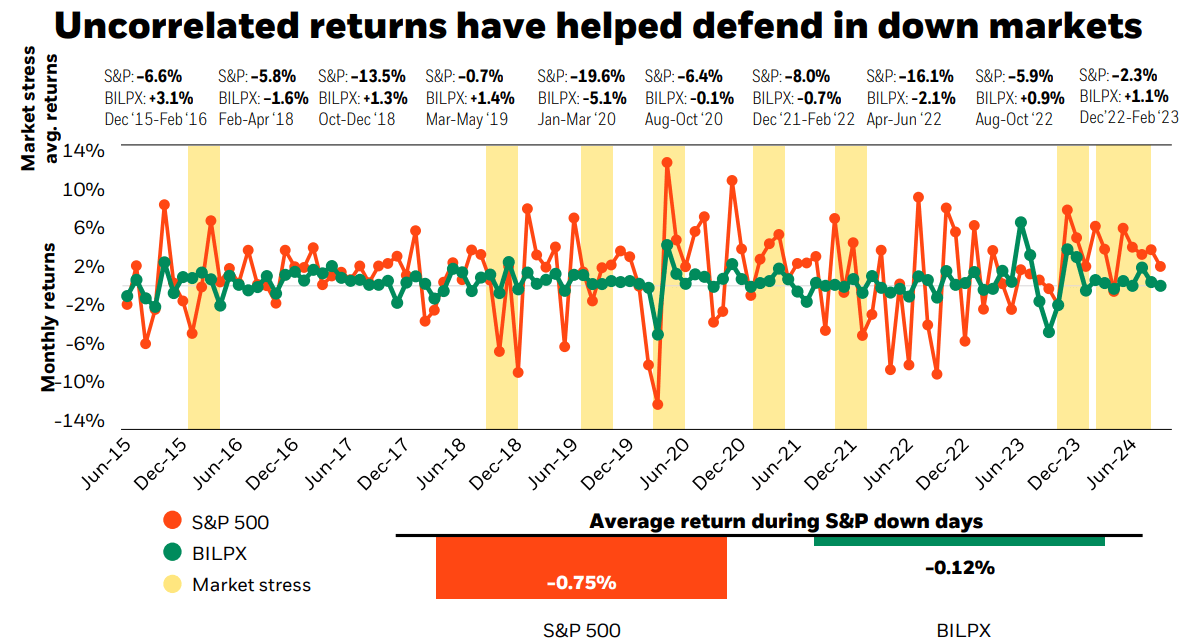
Performance data quoted represents past performance and is no guarantee of future results. Investment returns and principal values may fluctuate so that an investor’s shares, when redeemed, may be worth more or less than their original cost. All returns assume reinvestment of dividends and capital gains. Current performance may be lower or higher than that shown. Refer to Investment Management & Financial Services | BlackRock for most recent month-end performance.
BILPX rated against 45 Event Driven Funds as of 9/30/2024, based on risk-adjusted total return. Ratings are determined monthly and subject to change. The Overall Morningstar Rating for a fund is derived from a weighted average of the performance figures associated with its 3-, 5-, and 10-year (if applicable) Morningstar Rating metrics.1
Transformative corporate events create opportunities
The fund invests in companies that have announced or are expected to undergo material change – catalysts that will impact their stock prices.
Performance driven by event outcomes, not markets
In event driven investing, individual event outcomes drive returns. These “idiosyncratic” results offer a diversifying return stream de-coupled from broad market performance and volatility.
Attractive performance with low volatility
|
Summary performance and risk statistics** |
|
|
Performance (MUTF:BILPX) |
5.13% |
|
Annualized volatility |
4.1% |
|
Realized beta† to S&P 500 |
0.19 |
* * Since strategy inception (5/8/15) to 09/30/24. Past performance is not a guarantee of future performance. Institutional shares may not be available to all investors. Volatility based on standard deviation of monthly returns 6/1/15 to 09/30/24.† Beta is the measure of the volatility, or systematic (market-related) risk, of a portfolio as compared to the overall market. The lower the beta, the lower the market risk (volatility).
|
Current event backdrop Key factors point to an environment for sustained opportunity |
|
Strong backlog of pent-up demand for corporate change after years of diminished M&A volume |
Dynamic credit opportunities with both treasuries and spreads at attractive levels |
|
Mergers spreads offering attractive yields in comparison to historical norms |
Elevated number of companies deconstructing themselves via spin-offs, split-offs, and organizational restructurings |
Performance attribution
Contributors
Soft catalyst positioning in Arconic was the largest contributor in the third quarter and YTD as anchor position, Howmet (HWM), continued its strong trajectory, driven by management-led turnaround. This was further bolstered by several developments, including top line acceleration, improved content from recent share gain, strong margin enhancement, an upgrade to an IG credit rating, enhanced capital return across share repurchase and debt paydown. Soft catalyst positioning in the Danaher (DHR) constellation of assets also contributed to performance as anchor positions Danaher, Envista (NVST) (dental spin-off), and Veralto (VLTO)(water / product quality spin-off) each benefitted returns over the quarter. Lastly, a hard catalyst investment in Tapestry (TPR)/ Capri (CPRI) benefitted performance as the market ascribed a higher likelihood the companies would prevail over the FTC’s case in court.
Detractors
Hard catalyst positioning in Nippon Steel (OTCPK:NISTF)(OTCPK:NPSCY) / United States Steel (X) was the largest detractor from performance during the quarter due to continued concerns over political opposition of the deal despite U.S. Steel’s arbitration win with the USW and CFIUS allowing the companies to refile. A soft catalyst investment in Managed Healthcare also detracted from performance as the market weighed a post-election outlook. Lastly, a hard catalyst investment in Chevron (CVX) / Hess (HES) detracted from returns as the parties disclosed that the arbitration hearing with Exxon Mobil (Exxon) (XOM) is scheduled to occur in May of 2025, significantly later than the parties’ previous guidance, and thus delaying the closing of the transaction beyond expectations. Separately, Exxon has asserted a right of first refusal on Hess’ valuable ownership stake in the Stabroek Block off the coast of Guyana that Chevron and Hess believe is without merit, and they will not close the transaction until it is confirmed inapplicable.
Top 10 equity holdings (Long % of NAV)
The fund makes long and short investments in developed market companies across market capitalizations and sectors.
|
1 |
IPOs |
3.8% |
|
2 |
Chevron / Hess |
3.8% |
|
3 |
Managed Healthcare |
2.9% |
|
4 |
Danaher (DHR) |
2.9% |
|
5 |
2.9% |
|
|
6 |
Novo Nordisk (NVO)(OTCPK:NONOF) / Catalent (CTLT) |
2.7% |
|
7 |
Arconic |
2.6% |
|
8 |
Aerospace Transformations |
2.3% |
|
9 |
DowDuPont |
2.2% |
|
10 |
Waste Management (WM) / Stericycle (SRCL) |
2.1% |
|
Important Risks: The fund is actively managed and its characteristics will vary. Holdings shown should not be deemed as a recommendation to buy or sell securities. Stock and bond values fluctuate in price so the value of investments can go down depending on market conditions. Event driven strategies entail investing in companies involved, or potentially involved, in significant corporate actions. Success of event driven trading depends on successful prediction of whether various catalyst events will in fact occur or be finalized. Change in status or delay of events may affect the price of securities purchased and result in losses to the fund. The fund may use derivatives to hedge its investments or to seek to enhance returns. Derivatives entail risks relating to liquidity, leverage and credit that may reduce returns and increase volatility. Compared to a traditional long only portfolio, the potential for volatility (compared to the market and the fund’s benchmark) can be greater given the fund’s additional long exposure along with its short exposure. Short selling entails special risks. If the fund makes short sales in securities that increase in value, the fund will lose value. Any loss on short positions may or may not be offset by investing short sale proceeds in other investments. Investing in alternative strategies such as a long/short strategy, presents the opportunity for significant losses, including the loss of your total investment. *Performance for periods of less than one year is not annualized. 1 The Morningstar Rating for funds, or “star rating”, is calculated for managed products (including mutual funds, variable annuity and variable life sub-accounts, exchange-traded funds, closed-end funds, and separate accounts) with at least a three-year history. Exchange-traded funds and open-ended mutual funds are considered a single population for comparative purposes. It is calculated based on a Morningstar Risk-Adjusted Return measure that accounts for variation in a managed product’s monthly excess performance, placing more emphasis on downward variations and rewarding consistent performance. The top 10% of products in each product category receive 5 stars, the next 22.5% receive 4 stars, the next 35% receive 3 stars, the next 22.5% receive 2 stars, and the bottom 10% receive 1 star. The Overall Morningstar Rating for a managed product is derived from a weighted average of the performance figures associated with its three-, five-, and 10-year (if applicable) Morningstar Rating metrics. The weights are: 100% three-year rating for 36-59 months of total returns, 60% five-year rating/40% three-year rating for 60-119 months of total returns, and 50% 10-year rating/30% five-year rating/20% three-year rating for 120 or more months of total returns. While the 10-year overall star rating formula seems to give the most weight to the 10-year period, the most recent three-year period actually has the greatest impact because it is included in all three rating periods. The fund was rated against the following numbers of U.S.-domiciled funds: 45, 41 and 32, over the 3-, 5-and 10-year periods, respectively. With respect to these Event Driven funds, the fund received a Morningstar Rating of 4, 3 and 4 stars for the 3-, 5-and 10-year periods, respectively. Other classes may have different performance characteristics. 2 The ICE BofAML 3-Month U.S. Treasury Bill Index is an unmanaged market index of U.S. Treasury securities maturing in 90 days that assumes reinvestment of all income. The opinions expressed are those of the fund’s portfolio management team as of 09/30/2024 and may change as subsequent conditions vary. Information and opinions are derived from proprietary and non-proprietary sources deemed by BlackRock to be reliable, are not necessarily all-inclusive and are not guaranteed as to accuracy. Past performance is no guarantee of future results. There is no guarantee that any of these views will come to pass. This material does not constitute investment advice and is not intended as an endorsement of any specific investment. Investment involves risk. Reliance upon information in this material is at the sole discretion of the reader. BlackRock provides compensation in connection with obtaining or using third-party ratings and rankings. You should consider the investment objectives, risks, charges and expenses of the fund carefully before investing. The prospectus and, if available, the summary prospectus contain this and other information about the fund and are available, along with information on other BlackRock funds, by calling 800-882-0052 or from your financial professional. The prospectus should be read carefully before investing.©2024 BlackRock, Inc. or its affiliates. All Rights Reserved. BLACKROCK is a trademark of BlackRock, Inc. or its affiliates. All other trademarks are those of their respective owners. Prepared by BlackRock Investments, LLC, member FINRA. Not FDIC Insured • May Lose Value • No Bank Guarantee |
Be the first to comment