

golfcphoto
Written by Nick Ackerman, co-produced by Stanford Chemist. This article was originally published to members of the CEF/ETF Income Laboratory on October 16th, 2022.
BlackRock Enhanced Capital And Income Fund (NYSE:CII) continues providing steady distributions to investors monthly. The call writing strategy it employs on its underlying holdings has helped this fund in two ways. It has helped generate capital gains to offset declines, and it provides capital to pay out the distribution.
At this point, they’ve realized enough gains to cover their distribution and more. Combining that with a reasonable NAV distribution yield, the fund looks set to continue paying the same payout for the time being. That’s something that not every equity fund can say in this bear market.
The Basics
- 1-Year Z-score: -1.14
- Discount: 4.49%
- Distribution Yield: 7.19%
- Expense Ratio: 0.9%
- Leverage: N/A
- Managed Assets: $767.5 million
- Structure: Perpetual
CII has a simple objective and strategy; it “seeks to provide investors with a combination of current income and capital appreciation” by “investing in a portfolio of equity securities of the U.S. and foreign issuers.” They will also “employ a strategy of writing call and put options.”
This type of flexibility allows them to really invest wherever they’d like. However, the portfolio tends to overweight the large and mega-cap tech names. That is pretty standard for most straightforward equity funds.
However, CII will also write calls on the underlying positions. They have a soft target of overwriting 30 to 40% of their portfolio. With the current overwritten portion at 50.46%, they are beyond the upper range. This could be suggesting they are being quite bearish. At this point, being more bearish has definitely paid off.
The overwritten portion at this higher level matters because they can collect more premiums from the additional options they are writing. On the other hand, if the market starts to rip higher – these positions will either be closed, or the underlying position will be called away if the market runs up too high too fast. Either way that would limit the upside and potentially reduce the premium they collected to close out the calls.
In this volatile market, it certainly could be the case. We saw how things rose quite rapidly through the summer. In hindsight, all these gains were given back, but that might not be the case at some point.
On the other hand, there is quite a bit of thinking that we could be in for a flat market once interest rates stabilize. A call writing strategy can also be beneficial if rates stabilize and the market moves sideways. Rates stabilizing will only seem to happen if inflation declines.
Performance – Remaining Slightly Defensive
Previously we noted how this fund was holding up better than the broader indexes. This remains to be the case since we last covered the fund on a total return basis. Unfortunately, it was still a loss during this period, regardless. That last update was on June 24th, 2022. So it participated in the July rebound, then dropped to new lows.
CII Performance Since Previous Update (Seeking Alpha)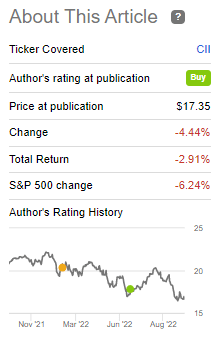
Here’s what the YTD performance looks like as we progress through the year. Since SPY doesn’t utilize an option writing strategy, it isn’t exactly a benchmark. What it is, though, is a great way to provide a context of the moves for CII.
Ycharts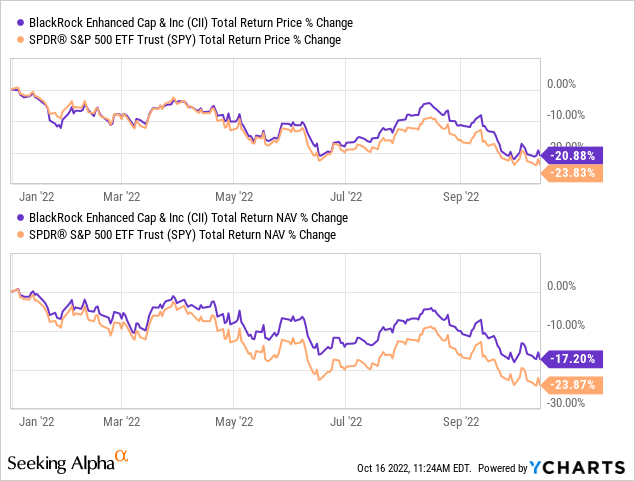
At this time, the discount is a bit wider than when we previously touched on the fund too. We are now getting closer to its longer-term average discount level, which can make it more attractive based on the valuation. However, it is still above the average level.
Ycharts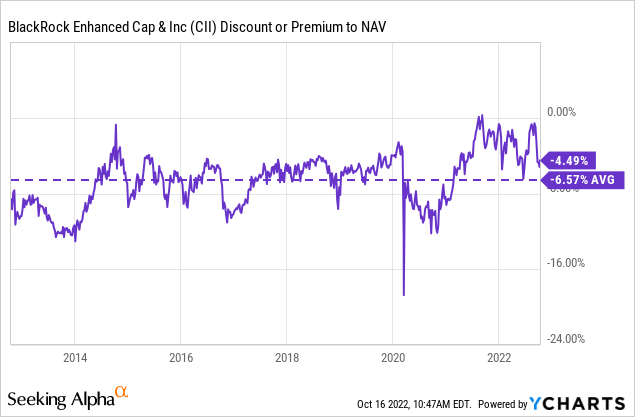
I would also consider how much valuations have come down across the board again. Below is the S&P 500 P/E chart. We are still above the median of 14.90 and the mean of 15.98.
S&P 500 Earnings Expectations (multipl.com)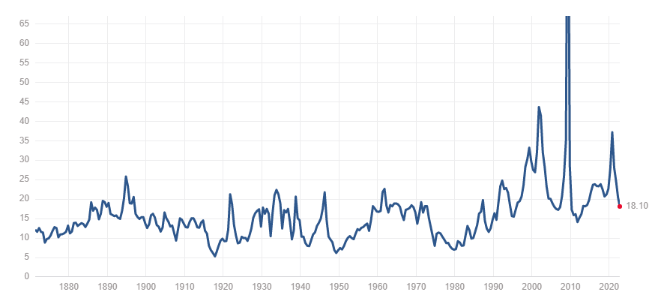
The other part is that if the “E” starts declining materially, that is something to watch. Of course, that’s exactly what is expected to happen when/if we hit an actual recession in 2023. For now, the forward earnings of the S&P 500 are expected to continue climbing.
Ycharts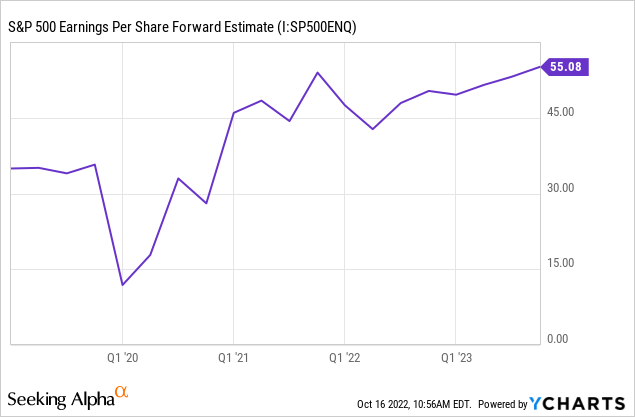
This remains relevant for CII because CII is essentially a basket of holdings with similar weightings to the S&P 500. Not exactly a mirror, but we will touch on that more below. Then they slap a call writing strategy on it to further differentiate the fund. The overwhelming majority of the portfolio is invested in large caps and U.S.-based companies.
Distributions – Attractive And Sustainable
The current distribution rate of CII is 7.19%. The NAV distribution rate comes to a reasonable 6.87% level. They cut their quarterly distribution several times after the GFC. They then trimmed it sometime around 2016 too. Since then, they’ve raised it three times, but it has been relatively conservative in the CEF space.
CII Distribution History (CEFConnect)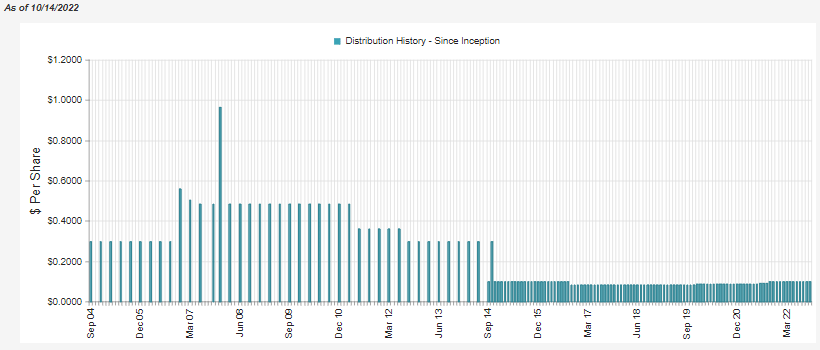
What made them conservative previously also now makes them more sustainable at this time. They are still below their longer-running average distribution yield, even after the declines this year.
Ycharts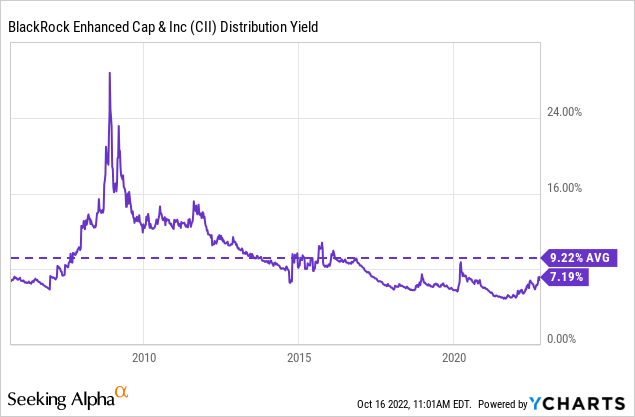
They’ve also covered their payout via realized capital gains in the first six months of this fiscal year. Of course, we’ve seen losses in the NAV YTD anyway due to the unrealized losses on the portfolio.
CII Semi-Annual Report (BlackRock)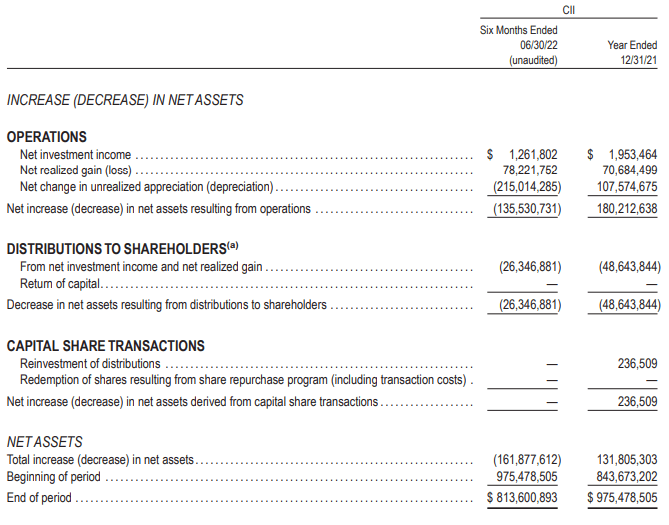
At this point, they’ve realized so much in gains that they might even be subject to a year-end special. At this point, it would likely come next year, as BlackRock has already announced its year-end specials. The only fund really getting a “special” is BlackRock Enhanced Equity Dividend Trust (BDJ). BlackRock Health Sciences Trust II (BMEZ) has announced they are paying “spillback” distributions too, but it is simply the normal monthly distribution amount at this point.
Therefore, CII could see a year-end special given their capital gains at this point, but if it does happen, it might not be until next year. However, they could announce more as we wind down closer to year-end too. Alternatively, they could have realized significant losses in the second half of the year, which would offset these realized gains.
To generate these realized gains, they had leaned into selling positions that still had appreciated previously. On top of this, they had a healthy portion of premiums generated from their written options. Note that they paid out roughly $26.35 million and earned $21.23 million in options premiums in the first six months. These are important to point out because these are gains that can be generated no matter what the market is doing.
CII Realized And Unrealized Gain Breakdown (BlackRock (highlights from author))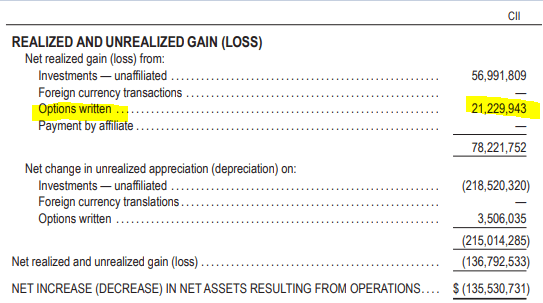
CII’s Portfolio
As I mentioned already, the fund is invested quite heavily in large caps and U.S.-based companies. So when it comes down to it, the portfolio is quite “boring.” That being said, they still have reported a fair bit of portfolio turnover. In the first six months, it came in at 14%. That would put it similar to last year’s 27% turnover rate if the trajectory holds through the second half of the year.
The limited exposure they carry to Europe on the western side of the continent, away from the more volatile eastern portion where Russia’s invasion is ongoing. This can be viewed as more neutral, considering the uncertainty on that side of the continent.
CII Geographic And Market Cap Info (BlackRock)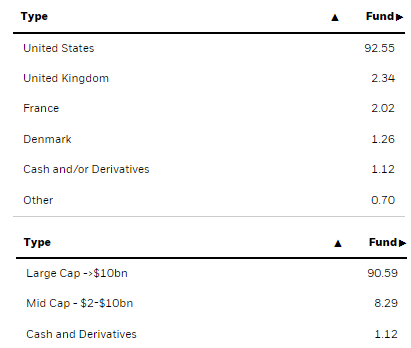
Additionally, the portfolio weighting shows how diversified the fund is. Holding the tech sector in the highest weighting isn’t too surprising when we look at the top holdings. These sorts of weightings reflect similarities to the S&P 500 overall.
However, tech made up 26.4% of the S&P 500 at the end of September 2022. That could have also been another reason CII is holding up better than the broader market.
CII Top Ten (BlackRock)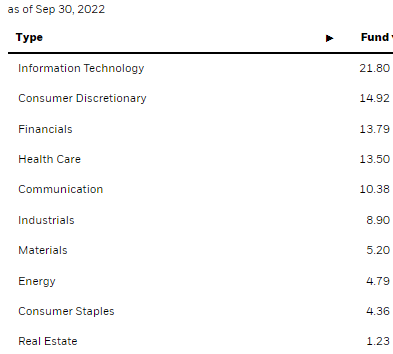
When looking at the fund’s top positions at the end of September, we see more similarities between this fund and the S&P 500. Mainly, we see that the mega-cap tech names make an appearance.
CII Top Ten (BlackRock)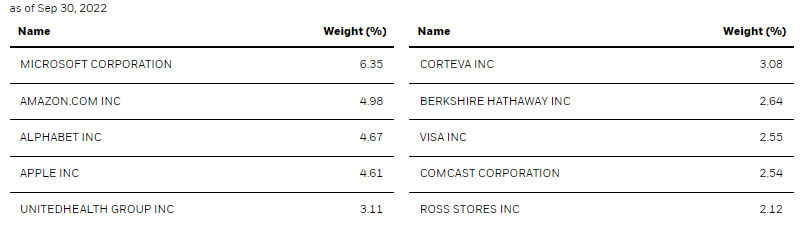
As usual for CEFs this year, Meta Platforms (META) has been removed or fallen so far that it doesn’t show up as a top holding anymore. At the end of June, they had held 85,039 shares valued at around $13.7 million. So it very well could still be a position.
Previously it was Netflix (NFLX) that was often left out of the top holdings list in CEFs that was generally associated with the mega-cap tech names. Considering the NFLX and META declines have been similar at this point, it would have been best to avoid META altogether. Of course, we only know that in hindsight now.
We still have Microsoft (MSFT), Amazon (AMZN), Alphabet (GOOG) and Apple (AAPL) making up the top positions. They contribute to a hefty 20.61% of the portfolio.
Here’s a look at the performance to put into perspective the declines between these tech behemoths (or what were once tech behemoths.) I’ll even include NFLX for fun, even though it was never a position for CII in the last few years.
Ycharts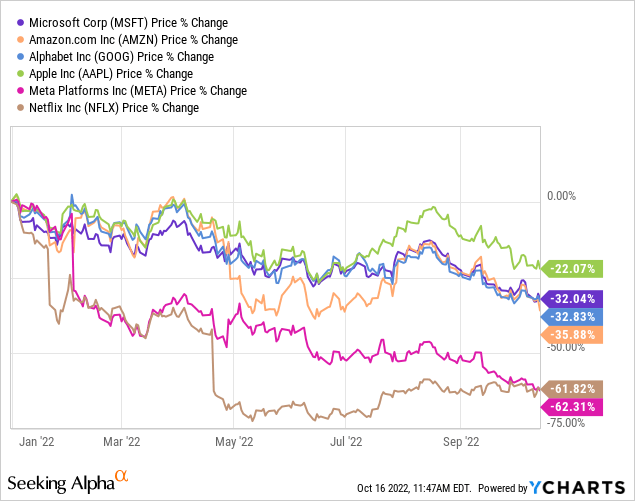
Conclusion
CII isn’t necessarily a screaming buy at this point, but I do find it fairly attractive, considering the overall declines and the discount opening up. Ideally, the discount would be even wider before getting even more excited. If we are in for a flat market over the coming years, CII could benefit from its option writing strategy. On the other hand, if we rip higher, it could leave this fund behind in terms of performance. Since the fund is positioned above their target of the portfolio overwritten portion, it seems that the managers are not worried about a rapidly rising market.
Be the first to comment