


Spencer Platt
The BlackRock Limited Duration Income Trust (NYSE:BLW) is a high yielding closed-end-fund (“CEF”) that has low average portfolio duration. Its main attraction is its 8.8% current distribution yield. However, like many CEFs I have analyzed, BLW pays more in distribution than it earns in income and capital appreciation. This leads to shrinking NAV and distributions over the long run.
Fund Overview
The BlackRock Limited Duration Income Trust is a closed-end fund (“CEF”) that seeks to provide current income and capital appreciation. The fund has almost $750 million in managed assets and trades at a 1.8% discount to NAV.
Strategy
The BLW fund seeks to achieve its investment objective by investing in intermediate duration, investment grade (“IG”) corporate bonds, mortgage-backed securities (“MBS”), asset-backed securities (“ABS”), and US Government and agency securities; senior secured floating rate loans; and US dollar-denominated non-investment grade high yield (“HY”) securities. The fund normally has an average portfolio duration of less than 5 years, and uses leverage to enhance returns.
Portfolio Holdings
The BLW fund’s portfolio has an effective duration of 3.5 years and is 27% levered as of October 31, 2022 (Figure 1).
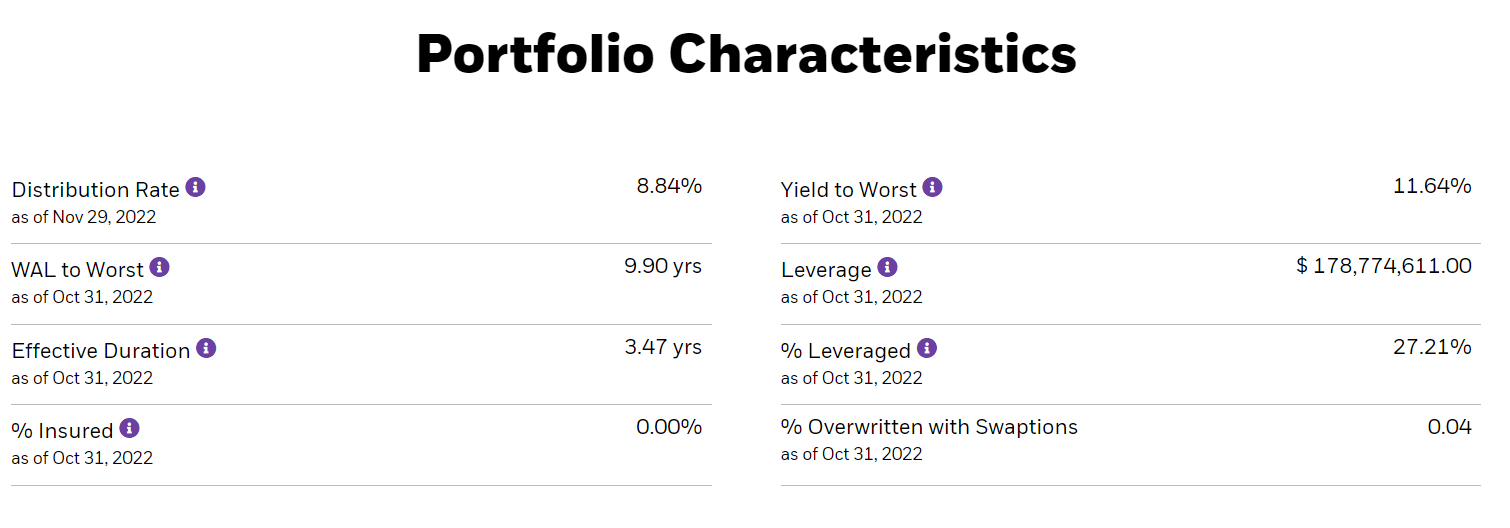
Figure 1 – BLW portfolio characteristic (blackrock.com)
Figure 2 shows BLW’s credit quality distribution. BLW’s portfolio has 23% of assets invested in IG credits and the rest are non investment grade.
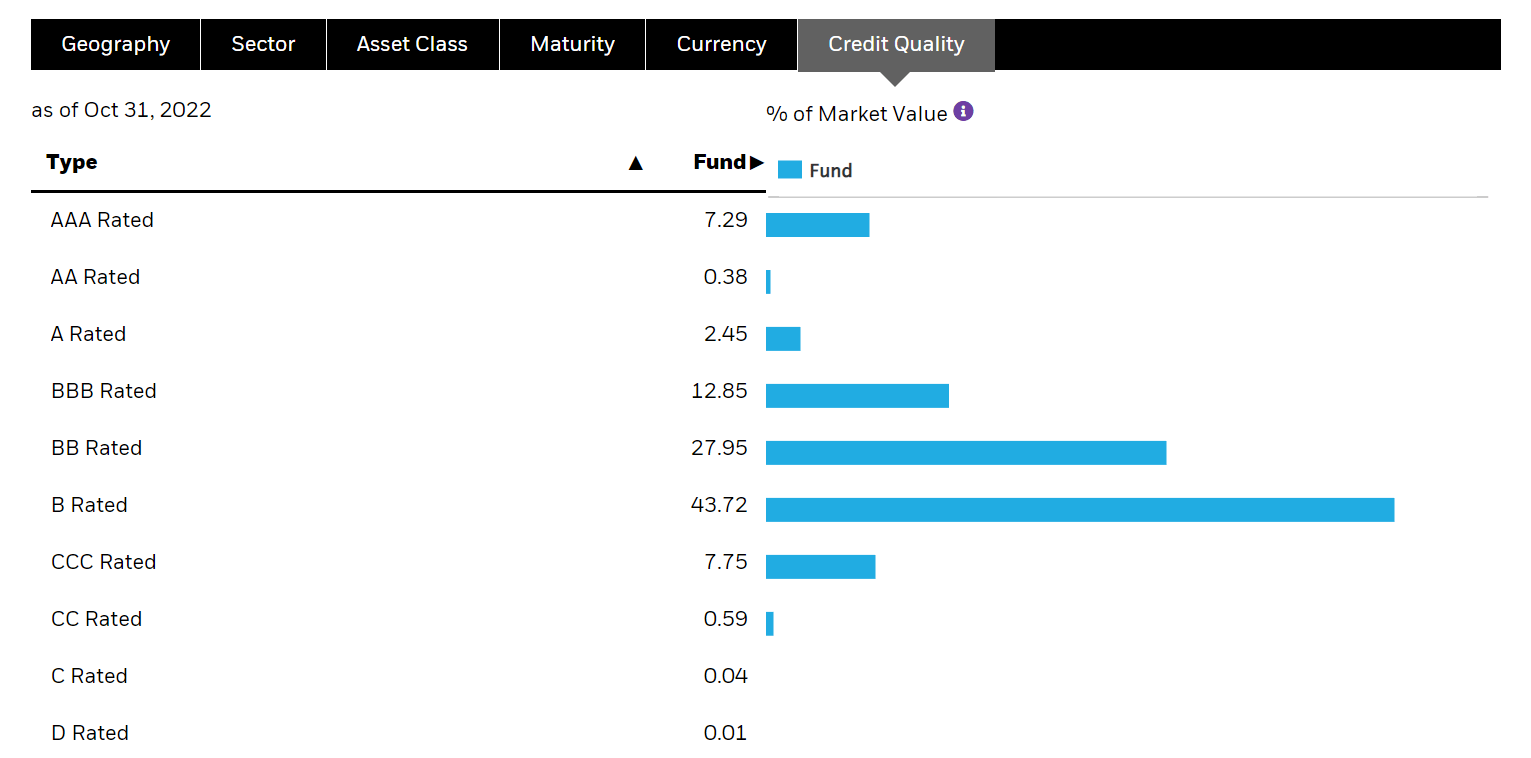
Figure 2 – BLW credit distribution (blackrock.com)
Although the average portfolio duration is 3.5 years, the BLW fund actually owns quite a bit of assets with long maturities, with over 55% of assets having maturity greater than 5 years, including over 10% with 10 year or more maturity (Figure 3).
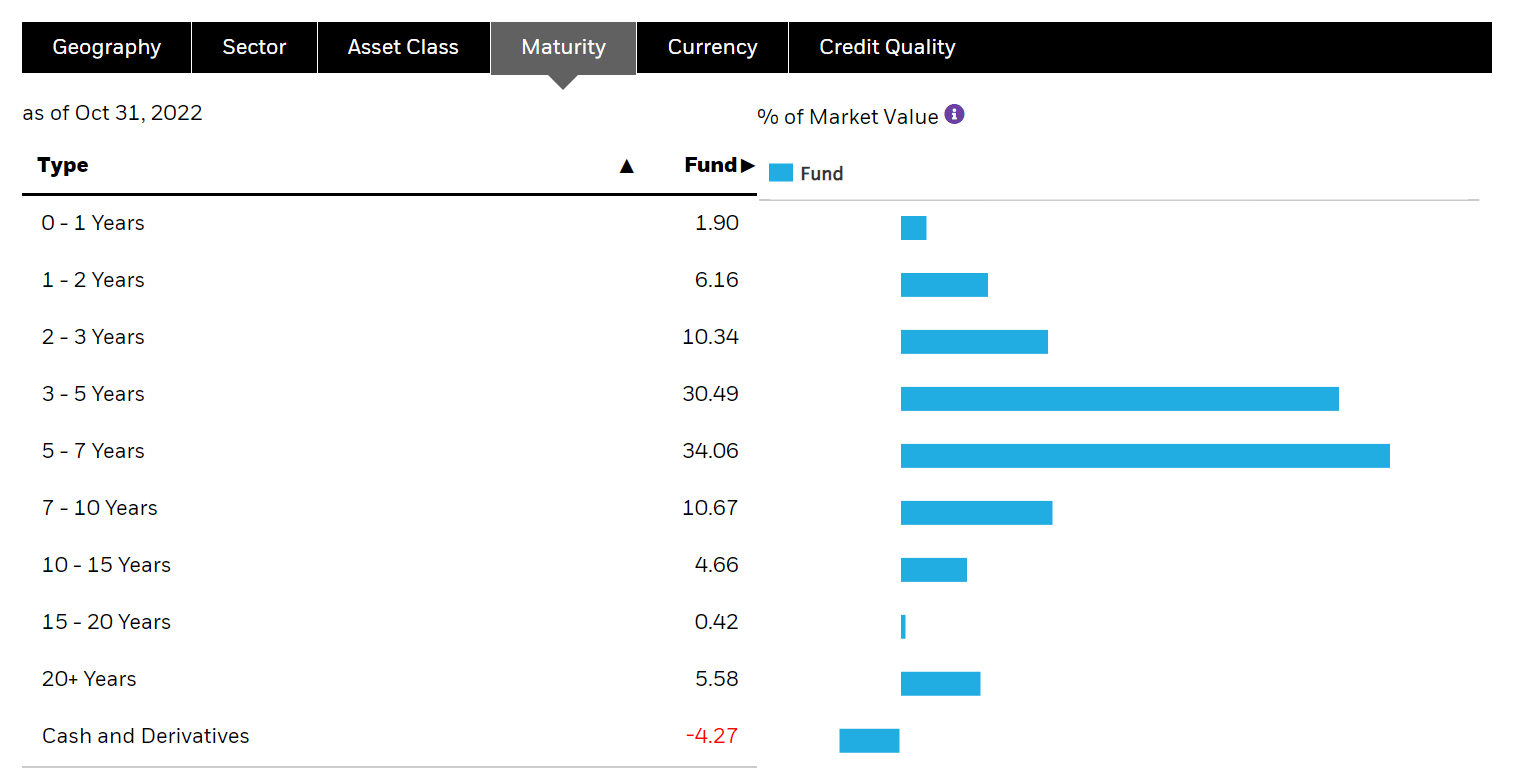
Figure 3 – BLW maturity distribution (blackrock.com)
BLW’s assets with long duration and non-investment grade credits is the primary reason why performance has been poor in 2022, as long-term interest rates have increased and high yield spreads have widened.
Returns
BLW has generated modest historical returns, with 5 and 10 Yr average annual total returns of 2.3% and 5.0% respectively to October 31, 2022 (Figure 4). 2022 has been a bad year, with the fund returning -13.4% YTD.

Figure 4 – BLW returns (blackrock.com)
2022 would actually be the fund’s worst annual performance in the past decade. Before 2022, the only down year for BLW was 2018 at -2.5% of NAV (Figure 5).
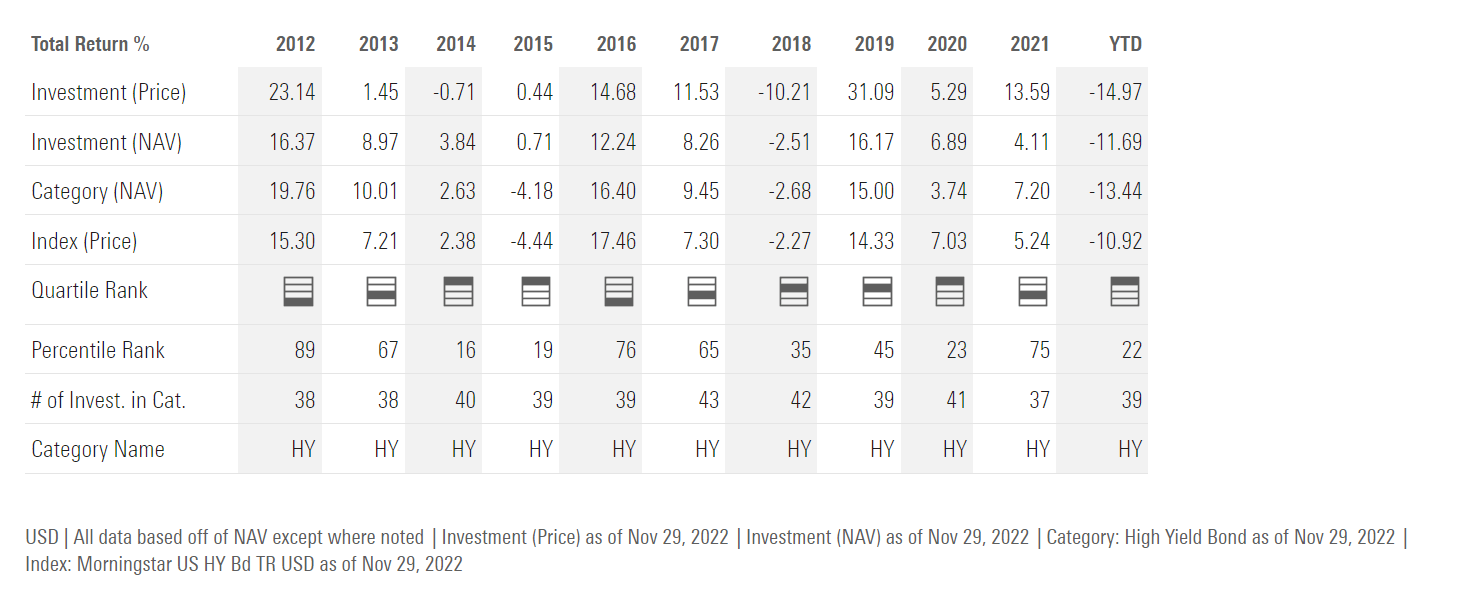
Figure 5 – BLW annual returns (morningstar.com)
Distribution & Yield
BLW’s main selling point is its high distribution yield. The fund has paid a monthly $0.0981 / share since early 2020, which annualizes to an 8.8% yield on market price or 8.7% on NAV (Figure 6).

Figure 6 – BLW distribution (Seeking Alpha)
On word of caution on BLW’s distribution. As shown in Figure 7 below, BLW’s distribution is not entirely covered by its net investment income (“NII”) so the fund has had to use return of capital (“ROC”) to fund a small portion of the distribution (Figure 7).
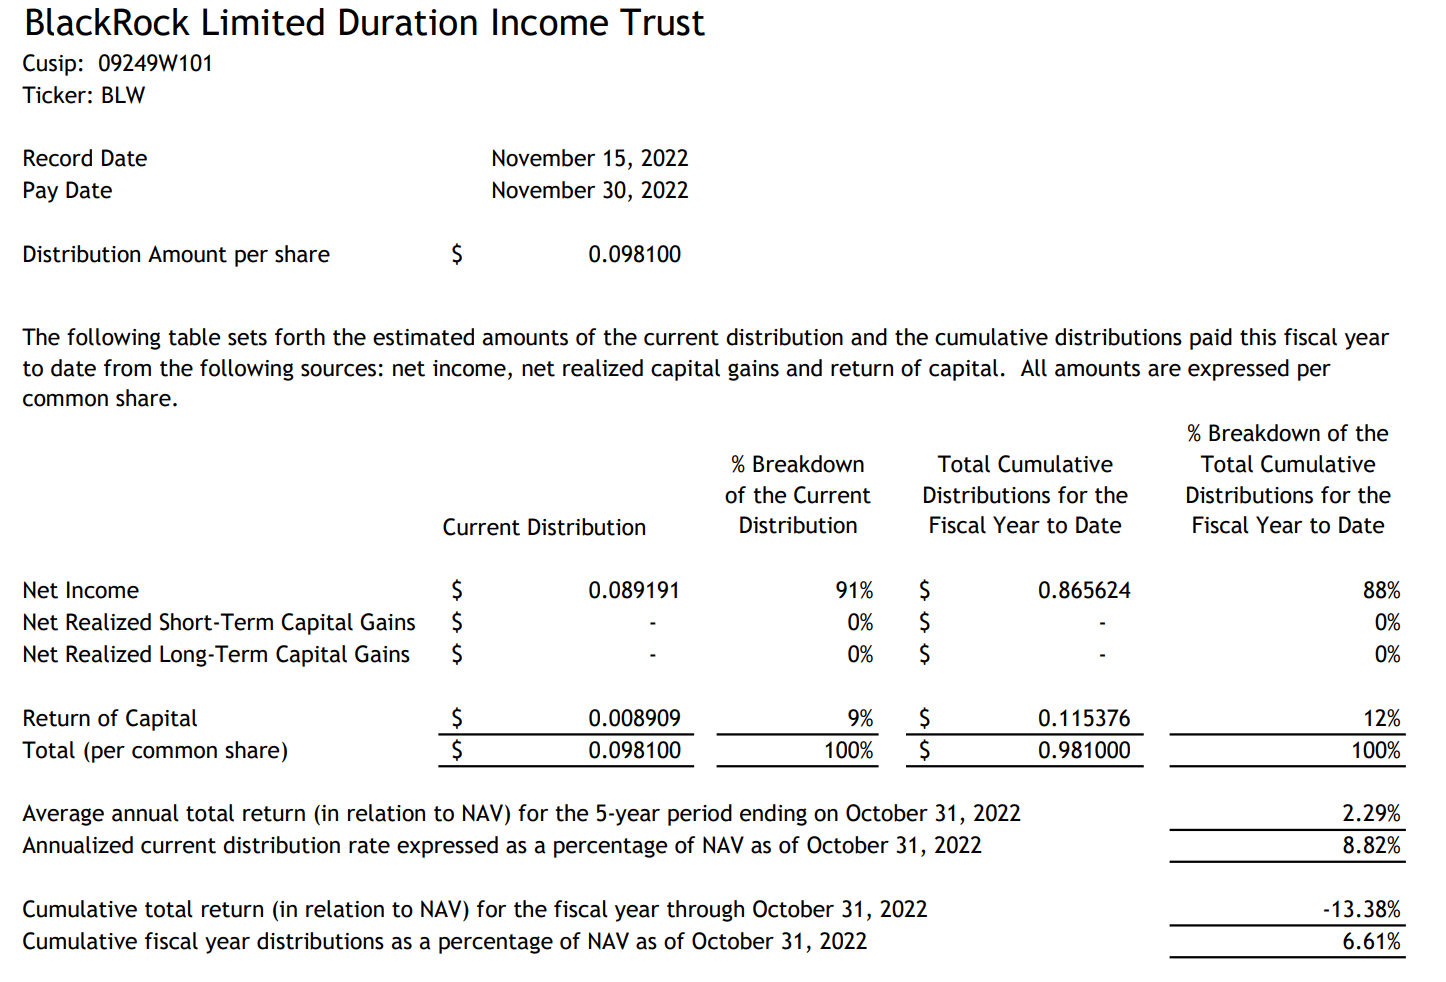
Figure 7 – BLW section 19 notice (blackrock.com)
Fees
BLW charges a 0.79% gross expense ratio on managed assets, which translates to 1.18% on net assets (Figure 8).
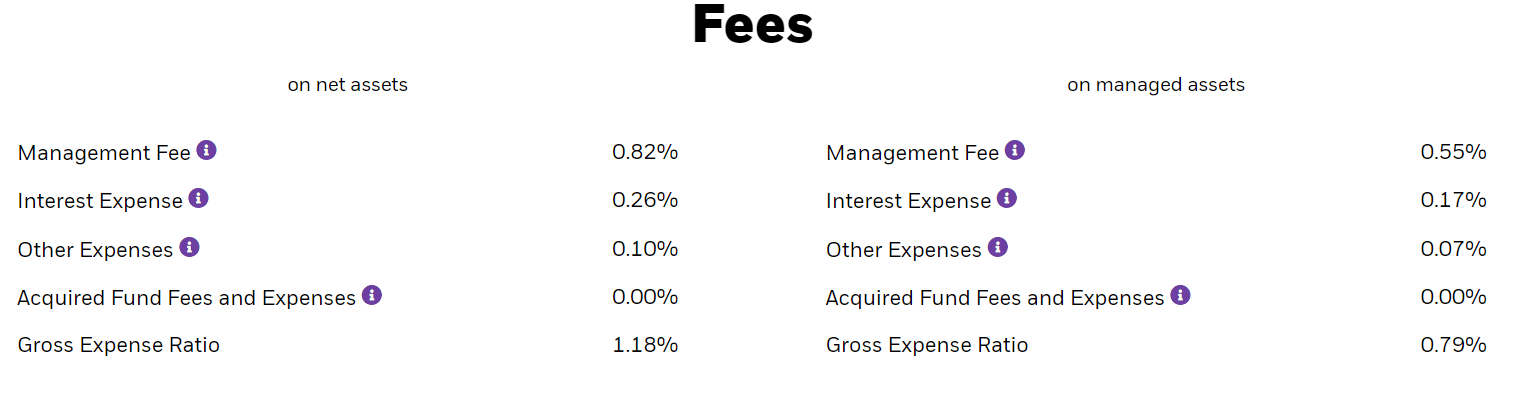
Figure 8 – BLW fees (blackrock.com)
Shortfall In Income Vs. Distribution
I have written extensively on the fallacy of high yielding CEFs, as many of them earn less in investment income and capital appreciation than what they pay out in distribution, leading to a short fall that is covered by return of capital (whether it’s labelled ROC or capital gains is largely irrelevant). Unfortunately, BLW is guilty of the same issue, as the fund has earned an average annual total return of 5.0% over 10 years, but pays an 8.7% annualized distribution on NAV.
Even if we exclude 2022’s performance, from figure 5 above, I calculate BLW’s average annual total to be only 7.5%, from 2012 to 2021.
While mathematically, the average shortfall is not large (2.7% per year using the average 10 year annual return to October 31, 2022), the return profile is path dependent. If the fund earns a couple of years of sub-par returns in a row, for example from 2014 to 2015, or 2020 to 2022, then the fund’s NAV takes a big hit and the fund’s ability to generate sufficient income to fund subsequent period distributions declines. This leads to shrinking NAV and distributions over time.
For example, BLW’s NAV has declined from over $18 / share in 2012 to ~$13.50 today and its distribution has declined from $1.37 in 2012 to $1.18 (Figure 9).
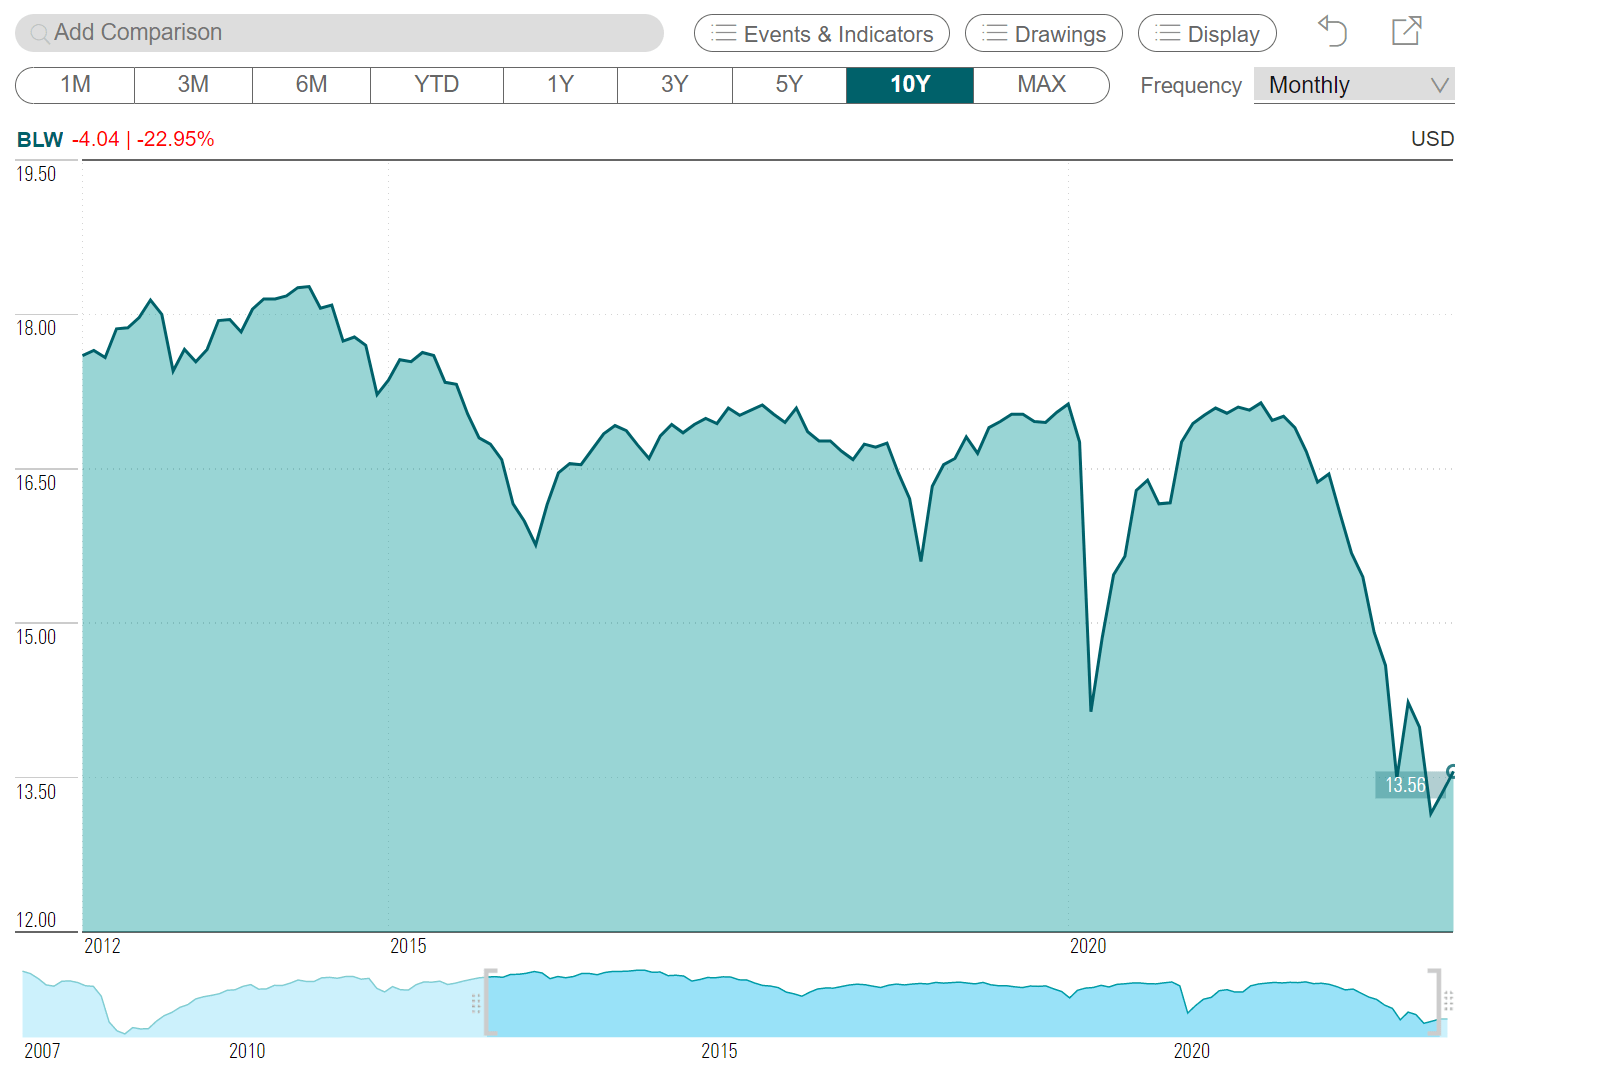
Figure 9 – BLW’s NAV over 10 years (cefconnect.com)
Conclusion
BLW is a high yielding CEF that has low average portfolio duration. Its main attraction is its 8.8% current distribution yield. However, like many CEFs I have analyzed, BLW pays more in distribution than it earns in income and capital appreciation. This leads to shrinking NAV and distributions over time.
Be the first to comment