

Lari Bat
The bear market presses on. The bond bear market, that is. The Vanguard Intermediate-Term Bond ETF (NYSEARCA:BIV) is down 19.2% from its August 2020 peak. After inflation, the loss is about 30%. BIV closed at a fresh weekly low on Friday.
BIV: Fresh Weekly Closing Low. Bear Market Continues.
Stockcharts.com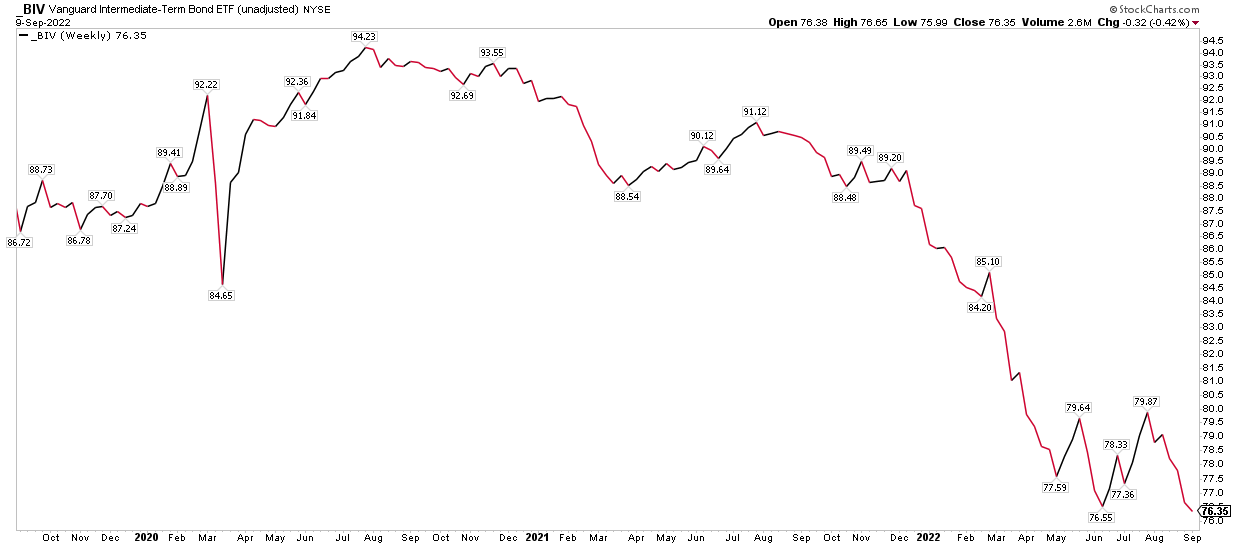
The good news for some fixed income investors is that corporate spreads have narrowed slightly last week with high yield bonds rallying. Investment grade credit has been less volatile, but its yield premium over comparable term Treasuries is about 0.2% off the highs tagged a few times this year.
Corporate Bond Spreads: Off the Highs
St. Louis Federal Reserve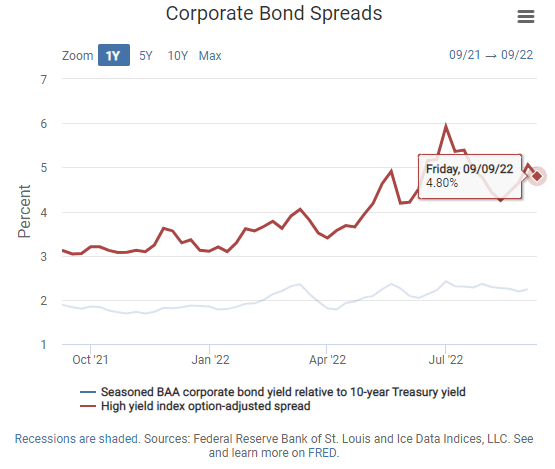
Focusing on the Treasury market, intermediate-term Treasuries have never had a more dismal start to a year in modern history. While the Barclays Bloomberg Aggregate Bond Index began in 1976, Vanguard’s intermediate-term Treasury fund dates back just to 2007.
In that time, though, BIV has never performed as badly through early September as it is right now. The year-to-date drop of about 11% easily makes 2022’s decline the worst in its history. A 6% giveback through this spot on the calendar in 2013 was the previous low water mark.
BIV Seasonality: Worst Stretch On Record (2007 Inception)
Stockcharts.com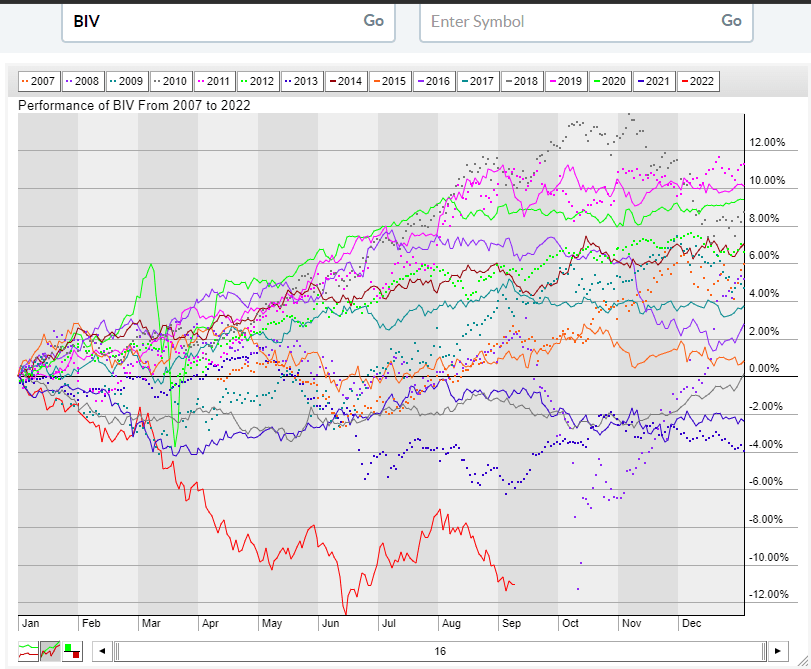
Last week, Federal Reserve Chair Jerome Powell sat down with the Cato Institute for a seemingly scripted one-on-one. Jay didn’t pull any punches. Like at his Jackson Hole speech in August, the tone was direct and the message was clear – the Fed will hike rates above the neutral amount until there are definitive signs that inflation is under control and closer to the Fed’s goal of 2%. Interest rates moved higher with the U.S. 10-year yield rising for a sixth consecutive week.
U.S. 10yr Treasury Yield: 6 Straight Up Weeks
Stockcharts.com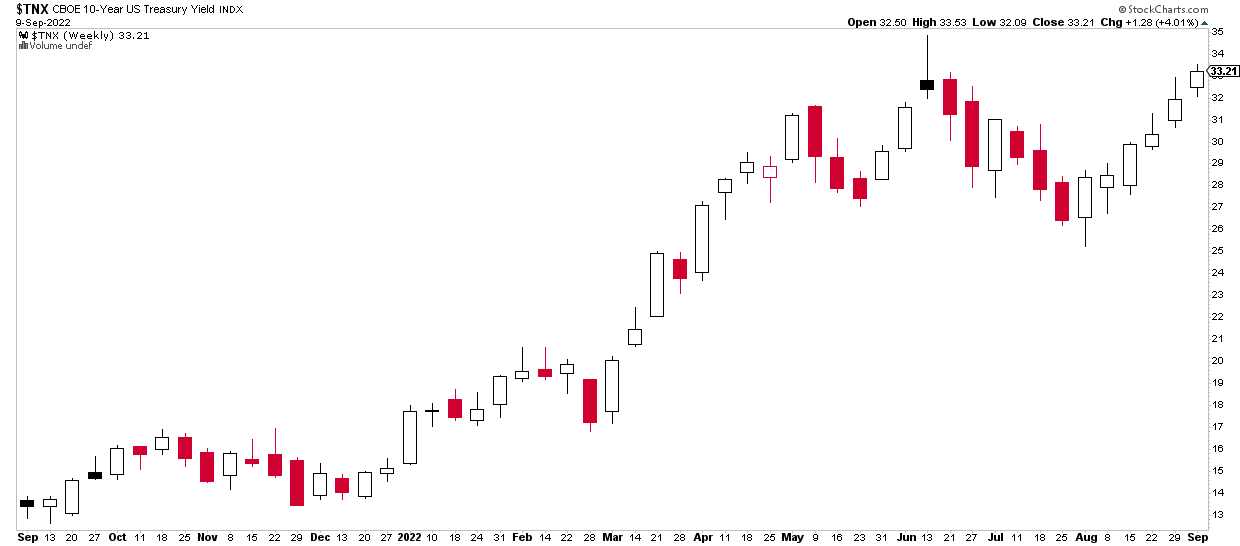
The market had been turning more optimistic about the future state of the economy, one could argue, as the key 2s10s spread steepened to just –0.14 percentage point last Wednesday. The gauge of economic health ended the week at –25bp, however.
2s10s Spread: Off the Lows, Still Inverted
TradingView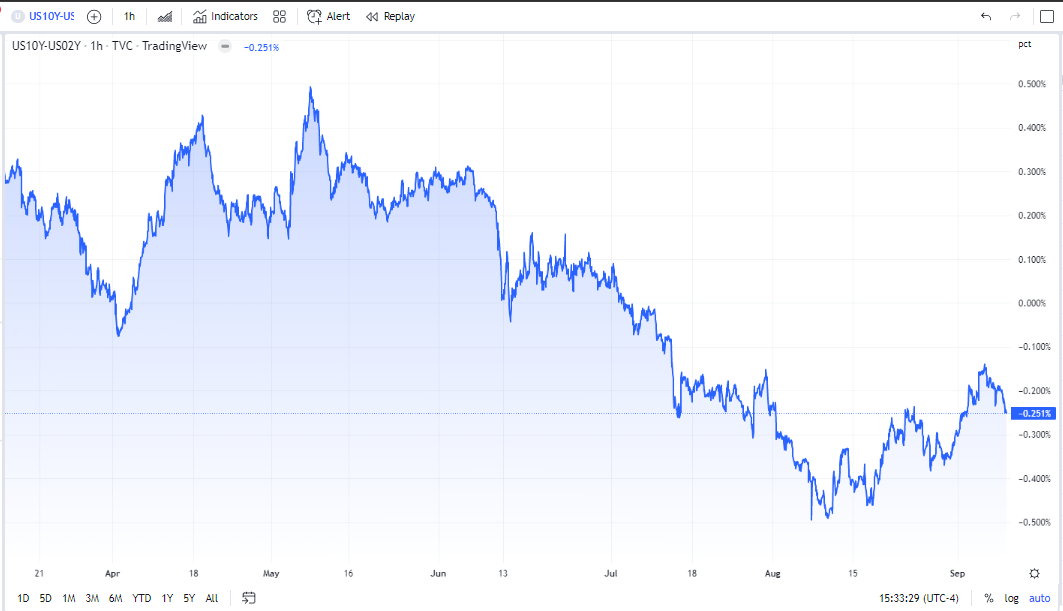
All eyes are now on what this Tuesday’s Consumer Price Index (CPI) report will reveal. The consensus forecast is for a decline in the headline rate of inflation. That would come on the heels of July’s -0.02% change for a second straight month of falling consumer prices. Few would have predicted that scenario earlier this summer.
Key Data This Week: CPI Tuesday Morning
BofA Global Research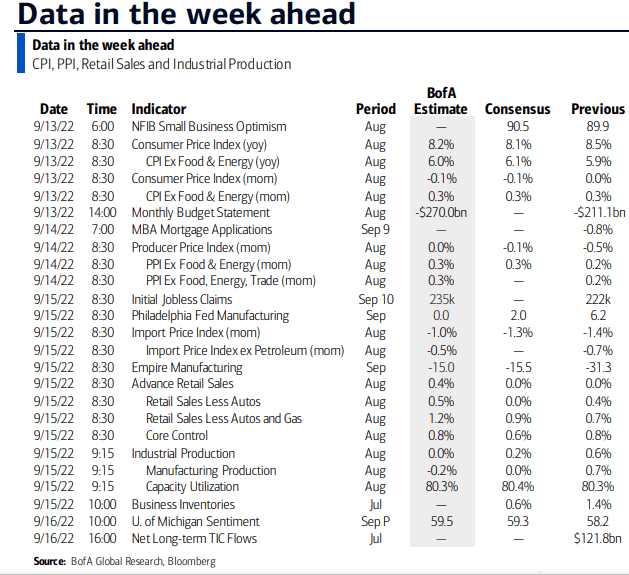
July CPI: Negative Two Basis Points
BofA Global Research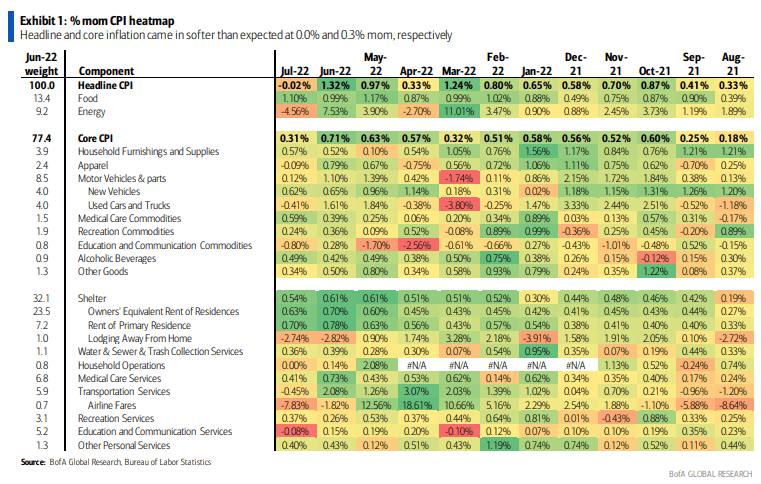
Also on the horizon impacting both corporate bonds and Treasury securities is undoubtedly the September FOMC meeting next week. It is all but locked up that the Fed will hike rates by a third consecutive three-quarter point amount.
According to the CME Fed Watch tool, futures trades have priced in a 91% chance of such an increase. It was reported by The Wall Street Journal last week that the Fed was leaning in that direction. While just speculation on my part, it seems the Fed simply communicates to the market through Nick Timiraos, chief economics correspondent at the WSJ. Recall back last June when news ‘broke’ that the Fed would raise the Fed Funds Target Rate by 0.75 percentage point in advance of that month’s meeting.
CME Fed Watch: A 0.75 Percentage Point Hike In the Bag?
CME Group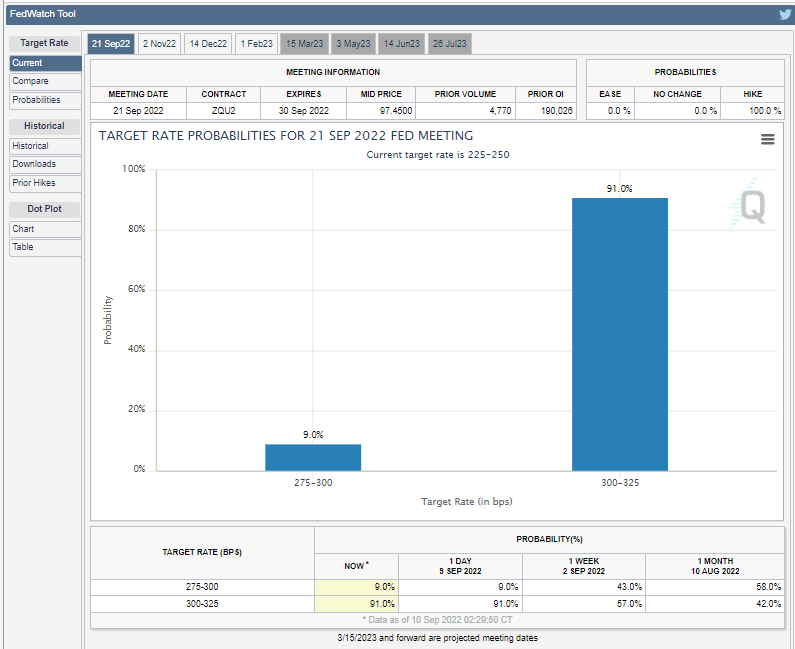
The Technical Take
So where do intermediate-term bonds go from here? I see two key spots on BIV’s chart. Resistance is seen at $80 while support is at the June 14 low just above $75. The current $5 range is critical. A breakdown below $75 would portend another $5 lower based on a measured move price objective. On the flip side, a breakout above $80 should help send BIV to its January-February price area near $85. We should know a lot more after Tuesday.
BIV: Watching $75 and $80
Stockcharts.com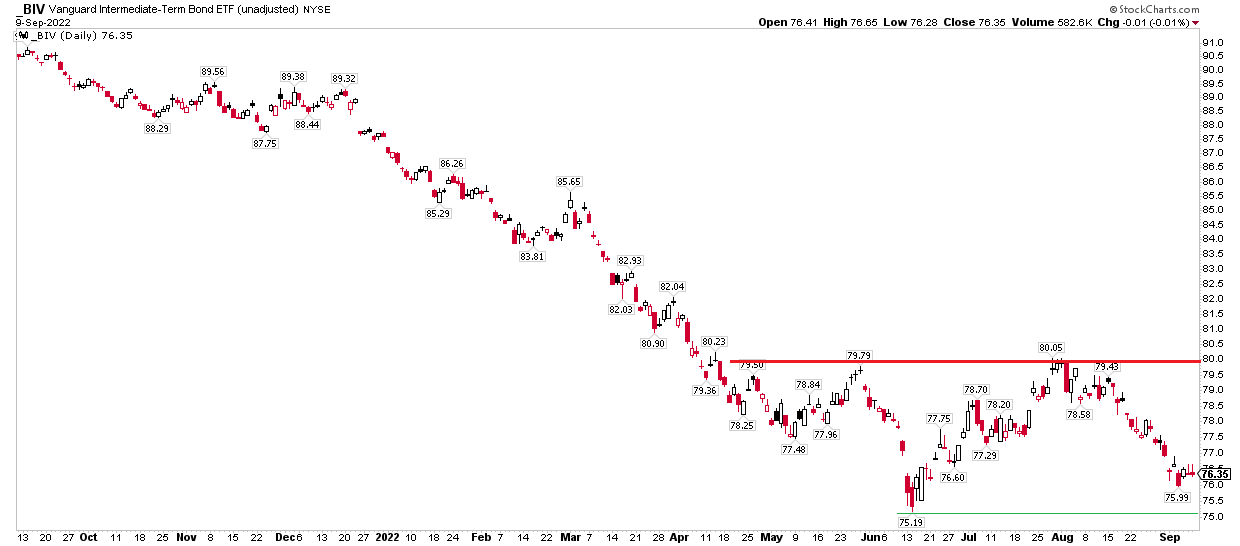
The Bottom Line
Both equity and bond investors should watch macro conditions and how intermediate-term bonds react. BIV tracks the broad intermediate-term fixed income space, and it’s precariously near support. The $75 must price hold otherwise the bond bears will confirm their control. Watch this week’s CPI report on Tuesday morning and next week’s Fed meeting for volatility catalysts.
Be the first to comment