

Bitcoin, Silver Forecast:
Bitcoin and Silver prices continue to demonstrate the ramifications of crowd psychology on financial markets as price action preserves the upward trajectory for both markets. Although both the major cryptocurrency and its Silver counterpart have benefited from renewed interest, a subdued economic calendar suggests that besides from Friday’s NFP report, technical and psychological factors may overshadow this week’s fundamentals, serving as a catalyst for price action in either direction.
Bitcoin (BTC/USD) Price Action
Bitcoin prices continue to edge higher after bulls successfully managed to break above the key psychological level of $32,000, pushing price action through the upper bound of the descending triangle, formerly serving as resistance. The move confirmed that the ‘Bitcoin Bubble’ has not yet burst and that further gains cannot be ruled out.
Currently, BTC/USD price action remains encapsulated by the key Fibonacci retracement levels of the short-term move (27 Nov 2020 low – Jan 2021 high), forming a zone of confluency between the 38.2% retracement level, providing support at $32,154 and the 23.6% Fibonacci retracement level, holding resistance at $35,915. Meanwhile the Commodity Channel Index (CCI) remains in overbought territory, with a reading of 168 confirming that bulls remain in control, at least for now.
Recommended by Tammy Da Costa
Download Your free Bitcoin Trading Guide
Bitcoin (BTC/USD) 4 Hour Chart
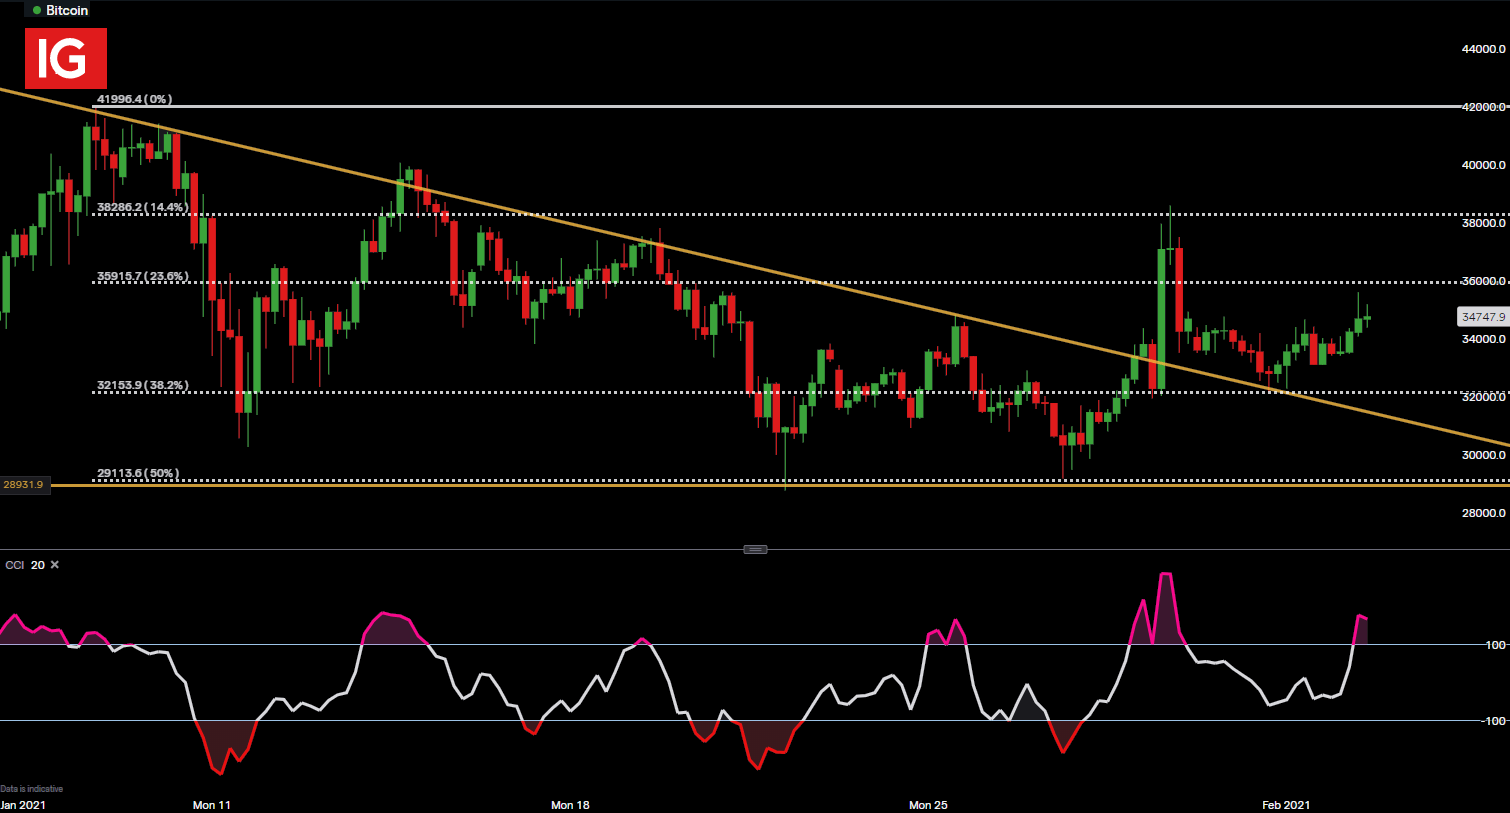
Chart prepared by Tammy Da Costa, IG
If prices manage to fall below current support, bears may able to push prices lower towards the psychological level of $30,000. On the contrary, if bulls continue to take charge, then it may open the door for continuation towards January highs, around the $40,000 mark.

Recommended by Tammy Da Costa
Building Confidence in Trading
Silver (XAG/USD) Price Action
Silver prices continue to slide after the precious metal saw price action push into a wall of resistance at the key psychological level of 30.00. As traders drove prices higher, tick volume increased to it’s highest level since August 2020, validating the strength of the breakout.
A retest of August 2020 highs resulted in a double-top formation, above the key level of resistance, currently formed by the 50% Fibonacci retracement level of the historical move (2008 low – 2011 high) at 2906. Price action currently remains well-above trendline support, with the Relative Strength Index (RSI) falling below the 70 level, a potential indication that price action is back within range.
| Change in | Longs | Shorts | OI |
| Daily | -12% | -29% | -15% |
| Weekly | 52% | 168% | 61% |
Silver (XAG/USD) Daily Chart

Chart prepared by Tammy Da Costa, IG
For now, support potential remains around the key psychological level of 2500 with the 61.8% Fibonacci retracement level providing additional support at 2416.9
— Written by Tammy Da Costa, Market Writer for DailyFX.com
Contact and follow Tammy on Twitter: @Tams707
https://www.dailyfx.com/education/technical-analysis-chart-patterns/descending-triangle.htmlhttps://www.dailyfx.com/education/learn-technical-analysis/the-trend-is-your-friend.html
Be the first to comment