

Bitcoin (BTC/USD) Charts and Analysis
- Bitcoin breaks higher over the weekend.
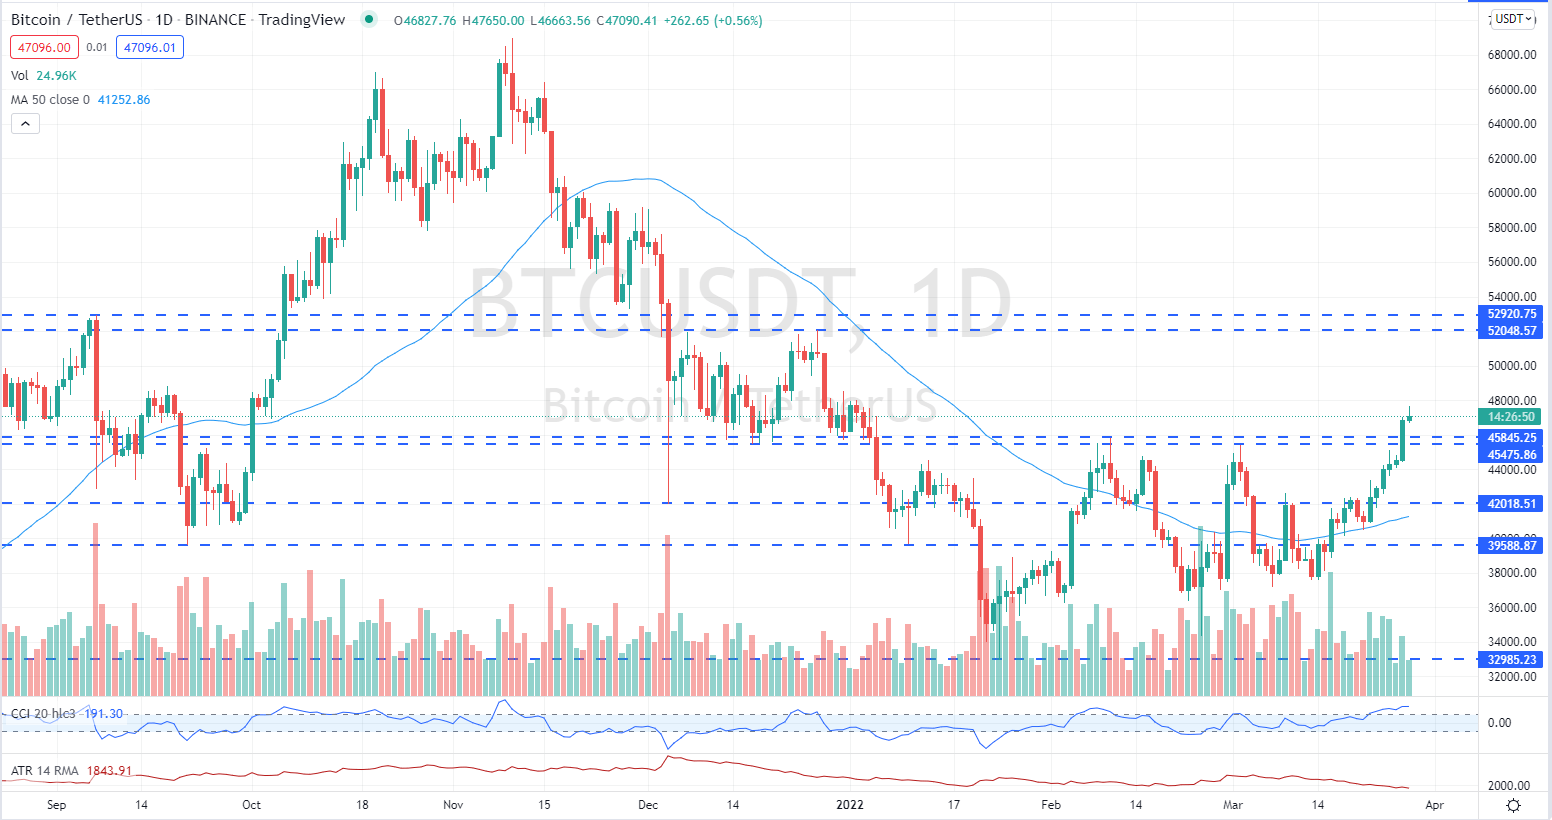
- Resistance now lies between $52k and $53k.
Bitcoin is back at highs last seen at the start of the year after a strong weekend performance saw BTCUSD finally break a stubborn resistance area. The move higher needs to be consolidated over the next few days to allow the pair to test the next level of horizontal resistance between $52k and $53k. The CCI indicator is now in overbought territory and needs to be reversed to allow the next leg higher and the prior resistance zone between $45.5k and $45.9k needs to act as new support to give more credibility for higher prices. The recent rally has been achieved during lower levels of volatility – using the ATR indicator – suggesting that buyers are quietly going about their business.
One Bitcoin buyer of note over the last 7-10 days, the Luna Foundation Guard, is said to have bought in excess of $1 billion BTC as part of a $3 billion order to act as a reserve asset to back its UST stablecoin. This order has been clearly signposted and is likely to be behind some of the moves higher with market short positions being closed out with such a sizeable, and regular, buyer active in the market.
Bitcoin Daily Price Chart – March 28, 2022
Chart via TradingView
What is your view onBitcoin – bullish or bearish?? You can let us know via the form at the end of this piece or you can contact the author via Twitter @nickcawley1.
Be the first to comment