


Ja’Crispy
Bitcoin (BTC-USD) has been stuck in a crypto winter since some time now, which the picture above this article very fittingly illustrates. While worldwide markets seemed to recover during the last couple of weeks, there seems to be no let-up for cryptocurrencies with a never-ending stream of bad news for Bitcoin and crypto investors. Of course, most notably the sudden bankruptcy of FTX (FTT-USD) which has the potential to negatively affect Bitcoin in the near future, and might even trigger a larger crisis.
Parallels between past events and today
This is not a wholly unprecedented situation. Bitcoin has had its problems in the past, for instance in 2014. Most Bitcoin investors will have likely heard about Mt. Gox. Mt. Gox was a large currency exchange which, at one point, handled about 70% of Bitcoin transactions worldwide. This exchange already experienced some problems with hacks and leaks in the years leading up to 2014, but in February 2014 the firm went bankrupt due to a bug in their software leading to stolen Bitcoin. A company as large as this, handling 70% of worldwide transactions in 2014 might have been an even larger negative event for Bitcoin than the recent FTX downfall.
The Mt. Gox events triggered or at least strongly exacerbated the slump in Bitcoin price which happened between 2013 and 2015. Let us take a look at what happened between 2013 and 2015, and how it compares to the current situation.
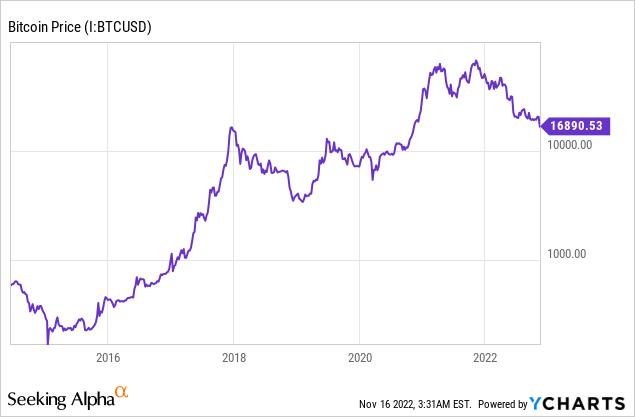
Graph 1: Bitcoin price development over the last couple of years (logarithmic) (Source: YCharts)
Since YCharts data does not go back this far, you can find a graph which goes back until 2013 here. Also, in another less pretty chart which you can find here, you can find the all-time price development of Bitcoin on a log scale since 2010 (this is very useful since the other charts do not go back this far).
As we can see in all the graphs, the current drawdown looks bad but still not as bad as it was in 2013-2015. Now let us put numbers on these corrections and see what happened in the past compared to today.
Past corrections
In a previous article I wrote about Bitcoin, I created a table of major Bitcoin crashes and drawdowns. Since this table gives a nice overview of price development, I will paste it here again:
| Previous crashes | Previous high | Low | % correction | Time until low | Time until new high |
| Summer of 2011 (Mt. Gox security breach) | $21.1 | $2.2 | -89.6% | ~5.5 months | ~2.5 year |
| Middle 2013 | $164 | $70 | -57.3% | ~3 months | ~7 months |
| Late 2013 (Banking ban and Mt. Gox bankruptcy) | $1242 | $170 | -86.3% | ~1 year and 7 months | ~3 years and 1 month |
| End of 2017 | $18,319 | $3,302 |
-82.0% |
~1 year | ~3 years |
| Early 2020 (Covid) | $10,332 | $5,182 | -49.8% | ~1 month | ~6 months |
Table 1: major Bitcoin crashes (created by author). Please note that I took the daily average prices for the highs and lows.
Let us take a look at these price developments. In 2013-2015, prices went from a high of $1242 in 2013 to a low of $170 in January 2015. This was a decrease of more than 86%. The first correction in this table, which was triggered by a Mt. Gox security breach, was more severe percentage-wise, but prices were still at a very low level compared to now, so I am ignoring this one in my analysis.
As we can clearly see from the table, for the more serious corrections (2013-2015 and late 2017) it took more than a year for Bitcoin prices to reach their low and more than 3 years to reach a new all-time high.
Currently, Bitcoin has fallen from its high of $68,789 in November 2021 to the current price of $16,750. This is a drop of 75% already. If we expect that the situation of today is comparable to the situation in 2013-2015 and the drop will be equal in terms of percentage, Bitcoin has room to drop to slightly below $10,000. Compared with the correction which started in 2017, Bitcoin would have to drop to about $12,500 to equal these losses percentage-wise.
Parallels and differences
There are many parallels between the situation for Bitcoin in 2014 and now:
- A major exchange went down (Mt. Gox then and FTX now)
- People have been talking about systemic risk for the crypto markets because of these problems, but today with the addition that this risk might spill over to the ‘regular’ financial markets
- Price development has been abysmal
There are also some signals however that current situation is very different from the situation in 2013-2015.
- The Mt. Gox disaster was around the beginning of the price slump in 2013-2015, the FTX bankruptcy happened while Bitcoin price is already down considerably from its all-time high.
- The Mt. Gox disaster was arguably much more severe, since this exchange handled about 70% of worldwide Bitcoin transactions during its heyday.
- In 2013-2015, the world was still recovering from a major financial crisis which at the time heavily undermined the trust of people in financial institutions. In hindsight, this might have been a major factor which propelled cryptocurrency to popularity.
- Interest rates and inflation are both up considerably since 2015.
Let us take a look at the last point I mentioned. How do interest rates and inflation influence the price of Bitcoin and cryptocurrency in general?
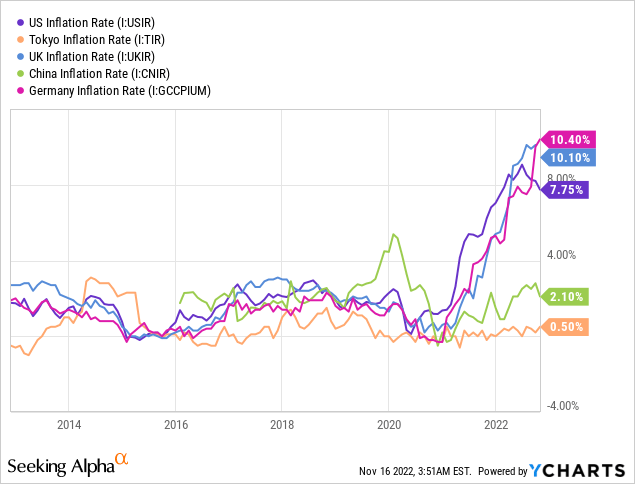
Graph 2: Inflation rate developments in some major economies (source: YCharts)
Let us look at inflation rates first. In the graph above, inflation rates in some of the world’s most important economies are depicted (U.S., China, Germany, Japan, UK). As we can see, there are large discrepancies here: “western” inflation (U.S., Germany and UK) has picked up dramatically while “Asian” (China and Japan) has remained quite stable. Why this is the case is out of scope for this article, but a couple of causes likely include the war in Ukraine, the energy crisis and the Zero COVID policy in China. But on aggregate, global inflation rate has picked up since 2021, and is certainly at a higher level than it was in 2013-2015 when the previous large crypto winter happened.
Theoretically, Bitcoin acts as an inflation hedge. I put the world theoretically in italics, since until now, there is not adequate data to confirm this. But let us think about the forces at work between crypto markets and currency markets when there exists a world in which fiat currency gets inflated (and central banks increase interest rates):
- Bitcoin has very limited inflation since the number of Bitcoin in existence has been determined mathematically and is growing slowly. Actually, there might even be deflation since some Bitcoin gets lost. If there exists fiat currency which is experiencing inflation, the price of Bitcoin should go up in the long term versus this fiat currency.
- But in the current situation, since almost every person needs fiat currency as well, investors experience a decrease in liquidity by this inflation which likely has spilled over into crypto markets.
- Interest rates also play a role here: if interest rates for fiat currency are lower than inflation (which is the case right now), this could make crypto investing more interesting. If interest rates are higher than inflation, which might become reality in the future, fiat currency bonds would be more interesting for investors than crypto.
In the short term, spillovers from fiat currency inflation are likely to have had a negative effect on crypto markets, but on the longer term, if inflation stays high for a longer period of time (and central banks remain behind the curve), this could have a positive effect on crypto price development.
Time scale and conclusion
Perhaps even more important than how far Bitcoin’s price will fall is how long the crypto winter will last. But a straight answer to this question cannot be given. If we compare the current situation to the situation of 2013-2015, where it took one year and 7 months for Bitcoin to find a low and more than three years to reach a new high, it would not be extraordinary to expect that Bitcoin could reach a new low around mid 2023, and go back to its previous high not before the end of 2024. That is, if situations are comparable and history repeats itself. And that is, if Bitcoin ever gets back to its previous all-time high, which some people doubt.
Of course, history does not repeat itself but it often rhymes, and the situation in 2013-2015 is not completely comparable to the current situation. Things which are quite different now are inflation, interest rates, the geopolitical situation and the fact that we are not recovering from a financial crisis at this moment.
As I argued in this article, inflation could have a short-term negative effect on cryptocurrency but a long-term positive effect. When compared with previous corrections, Bitcoin price could easily go below $10,000 and it could last until the end of 2024 before we see new all-time highs, if we ever.
But I still see potential for Bitcoin and cryptocurrency in the financial system of the future, and although crypto markets can be particularly brutal, prices have the potential to experience major recovery in the mid to long term. An interesting catalyst could be the change of Bitcoin from proof-of-work to proof-of-stake, if it ever happens. Also, please note that I almost exclusively looked at Bitcoin in this article, but most other cryptocurrencies are affected by the factors at work here. In fact, other cryptocurrencies, especially Ethereum (ETH-USD) are getting more important compared with Bitcoin as you can see on the Bitcoin dominance chart here.
Last but not least, please keep in mind that investing in cryptocurrency has large risks, so do not use leverage and do not invest more than you can afford to lose.
Thank you for reading! If you have any views about Bitcoin or other cryptocurrencies and the recent crypto winter, please let me know in the comment section below!
Be the first to comment