

Bitcoin (BTC/USD) Price Analysis:
- Bitcoin bulls take a breather ahead of FOMC
- BTC/USD Fibonacci Support remains in place
- US Dollar a primary catalyst for price action and a focal point of today’s FOMC announcement
Bitcoin bulls continue to fight for dominance after achieving yet another record high of $61,187 over the weekend, helped along by the enactment of the $1.9 Trillion US Fiscal Stimulus package. But as interest rates remain near zero, retailers and institutions continue to flock towards the major cryptocurrency, supporting the adoption of Bitcoin as an alternative method of payment and as an alternative to Gold, Silver and safe-haven assets which often function as a hedge against inflation and US Dollar weakness. As a result, speculation has remained favorable towards Bitcoin bulls, allowing them to march along the upward trajectory that has pertained since late last year.

Recommended by Tammy Da Costa
Download Your free Bitcoin Trading Guide
However, as James Stanley highlighted recently, the US 10-Year Treasury note yield in 2021 has shared a similar trajectory to Bitcoin, with rates surging approximately 80% from January’s low. However, as inflationary and yield curve concerns continue to mount, the big question is how the Fed might navigate in that environment, drawing specific attention to tonight’s FOMC Economic Projections as well as the Fed Press Conference, a potential catalyst for the imminent BTC/USD move.
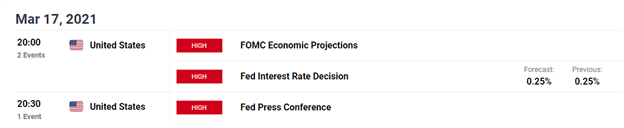
DailyFX Economic Calendar
Bitcoin (BTC/USD) Technical Analysis
Current Bitcoin price action has stalled momentarily after achieving yet another record high of $61,714 over the weekend. But, after failing to break through $62,000, Bitcoin prices retreated, finding solace the key psychological level of $55,000, currently holding as support. This week, prices have continued to display signs of consolidation and remain encapsulated by the Fibonacci retracement levels of the 2020 – 2021 move, providing support and resistance for short-term movements.
Meanwhile, on the weekly time-frame, the RelativeStrength Index (RSI) and the Moving Average Convergence/Divergence (MACD) remain in oversold territory for now, with price action resting well above both the 50 and 200-Period Moving Average.

Recommended by Tammy Da Costa
Improve your trading with IG Client Sentiment Data
Bitcoin (BTC/USD) Weekly Chart
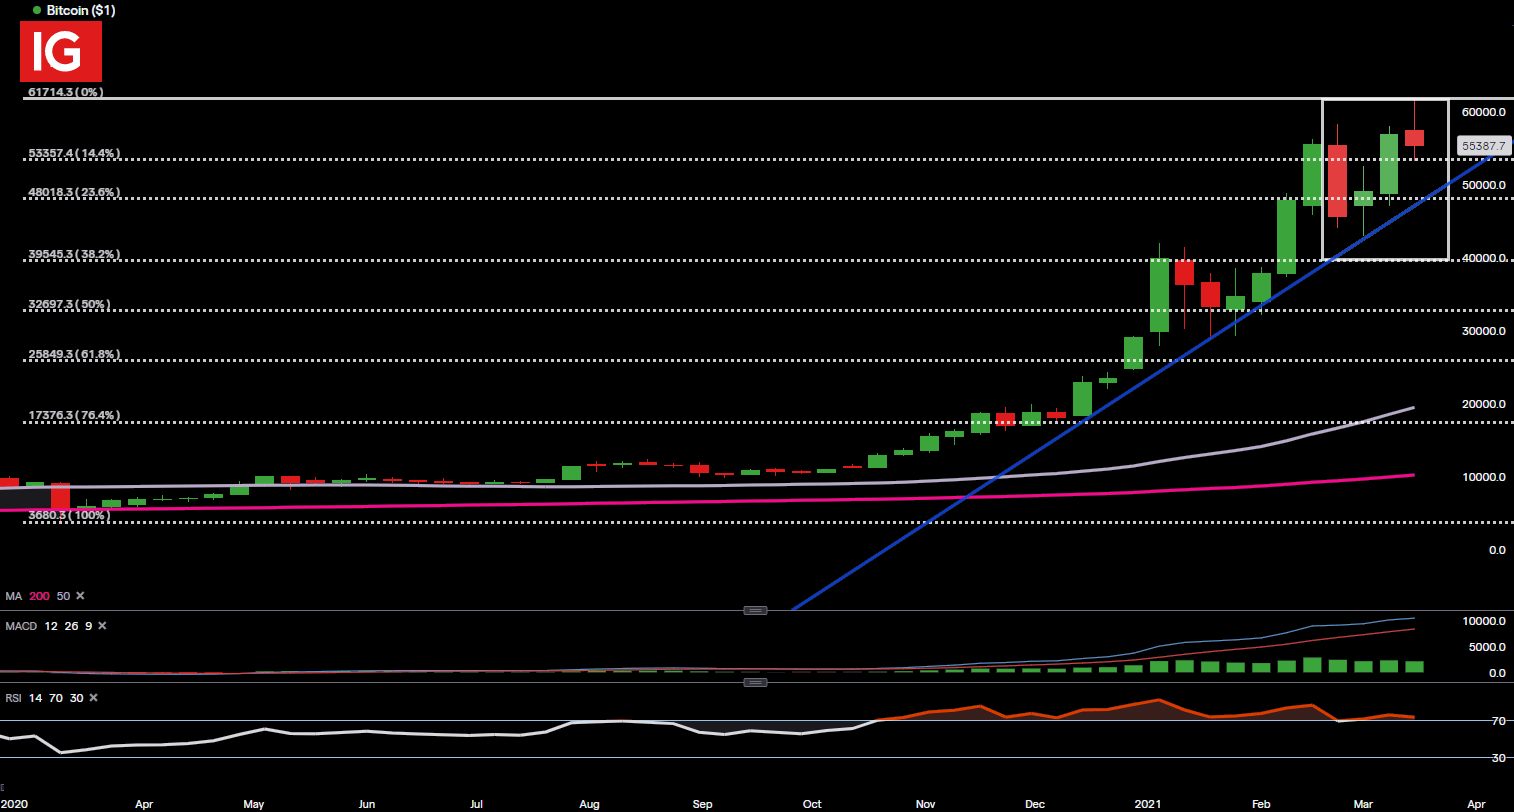
Chart prepared by Tammy Da Costa, IG
Meanwhile, on the daily chart, prices continue to remain within the boundaries of arising channel while honoring the key Fibonacci levels. The RSI has fallen back within range while the MACD remains above the zero-line with Divergence suggestive that the bullish rally may be losing steam.

Recommended by Tammy Da Costa
Discover the importance of confidence in trading
Bitcoin (BTC/USD) Daily Chart
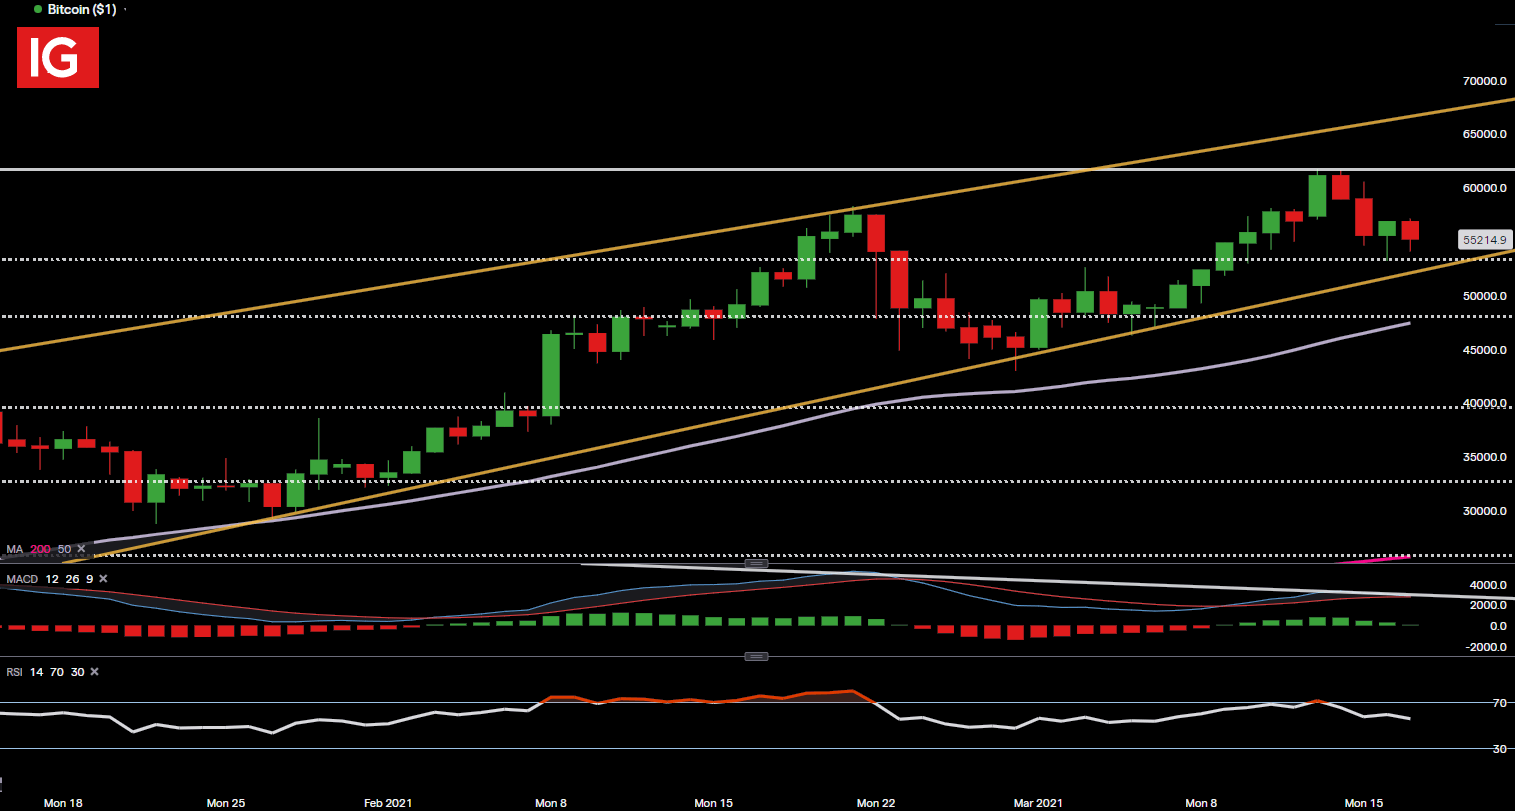
Chart prepared by Tammy Da Costa, IG
For now, $55,000 continues to hold as support. A break below this level may result see bears driving prices lower, back towards $50,000.
On the contrary, the February high continues to hold as resistance with the new high of $61,000 remaining as the next level of interest.
— Written by Tammy Da Costa, Market Writer for DailyFX.com
Contact and follow Tammy on Twitter: @Tams707
Be the first to comment