

Bitcoin (BTC/USD) Chart and Analysis
- Support around $39.6k remains solid for now.
- Noted resistance is under pressure.
Bitcoin is making a comeback after the heavy selling seen earlier in the month and is now pressing against an old resistance level and an important technical indicator that guard a further move higher in BTC/USD. While risk markets remain nervous, any move higher in Bitcoin will be limited at best, but the technical setup for BTC/USD is now looking more positive.
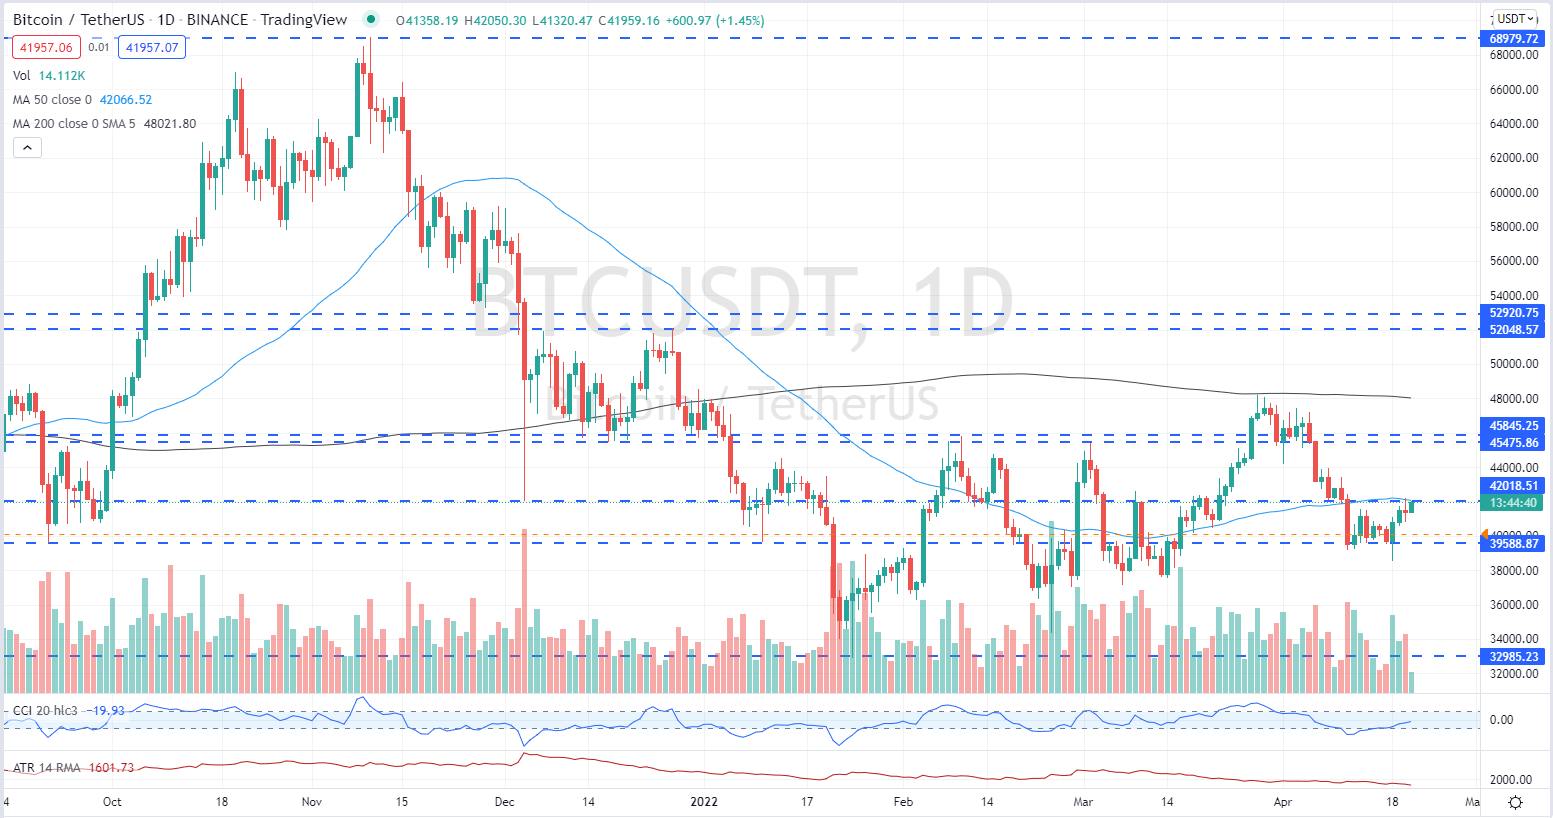
The largest cryptocurrency by market capitalization is currently testing $42k again after breaking and then retreating below this level yesterday. The late March/early April sell-off in the pair now looks to be over after a support zone around $39.6k held firm and prompted a move higher. The mid-April low produced a multi-month low reading on the CCI indicator highlighting the oversold nature of Bitcoin, and this reading is now moving higher as the sell-off is washed out.
The resistance level mentioned above is made up of a cluster of prior supportive prints at the end of last year which then turned into resistance in early February and early March. A failed break of $42k earlier this month sent the pair tumbling lower. This resistance is now being given added strength by the 50-day simple moving average.
Popular Moving Averages and How to Use Them
If Bitcoin can make a confirmed break above this level, then a quick move back to the next zone of resistance is likely with little technical resistance shown on the daily chart. Above here the 200-day simple moving average – currently at $48k – will be the next challenge for BTC/USD.
Bitcoin Daily Price Chart – April 21, 2022
Chart via TradingView
What is your view on Bitcoin – bullish or bearish?? You can let us know via the form at the end of this piece or you can contact the author via Twitter @nickcawley1.
Be the first to comment