

Bitcoin (BTC/USD) and Ethereum (ETH/USD) Price, Analysis and Chart:

Recommended by Nick Cawley
Get Your Free Introduction To Bitcoin Trading
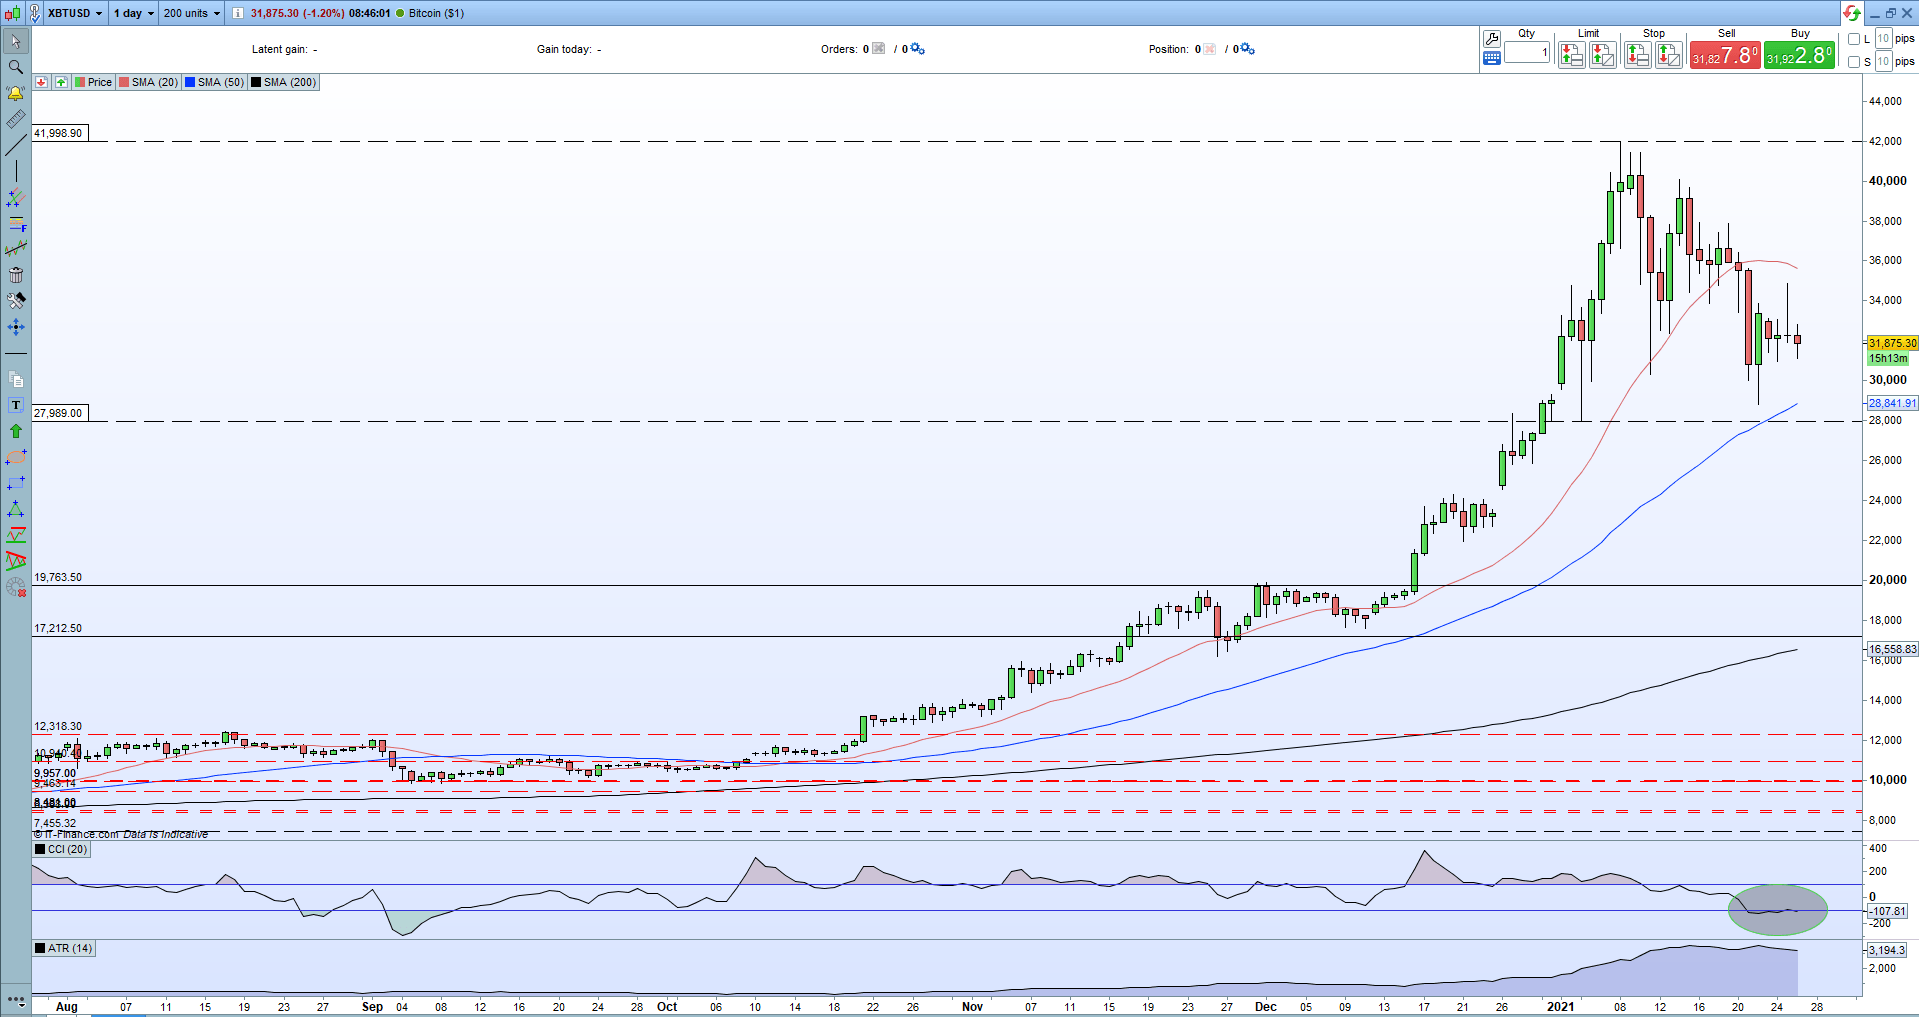
The recent cryptocurrency rally is on pause for now with Bitcoin and a majority of alt-coins fading off their recent all-time highs. A period of consolidation can be seen as a positive for the market after recent breath-taking moves and once the market re-balances, fresh highs look the path of least resistance for now. In the short-term however, Bitcoin is looking slightly negative with the daily chart showing a ‘gravestone doji’ formed on Monday. This may continue the recent sell-off, especially with the market capped by the 20-day simple moving average, although a zone of support between $28,000 and $28,800 is likely to hold and stem further losses. The CCI indicator is also showing the market as oversold for the first time since early-September.
Candlestick Patterns for Traders
Bitcoin Daily Price Chart (August 2020 – January 26, 2021)

Recommended by Nick Cawley
Improve your trading with IG Client Sentiment Data
Retail trader data show82.53% of Bitcoin traders are net-long with the ratio of traders long to short at 4.73 to 1. We typically take a contrarian view to crowd sentiment, and the fact traders are net-long suggests Bitcoin prices may continue to fall.Traders are further net-long than yesterday and last week, and the combination of current sentiment and recent changes gives us a stronger Bitcoin-bearish contrarian trading bias.
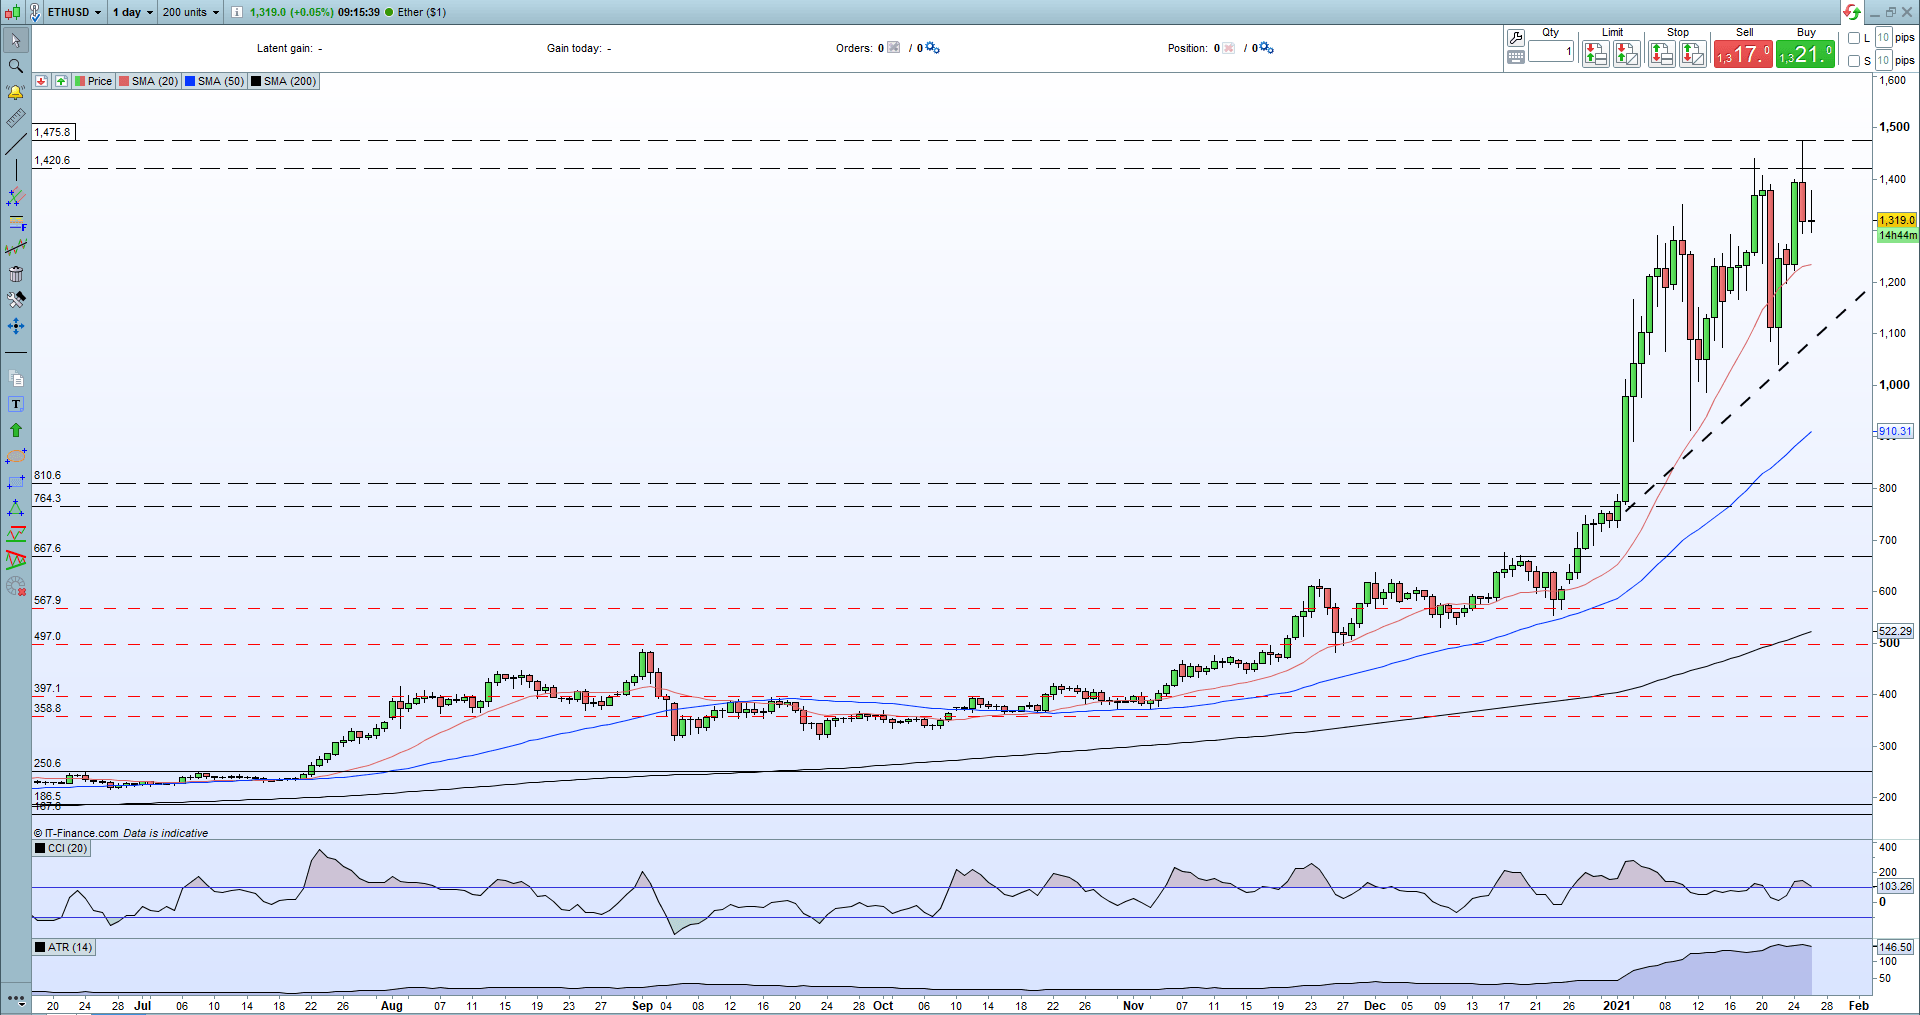
Ethereum continues to out-perform Bitcoin and the second-largest coin by market capitalization retains a neutral to positive bias outlook. A recent cluster of higher highs and higher lows remains in place with the alt-coin finding support from the 20-day simple moving average recently and printing a fresh all-time yesterday. Trend support also remains in place. Initial support between $1,235 and $1,295.
Ethereum Daily Price Chart (June 2020 – January 26, 2021)
Traders of all levels and abilities will find something to help them make more informed decisions in the new and improved DailyFX Trading Education Centre
What are your views on Bitcoin (BTC) and Ethereum (ETH) – bullish or bearish?? You can let us know via the form at the end of this piece or you can contact the author via Twitter @nickcawley1.
Be the first to comment