

Dennis Diatel Photography
Produced by Ryan Wilday with Avi Gilburt and Jason Appel.
Incessant Decline
In my article “Red Flag In Crypto Miners,” besides airing caution regarding the long-term prospects for Bitcoin (BTC-USD) mining, I stated how critical $16K is to my Bitcoin outlook. While we already have witnessed a one-year and 73% decline in Bitcoin prices from its 2021 high to its June low, breaking and sustaining below $16K could usher in a deeper bear market.
Weak Reversal
So far, Bitcoin has stayed above its $17,100 June low. On Aug. 14 it traded at $25,185, roughly 47% off the June low. But does this strong move indicate the bottom holds? Unfortunately, I can’t say this is the case as the entire move off the June low is corrective in structure. Further, if a low is going to hold, we don’t want the price to break below the .764 retrace of the move off of that low. That level is $19,100 and it was breached on September 6. And as of writing, Bitcoin has continued lower on the hourly chart.
This means that the June low is very likely to break and the critical $16K level is at risk.
Ether Strength
While Bitcoin and Ether are normally highly correlated, Ethereum (ETH-USD) has fared much better. After dropping to $879 in June, it rallied back to $2026, or 131% off the low. What’s more important is that the rally to $2026 is too high to be a fourth wave of the C wave that started down from Ether’s all-time highs. A high fourth wave should have held under $1780. And, finally, the structure off of the June low can be called a leading diagonal. This all means that the June low likely holds.
This structure leaves us with support for a wave 2 off the June low of $1000. As long as that level is not breached, both the long-term chart and the move off the June low suggest $10,500 is in the cards.
Ethereum Daily Chart (Produced by the author using Motivewave software.)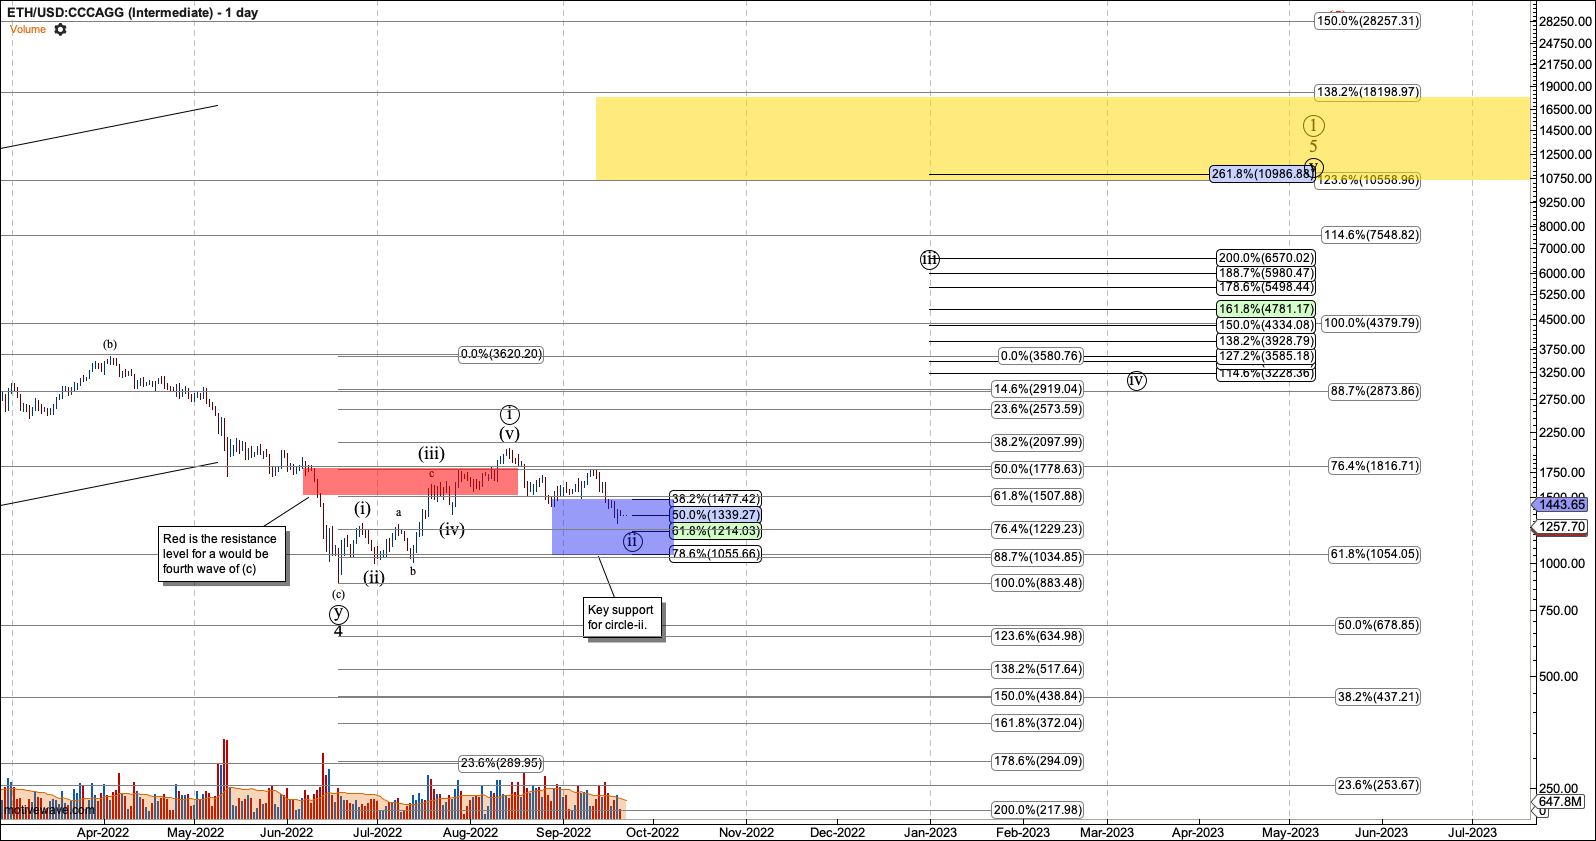
Ether’s Frothy Bulls
If you know the crypto space well, you know it can be tribal. Many crypto investors focus on a favorite project, leaving diversification to more mature investors. They show their support by using social media to cheerlead their favorite project and bash the rest. No tribal war in crypto is more fierce than that between the Bitcoin maximalists, or maxis, as they are called, and the Ether Maxis.
Ethereum went through what was called “the Merge” on Sept. 15. This was an upgrade of the blockchain from Proof of work (POW), to proof of stake (POS). This change has been heralded by Ether Maxis as making Ethereum superior to Bitcoin because proof of stake consensus takes less energy. And other changes enabled in the Merge make the supply of Ethereum more deflationary.
The excitement surrounding this upgrade may be the reason for the strong push off the June low. But as always, euphoria leads to frothy markets, and instead of pushing higher, Ether has so far dropped over 20% since the Merge triggered. Ether maxi social media heralded its arrival yet it triggered a drop
Ryan Sean Adams co-costs the Bankless Podcast, a pod that can be called very pro-Ethereum (Twitter)
We saw the potential of the B wave top forming on my chart below a week before it finally did, as Ether bulls looked up with excitement. Now that the smoke has cleared, we are starting to accumulate in our support zone, which ranges from the current price down to $1,000.
Ethereum 45 min. Chart (Produced by the author using Motivewave software. )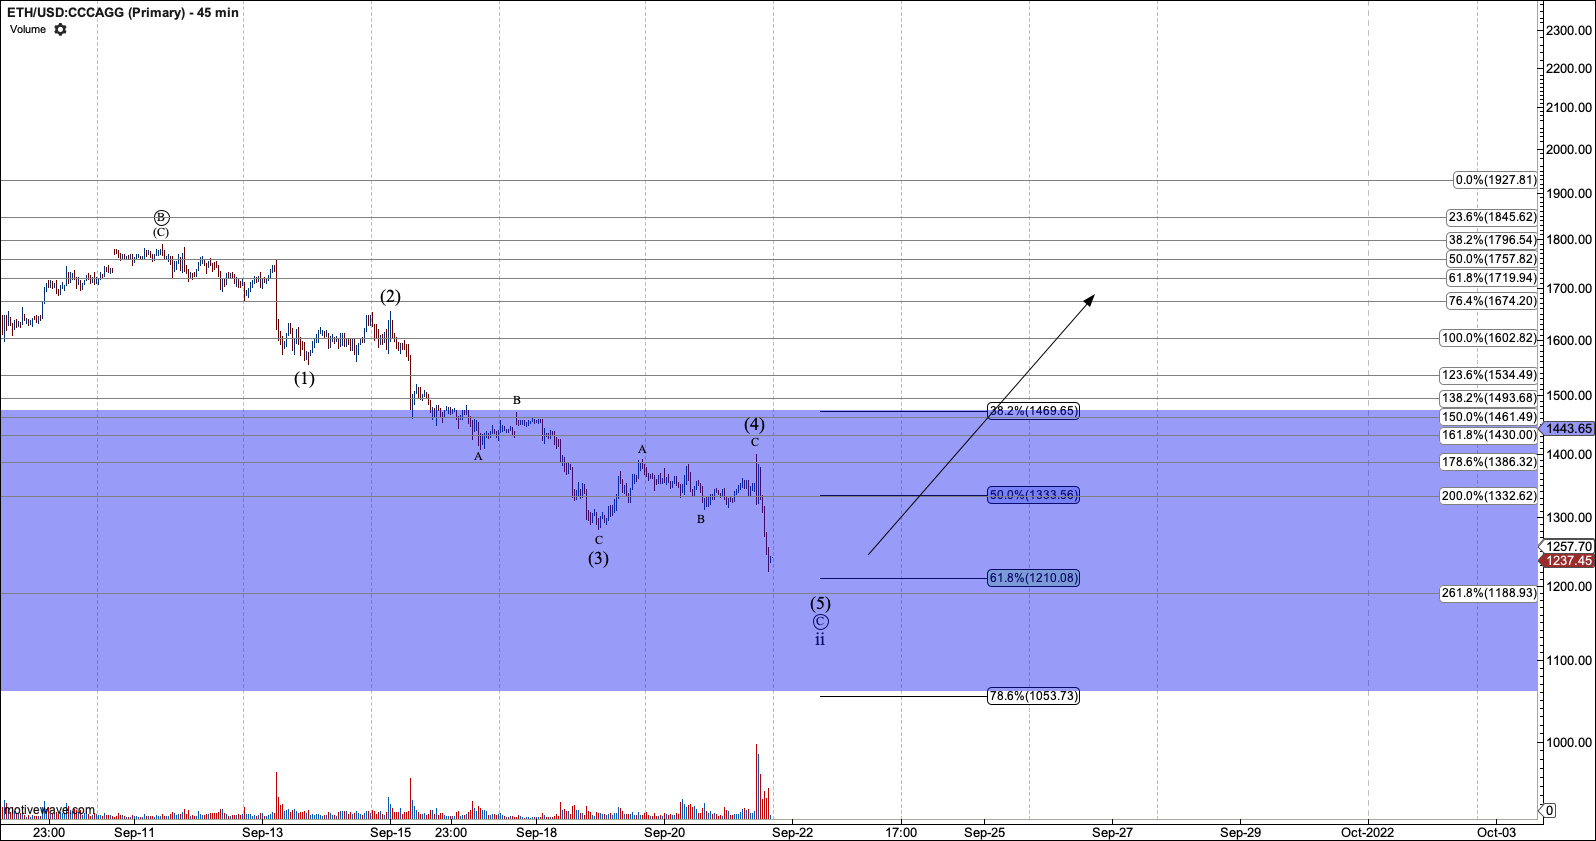
As I have said emphatically in the past, there’s never a guarantee that our support zones will hold. However, by patiently waiting for the right structure, we can take a trade with a solid risk-to-reward ratio. And we can size our position such that breaking support causes us little pain. If we start to see the market react to the support region we can build on a winning trade.
Bitcoin’s Slim Chance
The only way that Bitcoin can go from here to our $100K target without a new low is via a truncated low. A truncated low is where the fifth wave of the C wave doesn’t breach the previous third wave’s bottom. This is shown in the chart below. However, this is a very rare pattern and always requires a market to prove it out.
For Bitcoin, breaking above $23,000 would help the case for truncation. However, Bitcoin has never sustained over the resistance for a fourth wave, unlike Ether. That resistance is at $25K, and it can always send Bitcoin back for another try at a full and complete fifth wave. Bitcoin obviously has a lot of work to do to reverse itself out of a bear trend.
Bitcoin’s daily chart showing what a truncated low looks like. (Produced by author with Motivewave Software.)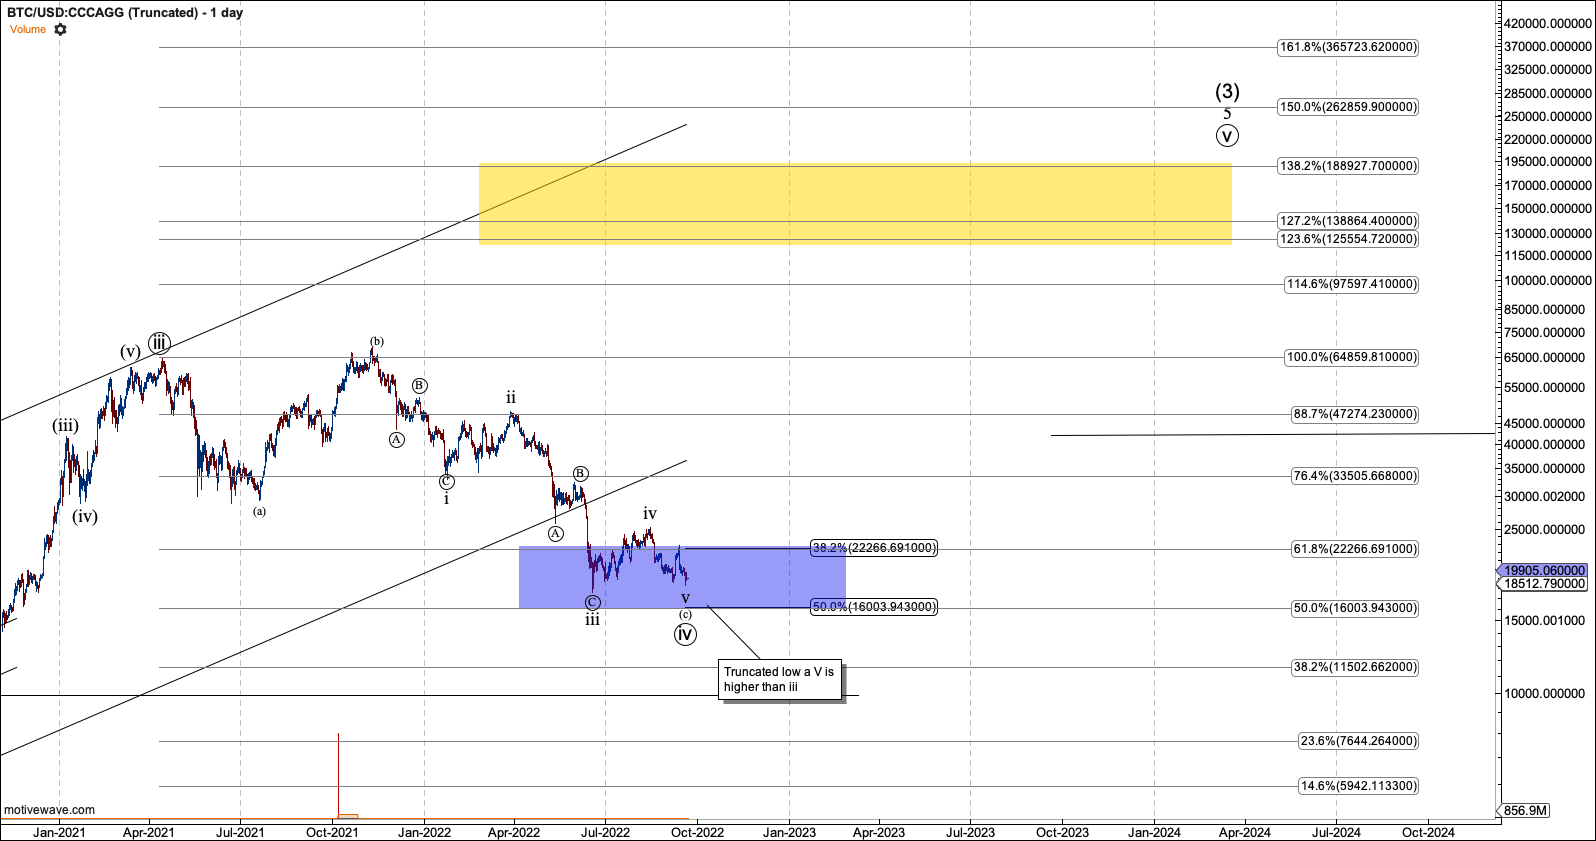
Conclusion
So, here we have the recipe for Ether and Bitcoin to part ways. Ether is poised very bullishly, while Bitcoin has been unable to move over any key levels of resistance in a sustained manner. This means that the monies you are allocating to swing trading cryptocurrencies are better spent on Ether than Bitcoin.
Ether’s support level for a higher low is just below the current price, which is $1350, as of writing. Bitcoin, on the other hand, could turn into a hot knife, ready to pierce its June low. And once it falls below $16K, it could fall further.
Be the first to comment