

janiecbros
Investment Summary
I am re-rating Bio-Techne Corp. (NASDAQ:TECH) following my previous analysis, with the view the market has over-extended its selloff of the stock. After reaching new lows in FY22, the downside move for TECH looks to have exhausted, and there are now several factors of confluence to suggest TECH is seriously worth looking at.
Net-net, I rate the stock a buy and have observed several data points that indicate trends may be reversing for TECH. Key risks to the thesis involve price action, as investors may continue unloading shares amid a plethora of systematic risks. However, recent market activity suggests otherwise. Hence, I’m rating TECH a speculative buy, with a target range of $334-$369.
Q1 earnings unhinged from long-term trends
Quarterly numbers came in strong for TECH in Q1 with the company posting a good start to fiscal FY23. Revenue of c.$270mm grew 500bps YoY, and factored in a 300bps forex headwind at the top-line.
Alas, gross margin also compressed 30bps to 70.9% from the forex impact. Moving down the P&L, and TECH lost some leverage at the SG&A line with a ~120bps YoY increase from wage inflation. Meanwhile, R&D margin was 8.9% to $23.9mm and was a step up from $21.6mm last year.
TECH also recognized a 300bps YoY headwind to operating margin to 34.8%. However, this stemmed largely from cash and non-cash [amortized] costs associated with the Namocell, Inc. investment. Even still, net earnings were strong with a 28.8% YoY growth in EPS to $2.28 and $2.21 fully diluted.
It must be noted however that the jump in earnings stemmed from TECH recognizing $47.4mm in non-operating comprehensive income. Specifically, it booked a $13.98mm income tax benefit, and $50.7mm [gross] from the combined sales ChemoCentryx and Eminence.
Diving a little deeper, we see TECH continues to demonstrate adequate return on its investments. As noted in Exhibit 1, NOPAT generated from intangible investments remains within an extended uptrend from FY16. I’ve capitalized R&D expenditure in this series, such that R&D is recognized as an intangible investment with a straight line amortization schedule.
Exhibit 1. R&D investment continuing to generate tangible value in ratcheting up NOPAT
Image: HB Insights, TECH SEC Filings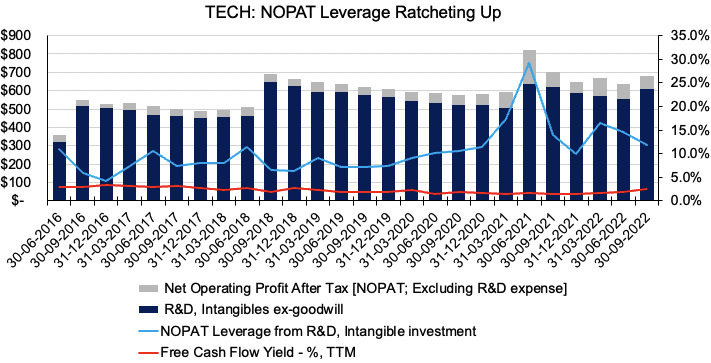
The same is observed with investments made within TECH’s capital budgeting cycle, as noted below [Exhibit 2]. What’s noted from Exhibits 1 and 2 is the fact that TECH’s capital intensity has drifted lower from highs in FY21, and even pulled back toward pre-pandemic ranges. This has implications on the company’s ability to compound capital tracking forward. Return on invested capital (“ROIC”) – both tangible and intangible – has trended up for TECH on a sequential basis [on average], and now comfortably outpaces the WACC hurdle of 8.25% at 15.2% ROIC on a TTM basis.
Exhibit 2. Also capturing return from capital investment [ex-intangible] whilst capital intensity flattening
Data: HB Insights, TECH SEC Filings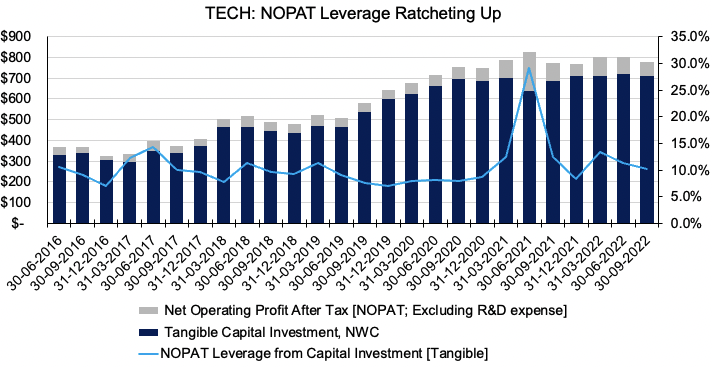
Putting this in context, we see the marriage between TECH’s FCF conversion and its return on investments, in Exhibit 3. Noteworthy is the uptrend in ROIC whilst FCF itself remains in a cyclical uptrend. What’s most pleasing to see is in periods where FCF saw an outflow or pulled down to range, ROIC saw a corresponding uptick. This tells me of management’s proficiency in capital budgeting and ability to allocate capital successfully. It also shows of TECH’s ability to generate income below the top-line.
Exhibit 3. In periods of FCF outflow/decline, ROIC will drift higher for TECH, indicating successful strategy in each capital budgeting cycle.
Data: HB Insights, TECH SEC Filings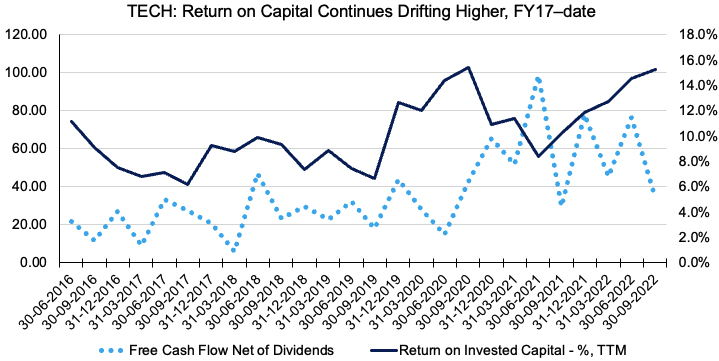
TECH market observations to guide investment reasoning
As seen in the chart below, showing weekly bars, TECH has traded within a continued downtrend from FY21 highs to date. Despite several recovery attempts, shares have consolidated on each occasion, forming a wide, loose base between each leg to the downside [as shown by red trend lines below].
Coupled with each attempted rally [4 attempts] there’s been a notable display of weakness in weekly volume. As shares tested the 50DMA, the poor volume coupled with sideways price action confirmed to me heavy resistance at each occasion. This indicated a lack of buying support. Therefore, breakout above previous levels appeared unlikely.
Exhibit 4. Price action at each base/top stopped by poor volume that continued to weaken with each attempted rally
Data: Updata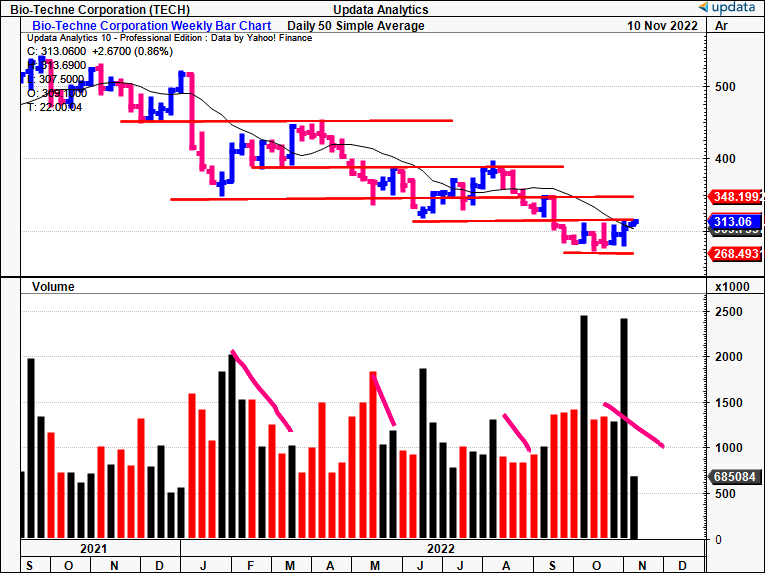
Turning to the latest move, the setup looks notably different. The base is far tighter and price action between each open/close has been equally tighter, as shares have drifted sideways for 7 [and a half] weeks and now test the 50DMA again. Except this time, coming into the move, we have ascending volume following by upward volume spike that was 84% above the last 3 closing weeks. This trend also surpassed the 10-week average and was backed up by a large volume lift last week as well. A closer inspection of this market activity is seen in Exhibit 6.
Hence my estimation is that there is more support at this level for TECH than in the previous 4 attempted moves back to the upside.
Exhibit 5. Latest reversal gaining far greater volume entering the move and has pushed back above the 50DMA [weekly chart shown].
Data: Updata
Exhibit 6. Closer examination of action described above. Note volume trend surpassing 10-week average
Data: Updata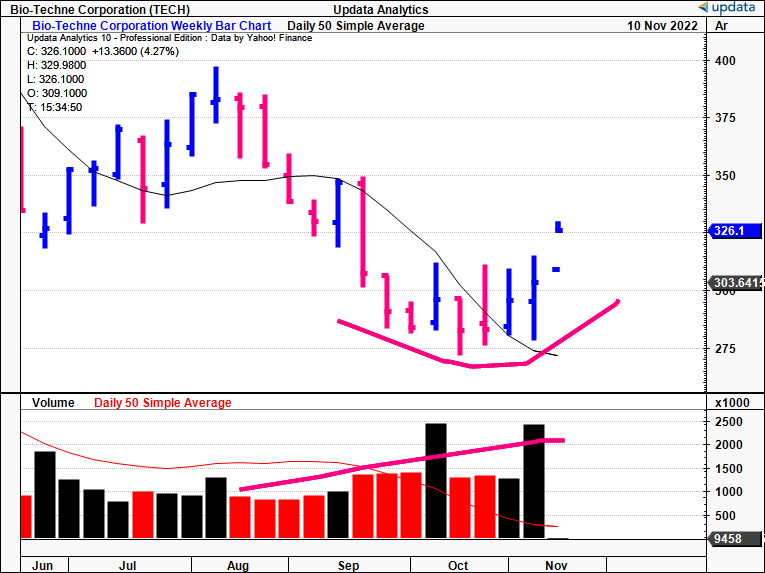
TECH technicals for additional price visibility
Price visibility for a potential upside move is enhanced when observing daily market activity from October-date. Shown on the chart below is the downside move from $397 to the bottom of $271 achieved in October [daily bars].
Tracing the fibs down from top-bottom of the downside, we see that TECH has already begun to reclaim ~38% of this move, with deep bullish candles backed by gaining volume. TECH is now charging toward $334, roughly 50% of the retracement and would look to $349 if completing this objective.
Exhibit 7. Pushing to $334 and then $349 if meeting this objective
Data: Updata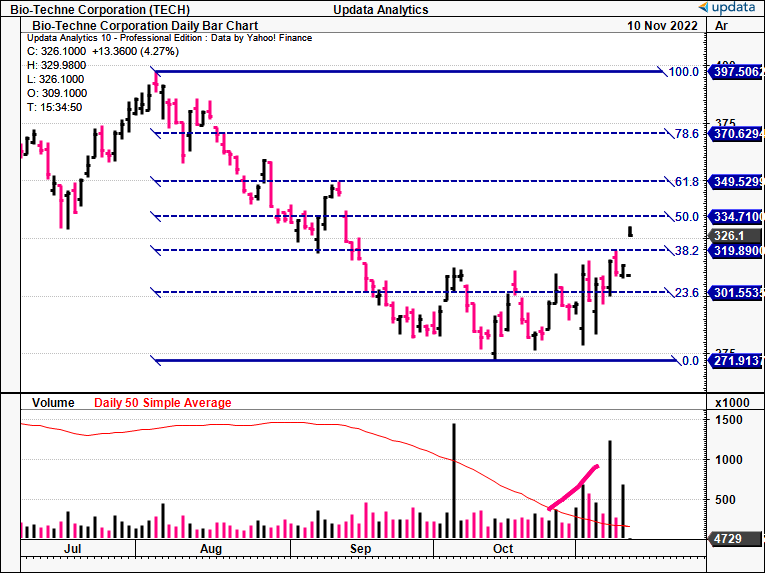
Shares are also pushing back into cloud support with the lag line turning off its low, as seen on the 6month daily cloud chart below. Backing the move is the reversal in on-balance volume that started in October and seen OBV return to range
Momentum has also pulled up from 52-week lows and drifting to levels seen at TECH’s previous July/August highs. The roof of the cloud points to $340-$345 and if OBV and momentum remain elevated there’s good confluence for this move, coupled with price action seen above.
Exhibit 8. Pushing toward cloud support
Data: Updata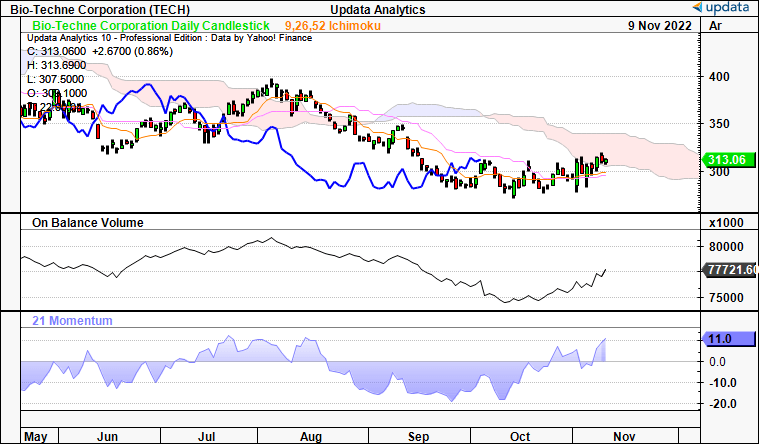
Point & figure charting points to an upside target of $336, in range with key levels shown above. Price distribution looks to have bottomed with prices now mean reverting and must break through the series of resistance lines shown in Exhibit 8 in order for a breakout.
In any sense, there seems to be good technical support for a price objective around $334-$336.
Exhibit 9. Upside target to $336.
Data: Updata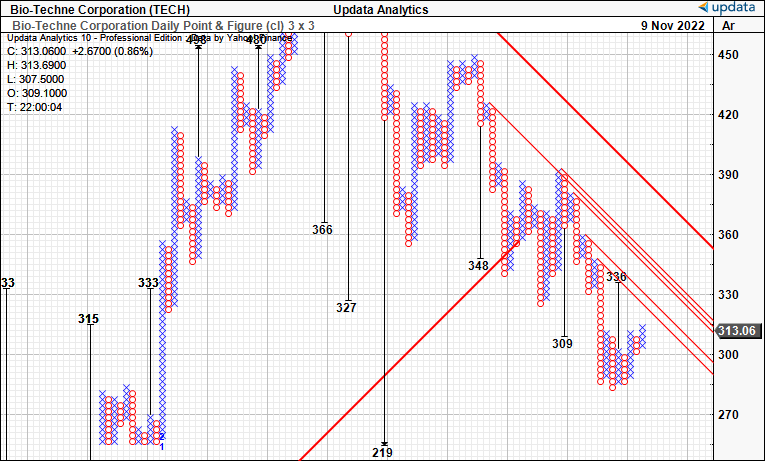
Valuation and conclusion
Shares are richly priced at 43x earnings and 7x book value, with a trailing return on equity of 16.7%. As seen below, the level of cash backing TECH’s valuation has varied over years, and the CFFO to net income ratio fell below 1x last quarter. It remains at 1.14x on TTM values. Looking ahead, we see similar trends occurring, and envision EPS upside of ~560bps YoY to $8.30 in FY22. This is important as it gives confidence is using forward earnings to value TECH.
Exhibit 10.
Data: HB Insights, TECH SEC Filings
As seen below, at FY22 EPS estimates of $8.33 I see shares trading at a fair value of 44x forward earnings and this prices TECH at $369. I believe that if the market recognizes TECH’s bottom-line EPS growth this could be a reasonable price objective.
Exhibit 11.
Data: HB Insights Estimates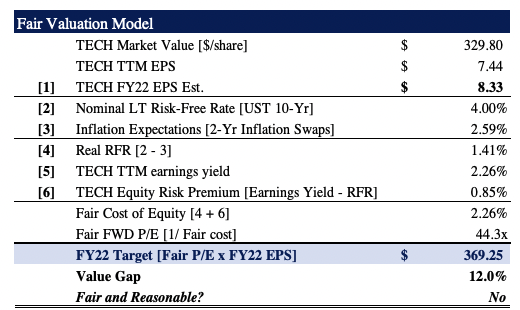
Net-net, there’s gathering evidence to suggest that TECH is heading into a buy zone. There’s risk the thesis won’t play out from a price action perspective, but I believe there’s several factors of confluence to suggest prices could trend back to long-term range. That would mean a walk to $334-$349, then an upside fundamental target of $369. Rate buy.
Be the first to comment