

Bryan Bedder
Written by George Spritzer, co-produced by Alpha Gen Capital
Author’s note: This article was released to Yield Hunting members on August 23rd, 2022. Please check latest data before investing.
Back in 2017, I last wrote an article on Pershing Square Holdings, the Bill Ackman hedge fund. The fund trades under the ticker PSH on the London exchange and the Euronext Amsterdam exchange. But it is also available as an ADR in the US under the ticker (OTCPK:PSHZF).
In 2017, the price was around $13 with a 23% discount and Bill Ackman’s fund was having a few rough years. In 2018, the fund was roughly flat, in line with the overall markets, but it came roaring back with very strong performance in 2019, 2020 and 2021. In 2021, the fund traded above $40 although the discount never narrowed much. The NAV rose above $57 which is the new high water mark.
In 2022, there is now another opportunity to buy PSHZF at a good price and I thought I would re-visit this fund. The price has dipped below $32 and the discount has widened out to an incredible 35% on August 16.
Fund Performance
The Pershing Square Capital L.P. produced outstanding returns from 2004 through 2011. Since PSH was publicly traded in 2014, it has lagged the S&P 500 benchmark because of three bad years from 2015 to 2017 when the fund lost money on some short sales, and was using more of an “activist” approach.
But based on Bloomberg data over the last five years, PSH has the best five-year NAV return of the 100 largest closed-end equity funds in the world since adopting its new strategy. This list includes funds ranging from $776 million to $16.6 billion in net asset value. You can see this table of the 100 largest closed-end equity funds as Appendix A in the PSH semi-annual shareholder report.
Here are the annual returns for Pershing Square LP, the Pershing Square fund with the longest track record, along with PSH, for the years 2004-2022:
PSH Historical Returns (Pershing Square Web site) PSH Performance Graph (Pershing Square web site)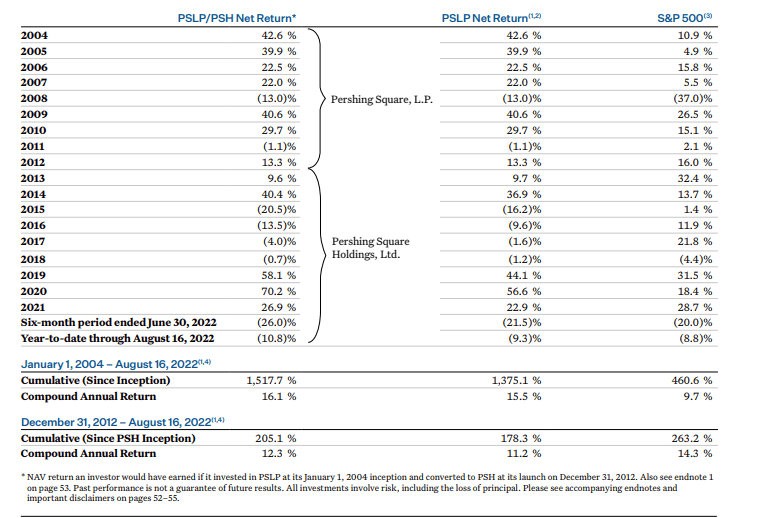
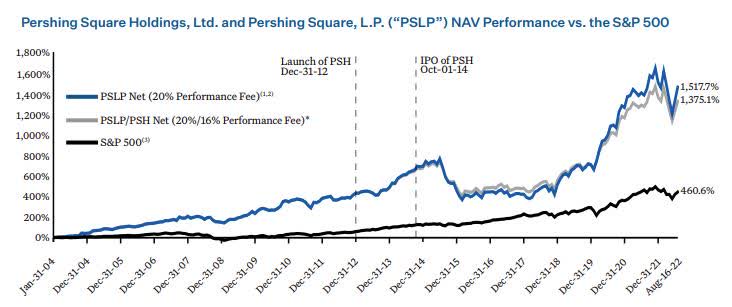
(Source: 2022 Pershing Square Holdings Semi-Annual Report)
Portfolio Review
Pershing currently runs a highly concentrated portfolio. Their objective is to invest in durable, well-capitalized, high quality growth businesses with limited downside and which generate recurring and predictable cash flows. They also look for opportunities to enhance profit from carefully selected hedging transactions.
Here are some excerpts about the current portfolio holdings from the semi-annual shareholder report.
1) Universal Music Group (OTCPK:UMGNF)
We believe that UMG’s decades-long runway for growth remains underappreciated by investors. With increasing streaming penetration combined with the development of new services, platforms, and business models, UMG can grow revenues at an annual rate of 10% or so for more than a decade. High absolute levels of revenue growth coupled with UMG’s fixed cost base should allow UMG to significantly expand its operating margins over time, generating highly attractive earnings growth for the foreseeable future. UMG’s recent results support our longer-term view, as year-to-date, revenues and profits both increased at a mid-teens growth rate, well above analyst expectations and the company’s guidance during last year’s Capital Markets day. When viewed on a multi-year basis, UMG’s revenue growth has both been higher and more consistent than Warner Music Group, its most closely followed peer.[…]
Bill recently joined the UMG board and we look forward to working even more closely with the company as an engaged long-term shareholder. Given its long runway for sustained earnings growth, we believe that UMG’s current valuation represents a significant discount to intrinsic value.
2) Restaurant Brands International Inc. (QSR)
QSR’s franchised business model is a high-quality, capital-light, growing annuity that generates high-margin brand royalty fees from its four leading brands: Burger King, Tim Hortons, Popeyes, and Firehouse Subs.[…]
QSR continues to trade at a discount to its peers and its intrinsic value. The company has repurchased more than 3% of its shares outstanding over the last twelve months, which when coupled with its 4% dividend yield, enables QSR to return approximately 7% of its market capitalization to shareholders on an annual basis.
3) Chipotle Mexican Grill, Inc. (CMG)
Chipotle continued its impressive performance in 2022 driven by the ongoing recovery of in-restaurant sales, price increases to cover cost inflation, and successful menu innovation including pollo asado. During the second quarter, Chipotle continued to lead the restaurant industry in growth for both same-store sales (“SSS”) and new restaurants, with SSS growing 10% year-over-year or 30% on a three-year cumulative basis. On-premise sales grew 36% as consumers resumed pre-pandemic routines, while digital sales declined only 3%, continuing their persistence despite the growth of conventional sales. Chipotle remains on track to grow its store base by approximately 8% this year with a longer-term annual store growth aspiration of nearly 10% once current headwinds around construction, permitting, and supplies ease.[…]
Chipotle’s economic model remains firmly intact, with restaurant-level margins in excess of 25% in the second quarter, up 0.8% year-over-year, and a consistent level of profitability expected for the current quarter. The company is debt-free and generates nearly all its sales in the U.S., insulating its earnings from the foreign currency headwinds facing many other large consumer companies.
4) Hilton (HLT)
Hilton is a high-quality, asset-light, high-margin business with significant long-term growth potential, led by a superb management team. The unforeseen arrival of the COVID-19 pandemic catalyzed a rapid and near-complete standstill in global travel, with RevPAR (the industry metric for same-store sales at a given hotel) down roughly 90% at the nadir of the pandemic. We increased our investment in Hilton during the pandemic as we believed the economic dislocation from COVID-19 would prove to be transient and that industry projections regarding the timeline for recovery were too pessimistic.[…]
Despite Hilton’s accelerated near-term growth prospects and attractive long-term earnings algorithm, the stock is attractively priced at a low-20s multiple of 2023 earnings. We find Hilton’s valuation to be compelling given its industry-leading competitive position, superb management team, attractive long-term net unit growth algorithm, pricing power, and best-in-class capital return policy.
5) Lowe’s (LOW)
Lowe’s is a high-quality business with significant long-term earnings growth potential underpinned by a superb management team that is successfully executing a multi-faceted business transformation.[…]
Lowe’s operational transformation is further magnified by its aggressive share repurchase program, which is likely to see the company acquire a high-single-digit percentage of its market capitalization in this year alone. The materiality of Lowe’s Perpetual Productivity Initiative was on full display in their most recent quarter, whereby the company leveraged fixed expenses by 80 basis points, driving 10% earnings-per-share growth notwithstanding flat top line growth. The successful execution of Lowe’s continued business transformation should allow the company to generate accelerated earnings growth for the foreseeable future.
Notwithstanding our view on Lowe’s attractive long-term earnings outlook, Lowe’s currently trades at only 15 times forward earnings, a low valuation for a business of this quality, and a substantial discount to its direct competitor. We believe the current valuation reflects investors negative sentiment regarding the US housing market and incorporates the possibility of a greater than expected revenue decline. We believe the current valuation is highly attractive and anticipate Lowe’s will generate high rates of returns from current levels if as we expect it continues to successfully execute the company’s transformation.
6) Canadian Pacific Railway (CP)
CP is a high-quality, inflation-protected business led by a best-in-class management team that operates in an oligopolistic industry with significant barriers to entry. With an improving volume and pricing outlook combined with the upcoming transformational acquisition of Kansas City Southern (“KCS”), we believe that CP’s prospects are bright.[…]
CP’s pending acquisition of KCS remains on track as the Surface Transportation Board’s likely approval approaches. Based on the Board’s updated procedural schedule, if all goes as expected, CP will gain operational control of KCS by the first quarter of 2023 at the latest. In the meantime, CP and KCS are preparing for synergies by holding productive discussions with potential customers, running proof of concept trains, and making capacity investments. By creating the only direct route from Canada to Mexico, the procompetitive merger offers shippers the unrivaled speed and service that is sorely needed to help ease supply chain congestion. We are confident in management’s ability to achieve its revenue and cost synergy targets and create value for all stakeholders.
While CP’s year-to-date results reflect its strong business performance and favorable outlook, we believe CP’s current valuation represents a meaningful discount to intrinsic value in light of the company’s high-quality business model and long-term growth potential.
7) The Howard Hughes Corporation (HHC)
HHC’s portfolio of well-located residential land and income-producing commercial assets continues to demonstrate resilient performance despite recent macro concerns of a slowdown in the housing market. The company’s advantaged business model of owning master planned communities (“MPCs”) provides HHC substantial control over the planning and release of land for sale and development, enabling it to take a long-term approach to maximizing the value of its portfolio. As a result of its outright ownership of thousands of acres of conservatively financed land and a management team that combines superb capital allocation and development skills, the company is much less exposed to the cyclicality of standalone, smaller-scale real estate development companies.[…]
While the company has made significant progress in simplifying its business and has a substantial runway for long-term value creation, we continue to believe its current share price is at a deep discount to its intrinsic value. The company has been able to capitalize on this discounted valuation by aggressively repurchasing its shares. Year to date, HHC has repurchased approximately 8% of its outstanding share count, funded by cash flow from operations and non-core asset sales. We believe HHC is extremely well positioned for the current inflationary environment due to its combination of high quality real estate assets and a largely fixed-rate liability structure. We expect the company to benefit from substantial land price appreciation and rental income growth in the coming years.
8) Fannie Mae (OTCQB:FNMA) / Freddie Mac (OTCQB:FMCC)
There have been no material updates for Fannie Mae and Freddie Mac in 2022. Both entities continue to build capital through retained earnings and now hold combined capital of $91 billion, up from nearly zero. As we have stated previously, as principally common shareholders (we own a small amount of preferred stock), we own valuable perpetual options on both entities that over the long term we believe will be worth many multiples of today’s prices once re-privatization occurs.
Investment Management Fees – High Water Mark
The terms of the investment management agreement are lower than the usual 2%/20% charged by many other hedge funds. Pershing charges a 1.5% management fee and a 16% performance fee.
The terms of the fund’s management agreement with Pershing Square Capital Management have a “high water mark” feature such that investors only pay performance fees on increases in NAV above the highest NAV at which a performance fee has previously been charged.
As a result, investors in the fund now will not incur any performance fees until the NAV of the fund exceeds the high water mark which is currently around $57 per share. Note that the current NAV on August 16 was reported at $50.90. The high water mark is adjusted for distributions, so the value dropped slightly because of the recent $0.125 quarterly dividend.
Pershing Square Bonds
The fund has access to low-cost unsecured investment-grade fixed rate leverage without mark-to-mark covenants.
About 19% of PSH total assets is funded by long-term bonds with laddered maturities from 2027 through 2039. The weighted-average interest rate is 3.1%. The leverage is conservative given the fact that the PSHZF portfolio is highly liquid and easy to value.
PSHZF Bonds (Pershing Square web site)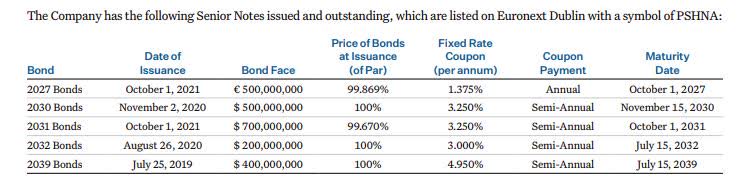
Recent Share Buyback Activity
In May,2022, PSHZF determined that it was appropriate to initiate a share buyback program. The initial $100 million program has since been extended by an additional $200 million. PSH completed the $100 million program having repurchased 3,245,831 PSH Public Shares at an average discount of 31.7%. In 2022 alone, the share buyback accretion has added about 60 basis points to the NAV performance.
PSHZF reports its share buyback activity on a regular basis. Here is a chart showing the share buyback activity for the last two days expressed in US dollar terms:
|
Date |
London Shares |
London Average Price |
Euronext Amsterdam Shares |
Euronext Amsterdam Average price |
NAV |
|
08/23/2022 |
41,374 |
$31.73 |
13,165 |
$31.64 |
$50.90 |
|
08/22/2022 |
41,591 |
$31.86 |
13,489 |
$31.86 |
$50.90 |
PSH has repurchased 22.5% of its shares outstanding since its IPO, a total of 54 million shares at a price of $17.32 and at an average discount of 27.1%.
Pershing Square Holdings (OTCPK:PSHZF):
- Launch Date: Jan 1, 2013
- Total Assets = $ 11.8 Billion
- Total Liabilities = $ 3.5 Billion
- Total Equity = $ 8.3 Billion
- Last Dividend = $0.125 (quarterly)
- Management Fee= 1.50%
- Baseline Expense Ratio= 1.59%
- Discount to NAV= -35%
- Average 6 Month Discount= -29.7%
- NAV Update Frequency: Weekly
- Average Daily Volume of PSHZF= 28,266
- Average Dollar Volume of PSHZF= $900,000
- Leverage: 19%
For most US investors, it is easier to buy the PSHZF ADR than to buy the PSH shares that trade on the London or Euronext Amsterdam exchanges. But the PSHZF ADR is not as liquid as the shares trading in Europe, and the bid-asked spread can be quite wide at times. It is best to be patient and use multiple smaller limit orders when buying the shares.
While PSHZF looks quite attractive here for a purchase, it may be prudent to dollar cost average in because of the overall market conditions. PSHZF can be a good long term “core” holding in your portfolio, but it can also be a good holding for more active traders, especially if you own it in an IRA.
For more active traders, I would use the following signals to trim the position:
– The NAV reaches/exceeds the high water mark. At this point, performance fees kick in, and the shares are not as attractive.
– The fund stops doing share buy backs. This happens periodically and usually signals a good time to trim the position.
– The weekly discount to NAV drops below 23%.
Be the first to comment