


LPETTET
Author’s note: This article was released to CEF/ETF Income Laboratory members on November 25th.
I recently published an article on the SPDR Bloomberg Barclays 1-3 Month T-Bill ETF (NYSEARCA:BIL). While updating some figures I was taken aback by the quantity and complexity of dividend metrics. By my counts, there are at least three different, but standard, ways to measure a fund’s dividend yield, and several niche metrics too. In most cases, these different yields are all reasonably close together. When interest rates move the yields might be very different, as is currently the case. Due to reader interest, thought an article explaining and discussing these metrics might be of use and interest to readers.
The three standard yield metrics are as follows.
TTM Dividend Yield, which measures the dividends paid out by the fund in the prior twelve months. TTM dividend yields are backwards-looking and might not necessarily reflect a fund’s future dividends.
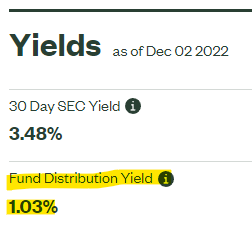
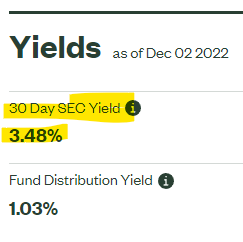
SEC Yield, which measures the income generated by a fund’s underlying holdings in the past 30 days. Funds generally distribute any and all income generated to shareholders as dividends, so SEC yields are much more indicative of the fund income investors should expect moving forward.
Yield to Maturity, which measures the expected returns from holding the fund’s underlying bond holdings until maturity. Equivalent to a bond fund’s long-term expected returns and dividend yield, assuming no portfolio or interest rate movements.
Two other important yields to consider.
Latest dividend payment annualized, which is exactly what it sounds like. Bond dividends have growth YTD, so looking at the latest dividend payment, annualized, seems like a no-brainer.
Interest rate on a fund’s underlying holdings. So, treasury rates for a treasury bond fund, high-yield corporate bond rates for a high-yield corporate bond ETF, etc. Seems pretty self-explanatory.
In my opinion, long-term expected returns are probably the key consideration when selecting a bond fund, so yield to maturity is the most important metric.
With the above in mind, let’s have a closer look at each of these metrics, using BIL as a representative example.
TTM Dividend Yields
Trailing twelve month (TTM) dividend yields measure the dividends paid out by the fund in the prior twelve months. TTM dividend yields are the standard dividend yield metric. In most cases, when sources mention dividend yields, they mean TTM dividend yields. BIL currently yields 1.03%.
BIL
TTM dividend yields are standard, and so provide investors with a simple way to compare yields across investments, securities, and funds.
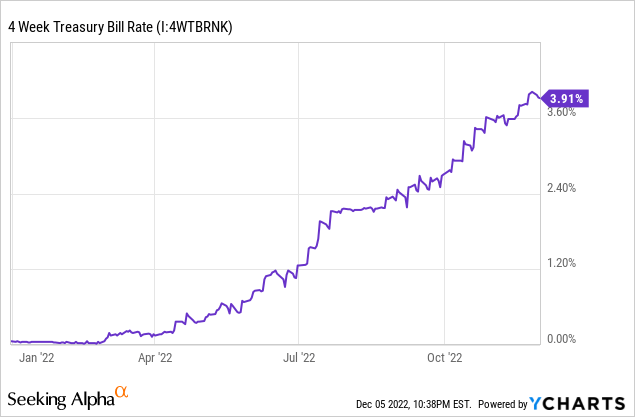
TTM dividend yields are backwards-looking, and so might not necessarily be indicative of future dividends or yields. Just because an investment paid 5.0% in dividends in the past, does not mean that it will pay 5.0% in dividends in the future. Rising interest rates, courtesy of the Federal Reserve, all but ensure that future dividends will materially differ from past ones: bonds pay more in interest today than in the past. 4-week T-bills, for instance, currently yield 3.75%, much higher than BIL’s 1.03% TTM dividend yield.
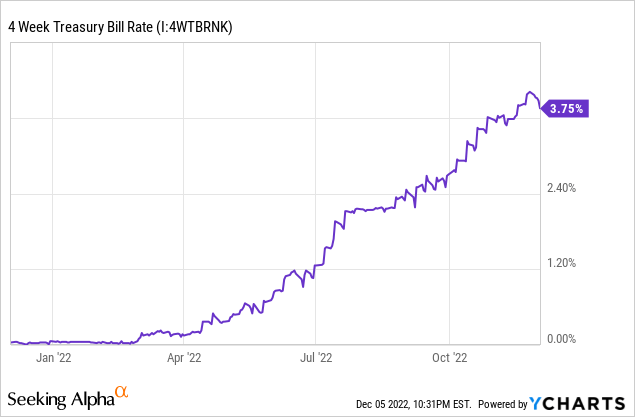
BIL’s TTM dividend yield is much more lower than the interest rate on T-bills, because said yield tracks the dividends paid by the fund in the past twelve months. T-bill interest rates were much lower in the prior month, hence BIL’s lower dividend yield. Looking at the graph above, it seems reasonable to think that T-bills yielded 1.0% on average these past few months. The mid-point is around 1.2%, not too far from 1.0%.
T-bill interest rates should continue to increase in the coming months, due to Federal Reserve interest rate hikes. Due to this, trailing twelve month yields are almost certainly lower than future yields.
TTM dividend yields only take into consideration income, completely disregarding potential capital gains and losses. Bonds currently trade with heavily discounted prices, which should increase as interest rates stabilize, or as bonds mature. Standard dividend yield metrics disregard these potential gains, and so underrate potential total returns for these funds.
In general terms, I don’t personally think that TTM dividend yields are all that important for bond funds right now. Interest rates have simply increased too much for these backwards-looking measures. Still, as these are the standard dividend yield metrics, one almost necessarily has to mention or analyze them.
SEC Yields
SEC yields are standardized measure of a fund’s short-term generation of income. SEC yields are calculated by dividing a fund’s net investment income in the past month over its current share price. For BIL, the calculation is quite simple.
Last month, BIL invested in T-bills which, at the time, yielded around 3.64%.
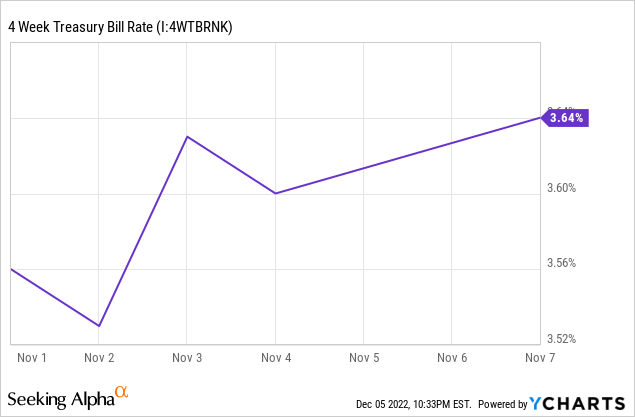
BIL has an expense ratio of 0.14%, for a net investment income of 3.50% over the past month. SEC yields are equivalent to a fund’s net investment income over the past month, so BIL’s SEC yield should be equal / close to 3.50%. BIL’s actual SEC yield is 3.48%, slightly lower than by my calculations, due to rounding error and slight differences in holdings (BIL invests in several different T-bills).
BIL
ETFs almost always distribute any and all net investment income to shareholders as dividends. Due to this, ETF dividend yields tend to increase until they reach their SEC yields, on average, long-term. BIL investors should expect the fund’s dividend yield to increase until it reaches 3.48%, although this will ultimately depend on future interest rate movements.
SEC yields are standard, and so provide investors with a simple way to compare yields across investments, securities, and funds. In fact, SEC yields were explicitly developed by the SEC to ensure that this was the case, making them one of the more objective yield metrics available in the industry.
SEC yields explicitly disregard return of capital distributions and the like, only looking at the actual income received by a fund’s underlying holdings. Due to this, SEC yields are particularly important for CEFs, and for other investment vehicles in which ROC distributions and the like are common.
Exclusively focusing on income is positive, insofar as it avoids unfavorable sources of distributions (return of capital), or somewhat unsustainable ones (trading gains). Exclusively focusing on income is negative, insofar as it avoids favorable sources of distributions (inflation-hedge properties of TIPs) and returns (capital gains from bonds market prices rising as rates stabilize).
SEC yields are a short-term dividend metric, only looking at the net investment income generated in the past month. Short-term metrics are quite volatile, and might not necessarily reflect a fund’s long-term generation of income. This is particularly important for actively-managed funds with high turnover, as their portfolios are in flux, and so their income is too. This is less important for simpler index funds with stable portfolios, including BIL.
In general terms, I think that SEC yields are almost always a very informative, material metric, and one which is particularly relevant right now. Higher interest rates have caused TTM dividend yields to be somewhat outdated, unreliable measures. SEC yields only focus on the income received last month, and so are much more recent, up to date metrics.
Yield to Maturity
Yield to maturity is a measure of the expected total returns of a fund’s underlying bond holdings if held to maturity.
BIL invests in T-bills, which currently yield 3.91%.

If held until maturity, BIL should receive 3.91% in income from its T-bill holdings. In most cases, bonds are income vehicles, whose total returns consist of income and nothing else. Although there are exceptions, BIL is most definitely not an exception: the fund’s total returns should equal its income, 3.91%. BIL’s yield to maturity should, therefore, roughly equal 3.91%. BIL’s actual yield to maturity stands at 4.04%, consistent with these calculations. The fund’s yield to maturity is slightly higher than expected, as the fund invests in a few T-bills with longer maturities than 4 weeks.
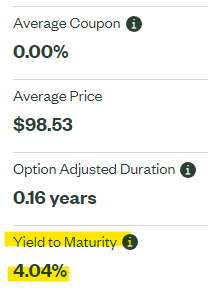
BIL
Yield to maturity considers both income and potential capital gains.
This might be easier to explain with an example.
Let’s say 1Y treasuries are yielding 5.0%. Let’s then say treasury market prices collapse 10%, due to an emergency Federal Reserve hike (stranger things have happened). Even though market prices have decreased, treasury investors are still set to receive 100% of their capital once their treasuries mature, recovering from their 10% losses. In this scenario, after treasury prices have collapsed, these securities would sport yield to maturities of around 15.0%, 10.0% from the expected recovery at maturity, and 5.0% from their yield.
Although T-bill prices have not decreased recently, prices for most bonds have, due to skyrocketing interest rates. Due to this, most bonds and bond funds sport very strong, above-average yield to maturities.
Yield to maturity figures are forward-looking, which is particularly important when making investment decisions. It does not truly matter what BIL yielding in the past, it matters what BIL will yield in the future, and yield to maturity is much more indicative of the latter than other yield metrics.
Yield to maturity figures assume that bonds are held to maturity, which might not necessarily be a reasonable assumption. Portfolios change, especially in actively-managed funds.
Yield to maturity figures consider both income and capital gains, which has its positives and negatives. Including potential capital gains means this metric is broader, and allows investors to have a clearer idea of the expected returns of a bond fund. Including potential capital gains does mean that yield to maturity figures might consistently differ from other yield metrics, which do not include capital gains.
In my opinion, yield to maturity is the most informative, important yield metric right now. Interest rates have skyrocketed in the recent past, so TTM dividend yields are excessively outdated, and not reflective of the dividends that investors should expect moving forward. Similar situation for SEC yields, but significantly less so. Yield to maturity is a more forward-looking measure, so avoids these issues. Skyrocketing interest rates have also caused bond prices to plummet, which should lead to relatively large capital gains at maturity for bond investors. Yield to maturity includes these potential capital gains, other yield metrics do not, to their detriment.
Other Yield Metrics to Consider
Finally, a quick look at two more niche yield metrics which investors might find of interest or use.
As interest rates skyrocket, many bond funds have seen significant dividend growth, with recent dividend payments vastly outpacing older ones. One could take the latest monthly payment of a bond fund, annualize it, and arrive at a more recent dividend yield metric. BIL, for instance, paid a $0.26 dividend earlier in the month. Annualizing said payment, one arrives at a $3.12 annualized dividend payment, for a 3.4% annualized dividend yield.
Annualizing a fund’s latest monthly dividend payment is not a standard yield metric, but it is one which I’ve found to be of use in the past. Some bond funds have seen very signifcant dividend growth in the recent past, and the metric above can be used to estimate said growth. BIL, for instance, paid 1.03% in dividends last year, but 3.4% last month, annualized. Very healthy growth, and somewhat indicative of the growth investors should expect moving forward, contingent on further hikes, of course.
Investors can also look at the interest rate on the underlying holdings of a bond fund. Doing so is quite easy for most bond index funds. In BIL’s case, one would simply need to look at the interest rate on T-bills. I’ve done so several times throughout the article but, for reference, T-bills currently yield 3.91%.
BIL invests in T-bills, so the fund’s yield should match the interest rate on said securities moving forward. The same is true for almost all bond funds in the market.
Yields for Select Bond ETFs
Finally, a quick table with dividend yields for some of the larger bond index funds in the market. I’ve excluded the interest rate on the underlying holdings of the Vanguard Total Bond Market ETF (BND), as that fund is a diversified bond ETF, with investments in many different asset classes.
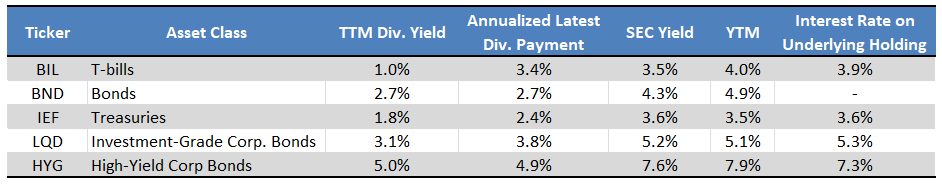
Fund Filings – Chart by Author
Conclusion
There are several ways to measure a fund’s dividend yield, each with its own set of characteristics. I’ve briefly covered some of these in this article; hopefully, the information was of use and interest to readers and investors.
Be the first to comment