

gorodenkoff
A Quick Take On BigCommerce
BigCommerce (NASDAQ:BIGC) went public in August 2020, raising $216 million in gross proceeds in an IPO that was priced at $24.00 per share.
The firm provides a SaaS platform that enables merchants to incorporate various ecommerce and related functionalities to create online stores.
With increasing operating losses, a slower enterprise revenue ramp and a questionable macroeconomic environment, I’m on Hold for BIGC in the near term.
BigCommerce Overview
Austin, Texas-based BigCommerce was founded to develop e-commerce software delivered as a SaaS platform for online retailers.
Management is headed by President, CEO and Chairman Mr. Brent Bellm, who has been with the firm since June 2015 and was previously President and COO of HomeAway, a vacation rental online marketplace.
The firm has developed a robust partner program for both Agency partners and Technology partners.
The firm’s primary uses cases include:
-
Headless Commerce
-
B2B
-
Wholesale
-
Multi-Channel
-
International
Industries the company’s software serves include:
-
Apparel & Fashion
-
Health & Beauty
-
Food & Beverage
-
Manufacturing
-
Automotive
The firm originally launched with a focus on the SMB market, with a self-serve website-based service.
Since then, the firm has transitioned to a much broader approach, expanding its focus to include larger enterprises.
BigCommerce’s Market & Competition
According to a 2020 market research report by Grand View Research, the global market for e-commerce software was valued at $6.2 billion in 2019 and is expected to reach $18 billion by 2027.
This represents a forecast very strong CAGR of 16.3% from 2020 to 2027.
The main drivers for this expected growth are an increase in e-commerce capabilities to assist enterprises in automating core business functions while increasing the leverage firms have as consumers increasingly adopt online shopping for goods and services.
Also, firms that utilize APIs (Application Programming Interface) enable companies to employ low-code solutions to quickly modernize their existing systems.
Major competitive or other industry participants include:
- Magento
- Salesforce
- Shopify
- WooCommerce
- Amazon
- Numerous smaller platforms
BigCommerce’s Recent Financial Performance
-
Total revenue by quarter has risen per the following chart:
9 Quarter Total Revenue (Financial Modeling Prep)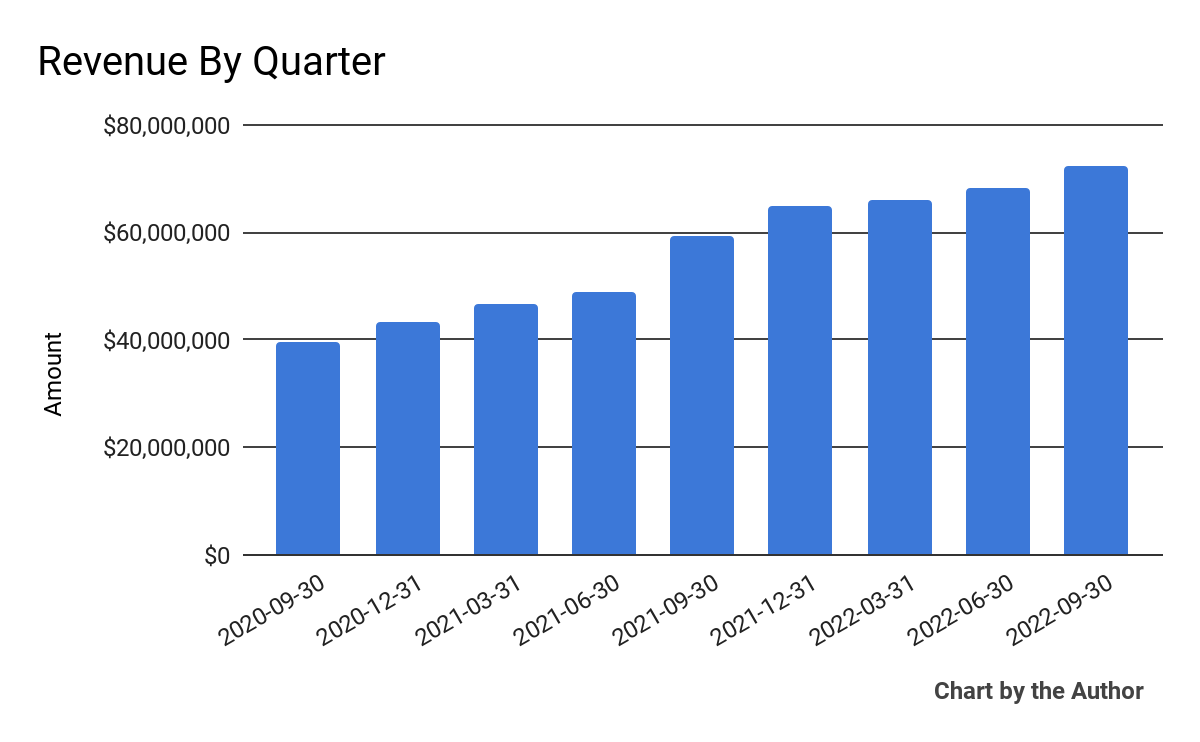
-
Gross profit margin by quarter has trended lower in recent quarters:
9 Quarter Gross Profit Margin (Financial Modeling Prep)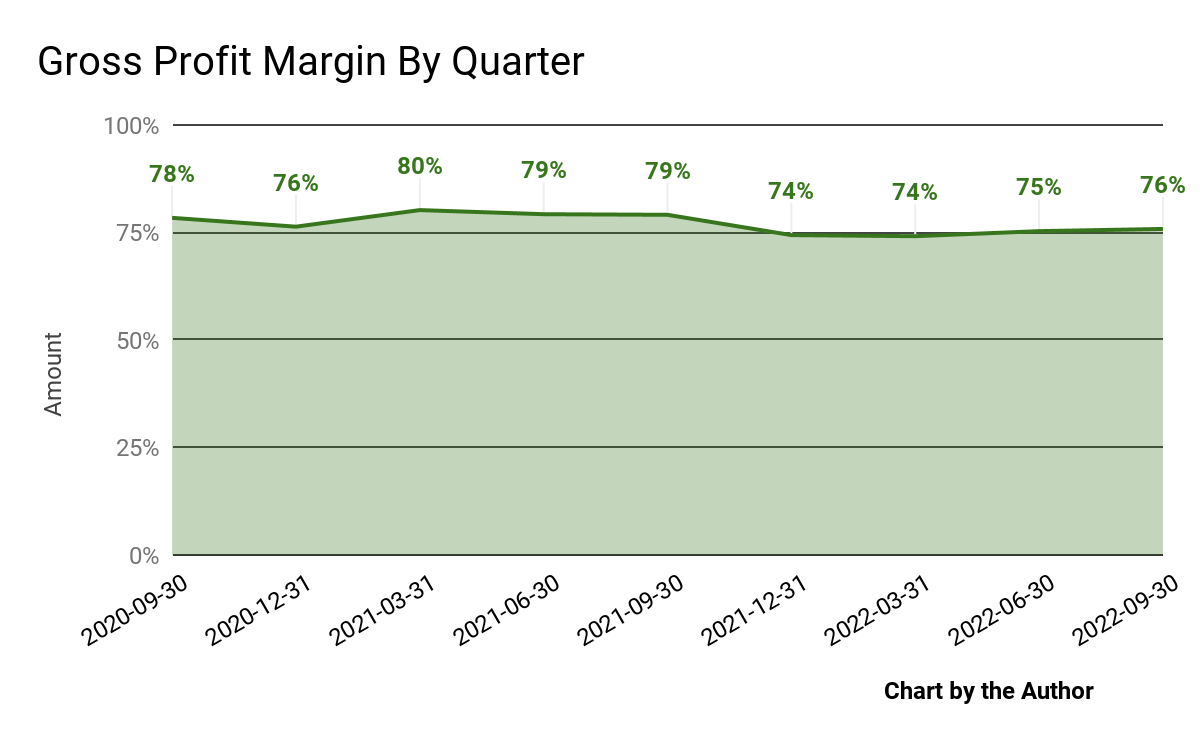
-
Selling, G&A expenses as a percentage of total revenue by quarter have increased in recent reporting periods:
9 Quarter Selling, G&A % Of Revenue (Financial Modeling Prep)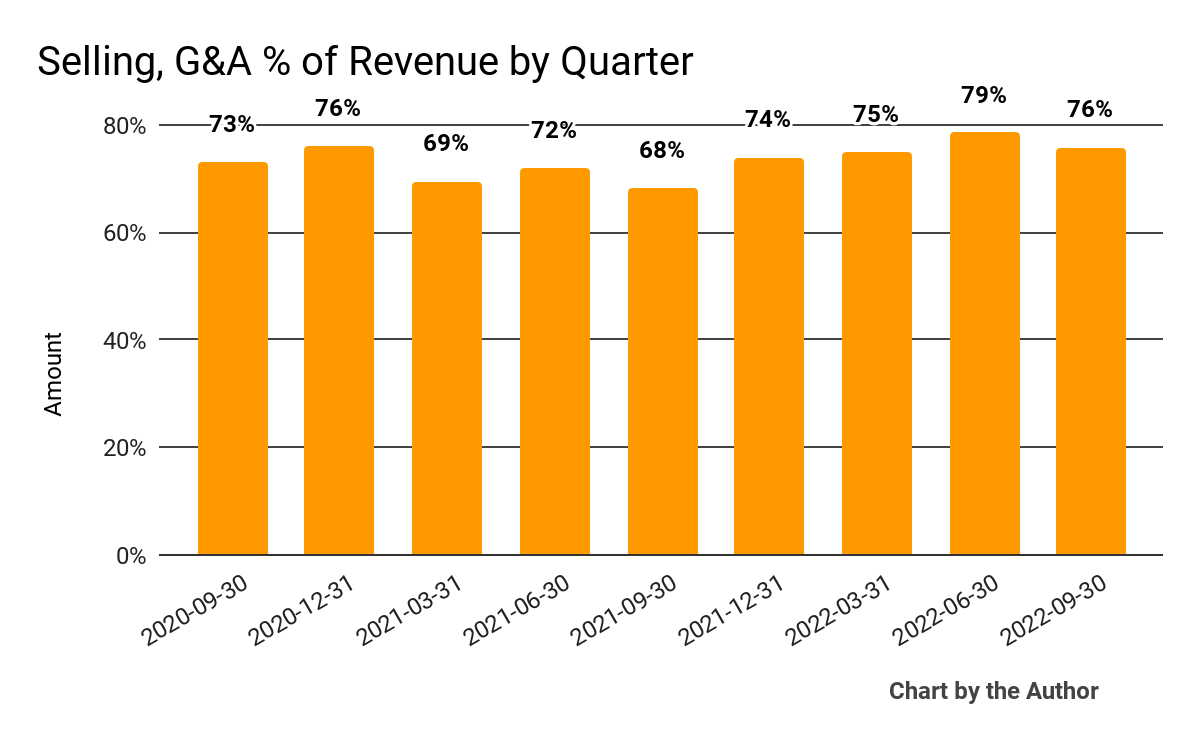
-
Operating losses by quarter have worsened recently, as the chart shows here:
9 Quarter Operating Income (Financial Modeling Prep)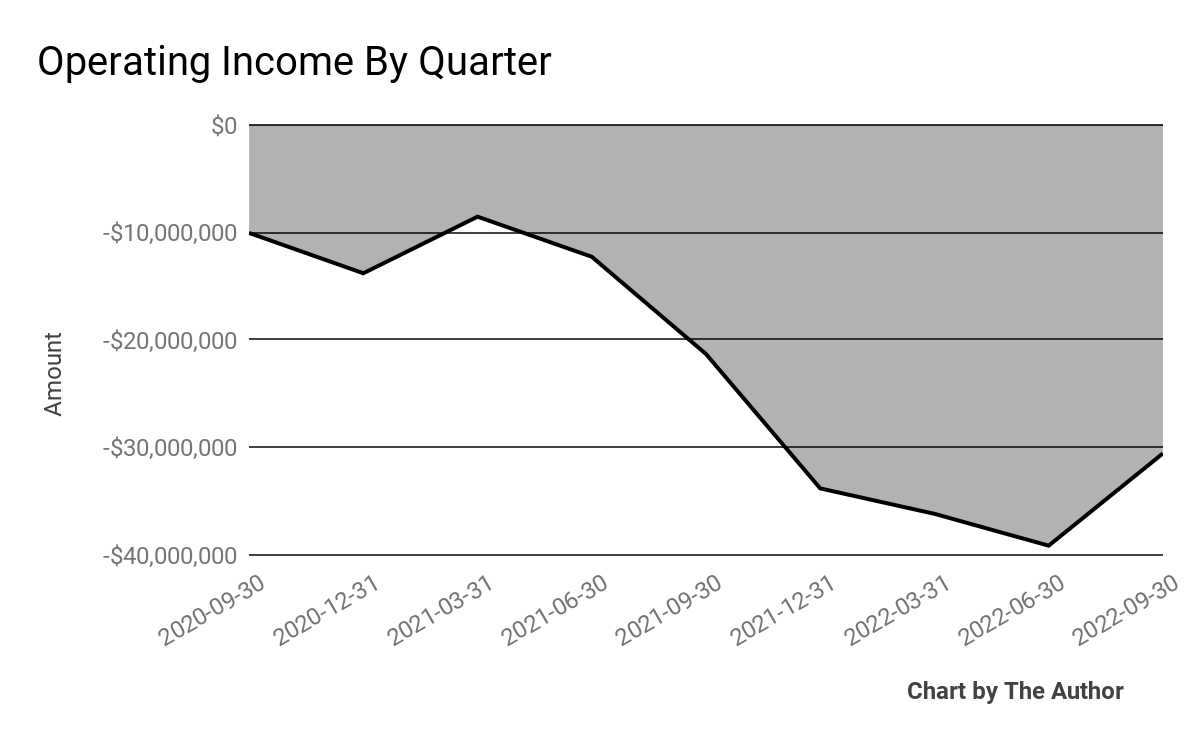
-
Earnings per share (Diluted) have also worsened further into negative territory:
9 Quarter Earnings Per Share (Financial Modeling Prep)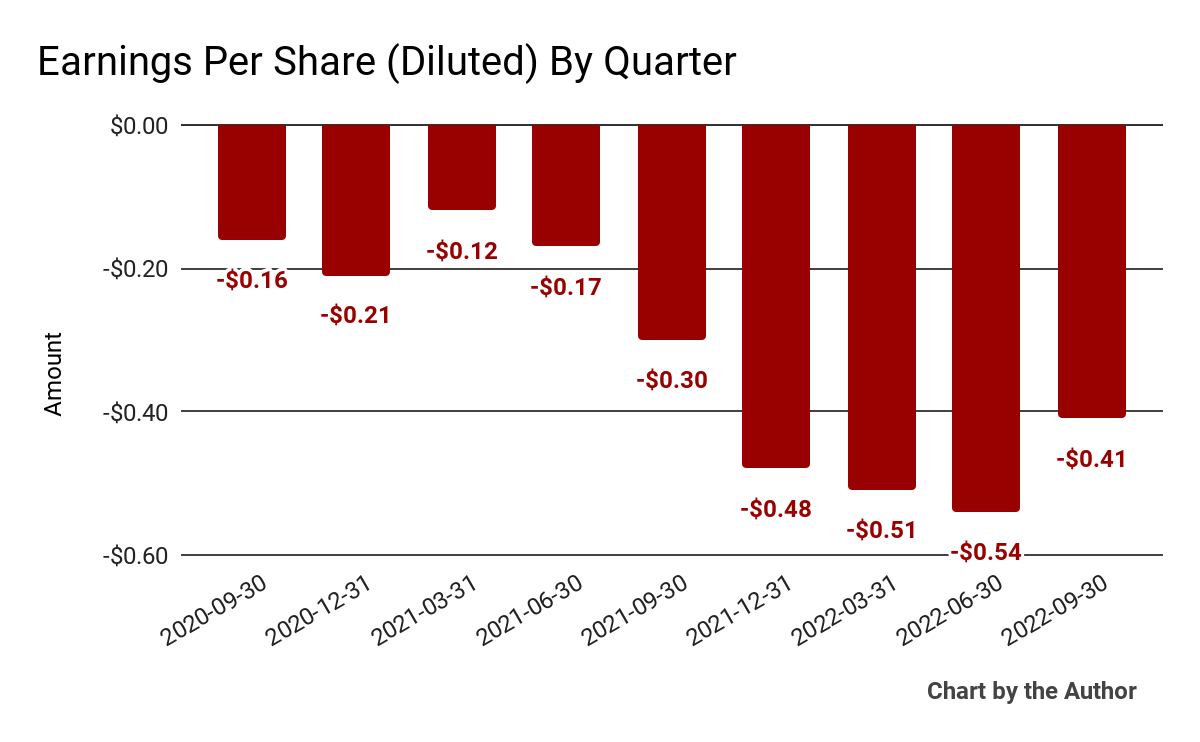
(All data in the above charts is GAAP)
In the past 12 months, BIGC’s stock price has fallen 71.7% vs. Shopify’s drop of around 68.8%, as the chart below indicates:
52-Week Stock Price Comparison (Seeking Alpha)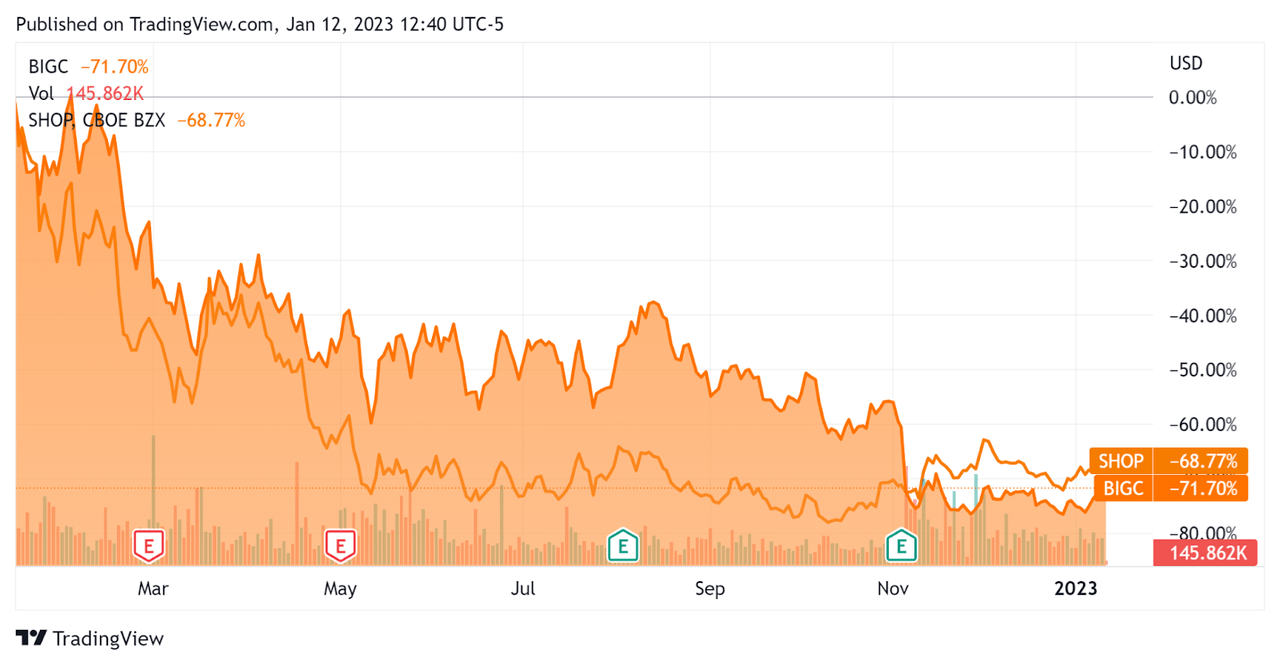
Valuation And Other Metrics For BigCommerce
Below is a table of relevant capitalization and valuation figures for the company:
|
Measure [TTM] |
Amount |
|
Enterprise Value / Sales |
3.4 |
|
Enterprise Value / EBITDA |
-7.1 |
|
Revenue Growth Rate |
37.1% |
|
Net Income Margin |
-52.0% |
|
GAAP EBITDA % |
-47.9% |
|
Market Capitalization |
$679,337,856 |
|
Enterprise Value |
$927,449,760 |
|
Operating Cash Flow |
-$95,481,000 |
|
Earnings Per Share (Fully Diluted) |
-$1.94 |
(Source – Financial Modeling Prep)
As a reference, a relevant partial public comparable would be Shopify (SHOP); shown below is a comparison of their primary valuation metrics:
|
Metric [TTM] |
Shopify |
BigCommerce |
Variance |
|
Enterprise Value / Sales |
8.1 |
3.5 |
-57.1% |
|
Revenue Growth Rate |
24.6% |
37.1% |
50.8% |
|
Net Income Margin |
-61.2% |
-52.0% |
-15.0% |
|
Operating Cash Flow |
-$131,380,000 |
-$95,481,000 |
-27.3% |
(Source – Seeking Alpha and Financial Modeling Prep)
The Rule of 40 is a software industry rule of thumb that says that as long as the combined revenue growth rate and EBITDA percentage rate equal or exceed 40%, the firm is on an acceptable growth/EBITDA trajectory.
BIGC’s most recent GAAP Rule of 40 calculation was negative (10.8%) as of Q3 2022, so the firm has performed poorly in this regard, per the table below:
|
Rule of 40 – GAAP [TTM] |
Calculation |
|
Recent Rev. Growth % |
37.1% |
|
GAAP EBITDA % |
-47.9% |
|
Total |
-10.8% |
(Source – Financial Modeling Prep)
Commentary On BigCommerce
In its last earnings call (Source – Seeking Alpha), covering Q3 2022’s results, management highlighted the growth in its annual revenue run rate of 20% year over year, with enterprise ARR increasing by 35% year-over-year.
Leadership believes that ‘enterprise can eventually grow to more than 80% of our total company ARR and drive strong financial performance in the coming years.’
In addition to its enterprise focus, the company is also ‘seeing substantial demand globally with close to 100 agencies’ in its partnership program.
BIGC also touted its ‘expanded partnership with Affirm’ and its buy now pay later payment options along with a strategic partnership with crypto payment companies to facilitate easier crypto payment processes with BigCommerce merchants.
As to its financial results, total revenue rose 22% year-over-year, while non-GAAP operating loss was $11.5 million. Non-GAAP figures usually exclude stock-based compensation, which was $10.6 million for the quarter.
Management didn’t disclose any company retention rate metrics but did say that enterprise retention was ‘strong’. However, non-enterprise retention ‘has not maintained the performance of the pandemic’s early quarters.’
The firm’s Rule of 40 results have been poor, with a strong revenue result more than offset by a very weak operating result contributing to a negative figure for this metric.
For the balance sheet, the firm ended the quarter with cash, equivalents and short-term investments of $306.7 million and $337 million in long-term debt.
Over the trailing twelve months, free cash used was $100.7 million, of which capital expenditures accounted for $5.2 million. The company paid $37.9 million in stock-based compensation.
Looking ahead, management is shifting sales and marketing resources toward higher retention enterprise accounts, though this approach ‘may impact bookings growth in the front half of next year’ as sales cycles elongate.
Regarding valuation, the market is valuing BIGC at an EV/Sales multiple of around 3.5x.
The SaaS Capital Index of publicly held SaaS software companies showed an average forward EV/Revenue multiple of around 6.3x on November 30, 2022, as the chart shows here:
SaaS Capital Index (SaaS Capital)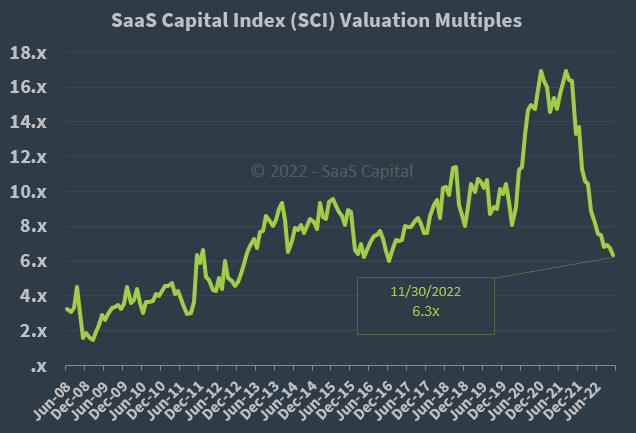
So, by comparison, BIGC is currently valued by the market at a significant discount to the broader SaaS Capital Index, at least as of November 30, 2022.
The primary risk to the company’s outlook is an increasingly likely macroeconomic slowdown or recession, which could produce slower sales cycles and reduce its revenue growth trajectory.
Notably, BIGC’s EV/Sales multiple [TTM] has compressed by 76.1% in the past twelve months, as the Seeking Alpha chart shows here:
Enterprise Value / Sales Multiple (Seeking Alpha)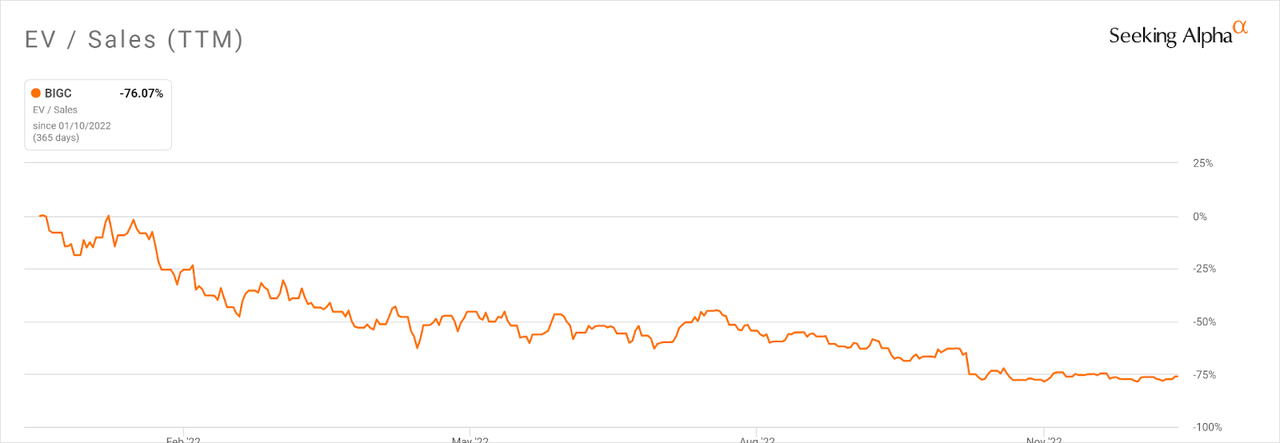
A potential upside catalyst to the stock could include a ‘short and shallow’ slowdown in 2023.
However, given management’s focus on the slower sales cycle enterprise market, my outlook for the firm’s growth trajectory in the near term is not optimistic.
With increasing operating losses, a slower enterprise revenue ramp and a questionable macroeconomic environment, I’m on Hold for BIGC in the near term.
Be the first to comment