


dt03mbb
Produced by Jason Appel
In this article, we will examine the outlook on BHP Group (NYSE:BHP). BHP is one of the world’s largest natural resource companies. They’re diversified by continent, region, geography and commodity. Their main operations include mining and processing of base and precious metals, and the largest by segment is iron ore mining.
The outlook on BHP is quite bullish, and the bullish technical setup discussed later in the article entails a loosely estimated time horizon of the next 12-24 months. While 2022 has been a volatile year for BHP’s stock price, the stock is strongly outperforming major indexes on a year-to-date basis. Additionally, though many of the relevant commodity prices have slipped considerably from 2021 and earlier in 2022 highs, our general outlook is quite bullish on these commodities over the next few years.
First, let’s take note of a few highlights from the fiscal year end (June 2022) report from Aug. 16 here.
Operational excellence:
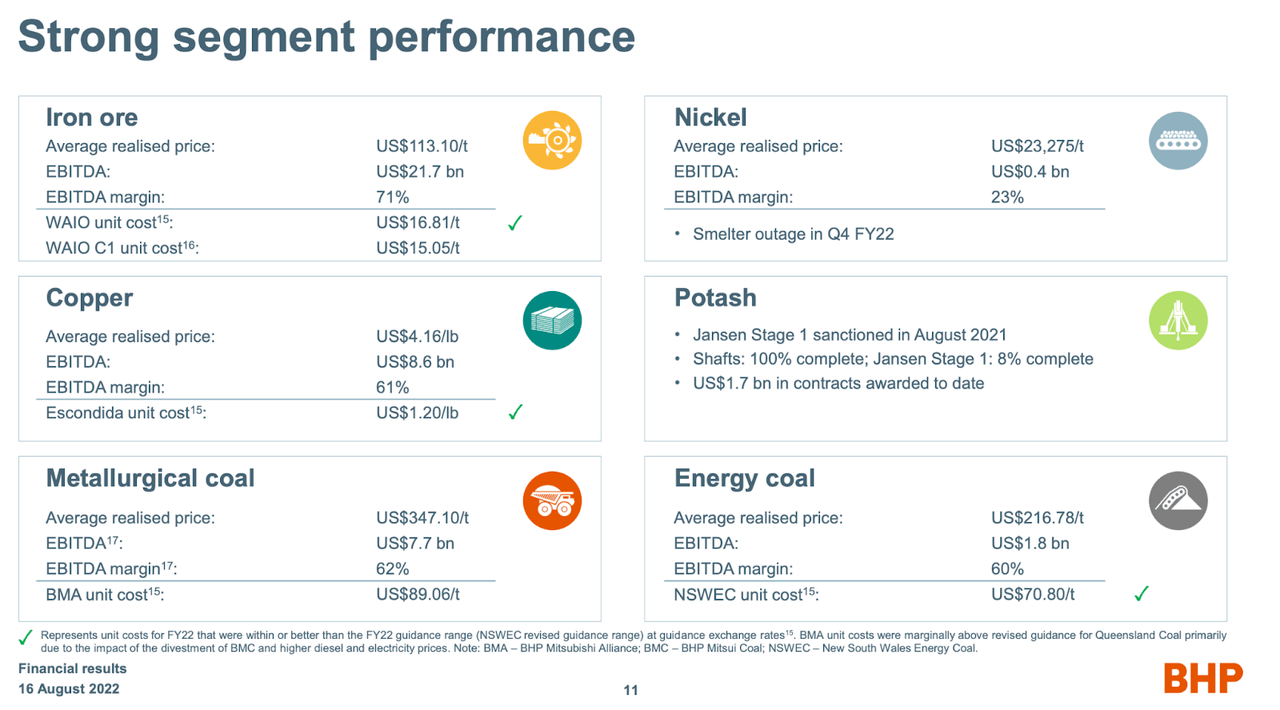
-Record sales at Western Australia Iron Ore (WAIO) (an integrated facility of processing and mining hubs) and record free cash flow generation
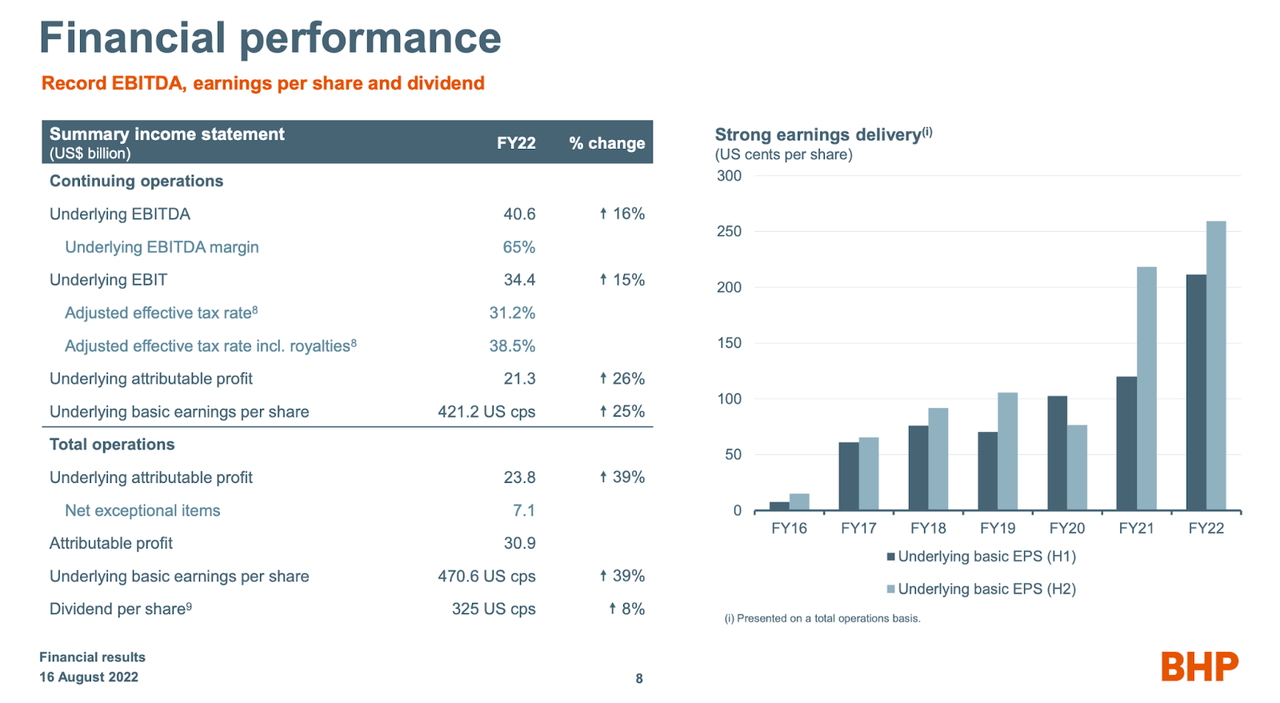
-Profit from operations of US$34.1 billion, up 34% from the prior year, and record Underlying EBITDA of US$40.6 billion at a record margin of 65% for continuing operations.
Value and returns: Record US$36.0 billion of total announced returns to shareholders
-The Board has determined to pay a final dividend of US$1.75 per share or US$8.9 billion, which includes an additional amount of US$0.60 per share (equivalent to US$3.0 billion) above the 50% minimum payout policy. Total cash dividends announced of US$3.25 per share, equivalent to a 77% payout ratio.
Second, please take note of the graphics showing financial performance, including record EBITDA a 25% increase in underlying basic EPS, and Strong Segment Performance including 71% EBITDA Margin on Iron Ore, BHP’s biggest segment:
BHP 2022 Financial Results Presentation
BHP 2022 Financial Results Presentation
From a technical perspective:
BHP is in a larger bullish trend from early 2016. From an Elliott Wave analysis, which informs our technical perspective, expectations are for a 5 wave cycle from the 2016 low. The initial Primary wave 1 completed into the summer 2019 high, in which price advanced nearly 220%! The decline completed in March of 2020 pulled back to support between the .618-.500 Fibonacci retrace support region for Primary wave 2.
From the March 2020 low, BHP shot up to the .764 extension of the initial Primary wave 1, forming a 3 wave move into the February 2021 high. This type of formation strongly favors a diagonal structure for the move from the 2016 low. Since February 2021, BHP has essentially gone nowhere, consolidating gains from the previous advance for the past 18 months. The recent October low can count as a completed (B) wave flat correction as price has formed a clear 3 wave A-B-C consolidation.
Additionally, from the October low, price is forming an impulsive rally, indicating a very likely completion to (B) of Primary 3 and the start to (C). At a micro level, so long as BHP’s price remains above the previous week’s low of $55.96, it is reasonably likely that further advance occurs, targeting $61.50-$65.50, which can complete 5 waves up for the initial Minor degree wave 1 of (C).
The bullish opportunity viewed from the technical lens is the prospect of entering positions or adding longs in a prospective pullback. Typically, after 5 up for a wave 1 of some degree, price pulls back, retracing between 38.2% and 61.8% of the wave 1 advance. Ultimately, determining the upper and lower levels of this region will require a clear top in place for Minor degree wave 1, but early estimates are for the support region to be between $52-$57.50
Ideally any subsequent pullbacks should stay above $52 but so long as BHP remains above the late October low of $46.92, the larger setup is technically valid. Below $46.92 would entail some stops or risk management, as a break of that region would leave the pattern without a clear immediate bullish prospect.
As for the bullish prospects, so long as noted Fibonacci support is holding, BHP is setting up for a larger move upwards of $100 in the coming 1-2 years (a very loose estimate on timing) to complete all 5 waves up from the October 2022 low, and all of Primary wave 3 from the 2020 low. The standard target for wave 3 in a diagonal pattern is the 1.236 extension which occurs at $111.38 on this chart, and so long as this setup maintains support, that is a reasonably likely target for this thesis.
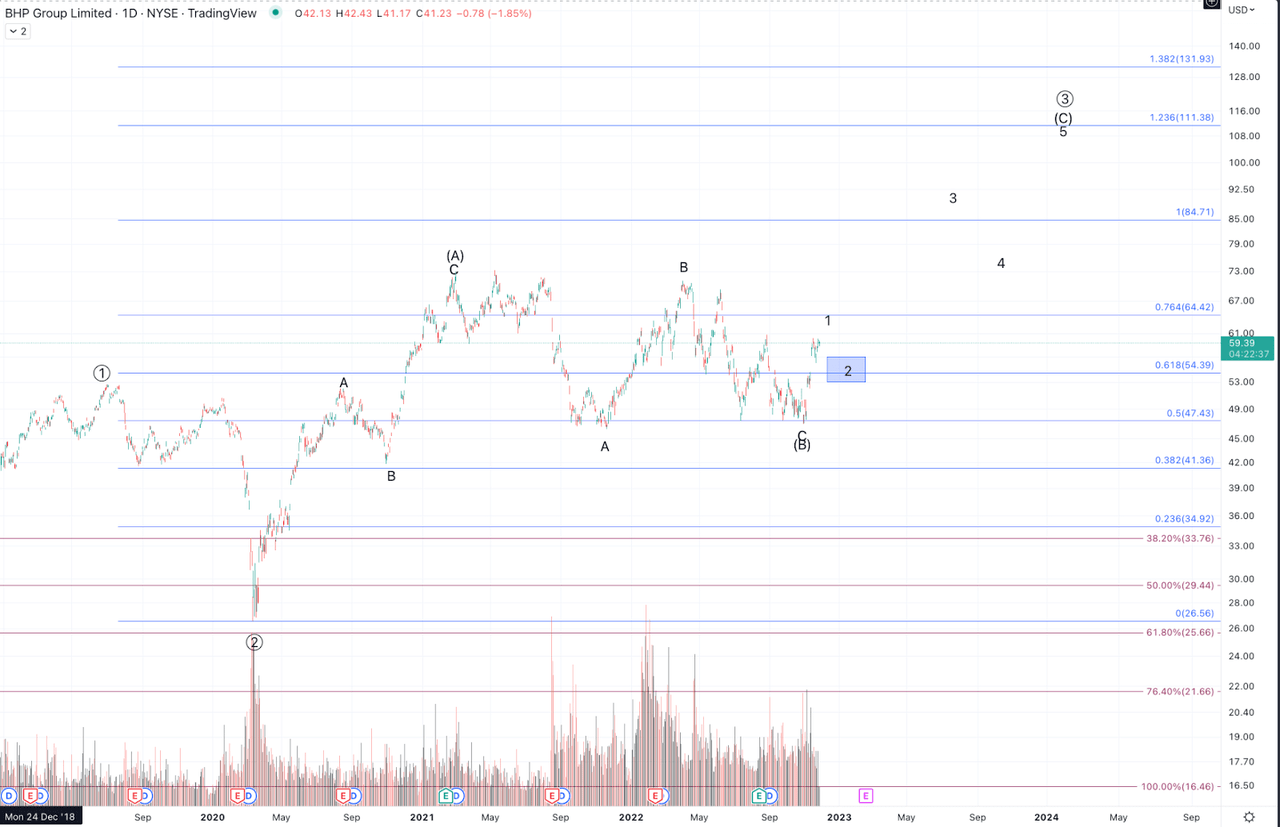
BHP Daily Chart (Jason Appel (StockWaves))
Be the first to comment