

adaask
STORE Capital (NYSE:STOR) and Realty Income (NYSE:O) are both triple net lease REITs with very stable cash-flowing business models. While STOR’s yield is ~140 basis points greater than O’s, O boasts a higher credit rating, implying a lower risk profile.
In this article, we will compare the business models, balance sheets, growth potential, and valuation of these two REITs side-by-side to determine which is the better buy today.
STORE Capital vs. Realty Income: Business Models
Both businesses have very recession resistant business models thanks to deriving virtually all of their revenue from broadly diversified real estate portfolios with triple net leases.
While we like both business models and each has its unique strengths and weaknesses, O is the winner here. It benefits from world-leading scale and a phenomenal track record which give it economies of scale and cost of capital advantages. With well over 1,000 clients across 70 industries and nearly 11,300 properties, 43% of its revenue comes from investment grade tenants, further strengthening its revenue stream.
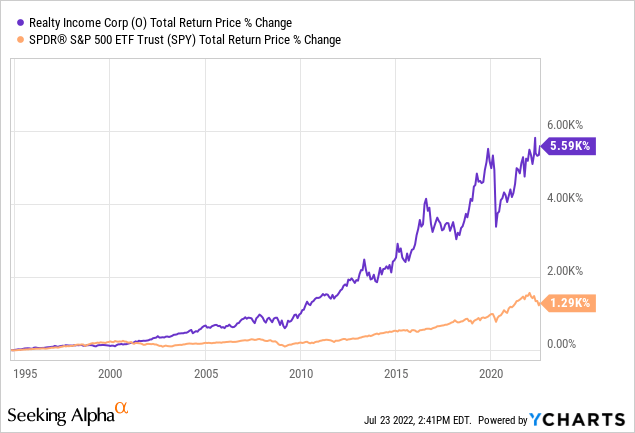
O has grown its monthly dividend for 26 consecutive years while generating market-crushing returns in the process:
Meanwhile, STOR has a solid – if less impressive – portfolio and track record. It services 573 customers across 121 industries with its largest customer only contributing to 3% of its total rental revenue. Its approach is unique in that instead of targeting investment grade tenants like O does, it actually targets non-investment grade tenants in order to command greater cap rates and better overall lease terms. Meanwhile, it focuses on unit-level profitability in order to ensure that its properties perform well even during bad times. Its portfolio boasts 4.7x average rent coverage, indicating that it is a pretty conservatively underwritten portfolio.
80% of its leases are directly originated, implying that it has very strong relationships with its clients and can typically avoid competition with peers for deals. It also has a weighted average lease term of 13.3 years on its portfolio and 94% of its investment portfolio is subject to master leases, indicating a very stable cash flow stream for the next decade.
STOR vs. O: Balance Sheets
Both businesses’ balance sheets are quite solid, with STOR’s achieving a BBB (positive outlook) credit rating and O getting an A- (stable outlook) credit rating from S&P.
STOR’s debt maturities are well-laddered with hardly any maturities coming due in 2022 or 2023, which is very fortunate given that interest rates are elevated right now. Its debt to EBITDA ratio is 4.1x and its EBITDA to interest expense ratio is 4.29x with a 39% leverage ratio. Meanwhile, O’s debt to EBITDA ratio is 5.3x, its EBITDA to interest expense ratio is 6.26x, and its leverage ratio is 28%.
Overall, both balance sheets look solid, and STOR could see its credit rating upgraded to BBB+ in the near future thanks to its positive outlook. However, O’s superior credit rating and lower leverage ratio earn it the win here.
STORE Capital vs. Realty Income: Growth Potential
Both STOR and O continue to invest in opportunistic acquisitions which combines with solid organic growth due to built-in contractual rent escalators to drive mid-single digit annualized AFFO per share growth. Through 2023, both REITs are expected to grow AFFO per share at a 5.8% CAGR.
While O has the advantage of having a lower cost of capital, STOR invests in higher cap rate properties using its unique approach and it also retains more cash flow due to having a lower AFFO dividend payout ratio. Overall, these factors should largely cancel each other out, resulting in similar growth potential.
That said, STOR’s lower payout ratio will likely mean that its dividend growth slightly outpaces O’s dividend growth in the coming years. Through 2023, analysts expect STOR’s dividend to grow at a 5.3% CAGR against O’s expected 3.8% dividend per share CAGR.
STOR vs. O: Stock Valuation
STOR’s main advantage over O is that its dividend yield is significantly higher and its P/AFFO multiple is meaningfully lower. Furthermore, when we look at the EV/EBITDA and P/NAV multiples, we see a similarly wide spread in valuations.
| Metric | P/AFFO | Dividend Yield | EV/EBITDA | P/NAV |
| STOR | 12.42x | 5.6% | 14.74x | 0.96x |
| O | 18.28x | 4.2% | 19.31x | 1.24x |
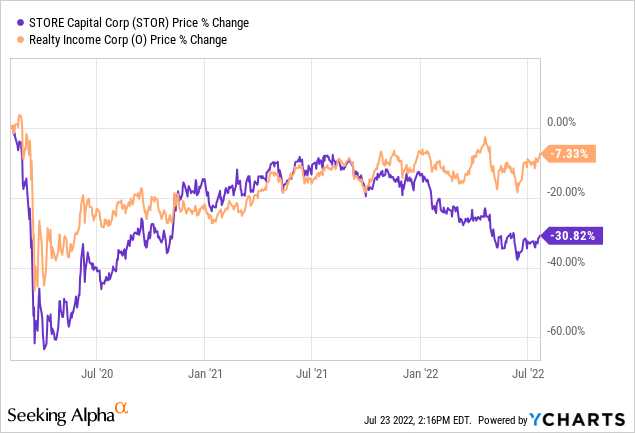
On top of that, O is not trading at a meaningful discount to its pre-COVID levels whereas STOR still is:
Last, but not least, STOR’s 2022 dividend payout ratio is expected to be 71.6% this year whereas O’s 2022 dividend payout ratio is expected to be 76.1%. As a result, STOR’s dividend is not only better covered by cash flow, but it also enables the REIT to retain more cash flow to reinvest in future growth. This helps to offset its lower credit rating and higher cost of capital relative to O.
Investor Takeaway
Both STOR and O look like solid, conservative dividend growth plays that also pay out an attractive current yield. While O is the most conservative given its significant exposure to investment grade tenants, very low leverage ratio, and A- credit rating, STOR trades at a steep discount to O and even trades at a discount to its own private market value. As a result, O is a better pick for those looking for bond-like safety that also provides some growth, while STOR is a better pick for those looking for total returns. Ultimately, however, we believe that the risk-reward is tilted in STOR’s favor as O’s total return profile is in the high single digits whereas STOR’s total return profile is in the teens thanks to its superior yield and stronger potential for multiple expansion while its risk profile is still quite low.
We rate STOR a Strong Buy and O a Buy.
Be the first to comment