

adaask
Both Energy Transfer LP (NYSE:ET) and Plains All American Pipeline, L.P. (NASDAQ:PAA) have investment-grade (BBB- Stable from S&P) credit ratings while also paying out attractive distribution yields of 8.5% and 7.3%, respectively. Both also happen to be scheduled to release their Q3 results in the coming days, with ET planning to release theirs on Tuesday, November 1st and PAA planning to release theirs on Wednesday, November 2nd.
In this article, we will compare them side by side and offer our take on which one is a better buy as we head into the final few months of 2022.
Business Models
PAA is a concentrated play on Permian Basin midstream infrastructure, as ~80% of its total adjusted EBITDA is derived from its Permian Basin assets. As a result, it has a less stable business model than ET, but also enjoys considerable competitive advantages in the Permian Basin. In addition, PAA owns some Western Canadian NGL assets that are highly profitable, but we would not be shocked to see PAA sell them if it can fetch an attractive multiple for them.
In contrast, ET has a very well-diversified business model that services every major production basin in the United States. It has five different midstream businesses, with each bringing in less than 30% of its expected 2022 adjusted EBITDA. Both businesses are pretty commodity-price resistant – particularly ET – thanks to the fact that the majority of their cash flows come from long-term fixed-fee/take-or-pay pipeline contracts.
Balance Sheets
As was already stated, both PAA and ET have solid investment-grade credit rated balance sheets with the same BBB- rating and stable outlook from S&P. Their liquidity levels are also quite strong at $2.8 billion for PAA and $2.4 billion for ET. Note, however, that PAA’s enterprise value is a mere fraction of ET’s, so its liquidity is quite a bit more impressive than ET’s. As a result, we give the edge to PAA here.
Distribution Growth Outlook
ET has tremendous distribution growth momentum going for it right now, as it has grown its quarterly payout by over 70% over the past year. Its Q3 2021 distribution was $0.1525 per unit and it has increased its distribution every quarter since then until a few days ago – on October 25th, 2022 – ET’s board of directors declared a $0.265 quarterly distribution, while also saying:
Future increases to the distribution level will be evaluated quarterly with the ultimate goal of returning distributions to the previous level of $0.305 per quarter, or $1.22 on an annual basis, while balancing the partnership’s leverage target, growth opportunities and unit buy-backs.
As a result, we expect ET to grow its distribution by 15.1% further at a minimum, likely in next quarter’s distribution announcement. However, growth beyond that in the near term is much less likely in our view given that management is also leaning more heavily into reigniting aggressive growth spending. Priority number one for the partnership was getting leverage down to a satisfactory range in order to preserve its investment grade credit rating and secure its long-term well-being.
Now that this has been accomplished, ET is focused on restoring the distribution to its pre-cut level while simultaneously lining up growth spending projects. Once the quarterly distribution has been restored to its original level, we expect ET to focus its excess cash flow on continuing to opportunistically retire debt and also invest in attractive growth projects and acquisitions in order to further scale and diversify the business.
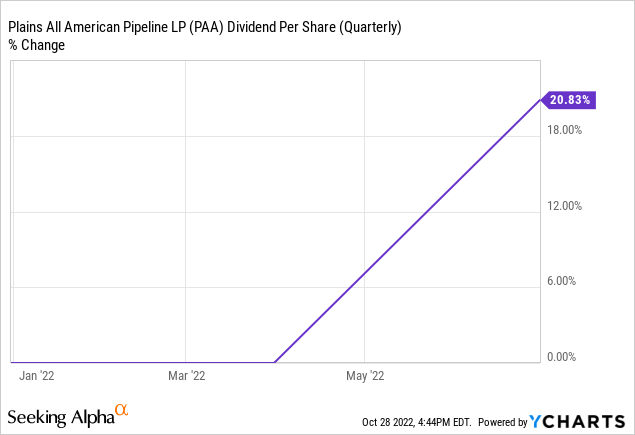
Meanwhile, PAA has not had quite the same distribution growth momentum over the past year, though it has still been strong:
Furthermore, on its Q2 earnings call, management guided for reaching their target leverage ratio midpoint by year-end, which now positions them to more aggressively grow their distribution. As the CEO pointed out:
I think you’ll see that we will continue to support distribution increases. I won’t give you specifics on that because, again, we have to have some conversation with our Board.
They currently are paying out a $0.87 annualized per unit distribution and are expected to generate $2.51 in distributable cash flow per unit in 2023. This would mean PAA will have an incredible 2.9x coverage ratio. Given that management is paring down capital expenditures in favor of debt reduction, buybacks, and distribution growth, they will not need to retain that much cash flow. As a result, we think a very substantial increase in the distribution is in order here.
Before slashing the distribution in 2020, PAA was paying out a $0.36 quarterly distribution ($1.44 annualized). We think a restoration to this level even next year is very possible, which would imply a whopping 66% distribution growth rate. Even if PAA takes a more conservative approach to growing the distribution, we think it is unlikely – barring some major unforeseen transactions – that they will take more than two years to restore the distribution to the $1.44 per unit level, implying nearly 30% annualized growth to the distribution over the next two years.
As a result, within a few years, we expect PAA to have a meaningfully higher yield on current cost relative to ET (12.1% to 9.7%) even though ET’s yield is higher than PAA’s is today.
Track Record
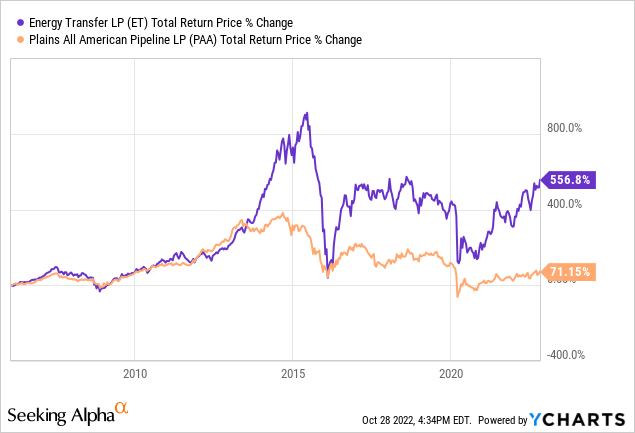
Neither business’s track record is particularly impressive, as both have inflicted devastating distribution cuts on their unitholders in the not-too-distant past as a result of overleveraging their balance sheets on ill-fated growth acquisitions and growth investments. That said, ET has significantly outperformed PAA over the long term:
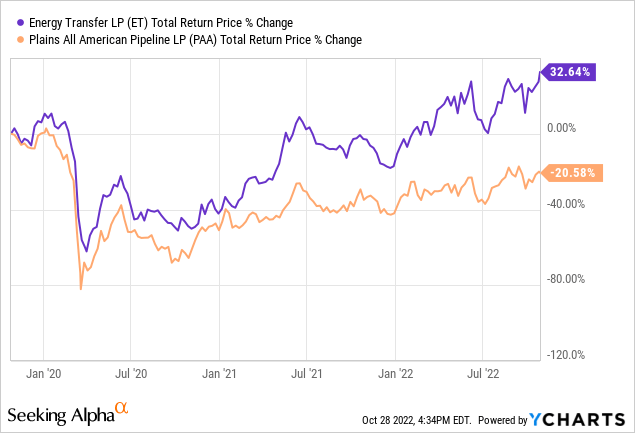
… as well as in recent years, as its better-diversified business model has better weathered the COVID-19 era challenges for Permian oil (where PAA is heavily concentrated):
Valuation
Both businesses also look undervalued when compared to their own histories. Here is a side-by-side comparison of them:
| Valuation Metrics | PAA | ET |
| EV/EBITDA | 9.3x | 7.9x |
| EV/EBITDA (5-Yr Avg) | 9.7x | 9.0x |
| P/22 DCF | 5.4x | 4.9x |
| P/23 DCF | 4.7x | 4.8x |
| Distribution Yield | 7.3% | 8.5% |
Overall, ET looks to be the clear winner in terms of cheaper valuation, though it is noteworthy that PAA is cheaper on a P/DCF basis when looking at 2023 expected DCF. This is largely due to the fact that PAA’s Permian-focused assets are still in recovery mode from severe COVID-19 headwinds. Furthermore, for reasons we already discussed, we believe PAA’s forward distribution yield is actually likely to be much higher than the current 7.3% payout level, so the gap according to that metric is not that wide after all.
Investor Takeaway
Both businesses look attractively priced at the moment – particularly ET – and are well positioned to thrive in a stagflationary environment, especially given the energy crisis in Europe. ET’s big advantage over PAA is its superior diversification, particularly its exposure to NGL exports and natural gas in general, as these are expected to have a brighter future than oil given their greener nature.
That said, PAA is expected to see strong DCF per unit growth in 2023 as the business continues to recover from COVID-19 headwinds. We also expect PAA’s distribution to meaningfully outgrow ET’s in the coming years. As a result, this may serve as a very strong catalyst for the unit price. We like both, and are long both at High Yield Investor. In fact, both have served as some of our largest positions this year, helping to fuel our strong outperformance.
Be the first to comment