

adaask
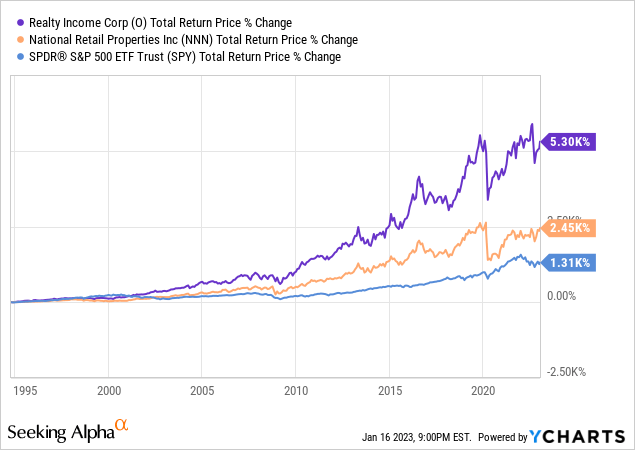
Both Realty Income (NYSE:O) and National Retail Properties (NYSE:NNN) are high yield triple net lease REITs with investment grade credit ratings. Both also have very impressive dividend growth and total return track records. Both are Dividend Aristocrats and have crushed the total returns generated by the S&P 500 (SPY) over the long-term:
In this article, we will compare them side by side and offer our take on which one is a better buy right now.
Realty Income Vs. National Retail Properties: Business Model
Both REITs employ low risk triple net lease business models. They also both primarily target single tenant free standing retail real estate. Given their impressive long-term total return and dividend growth track records, it is clear that this business model is battle-tested and can support consistent FFO per share and dividend per share growth even through severe recessions like the Great Recession and catastrophic black swan events like the COVID-19 outbreak and lockdowns.
O has a superior scale with 11,733 properties and 1,147 tenants. In contrast, NNN has just 3,349 properties and 380 tenants. That said, both enjoy more than enough diversification and have very stable cash flow profiles that are well-insulated against individual tenant bankruptcies.
O has an 8.8 year weighted average lease term, whereas NNN has a 10.4 year weighted average lease term. Meanwhile, O generates 43% of its rent from investment grade tenants, compared to NNN which only has 16% exposure to investment grade tenants. That said, while O targets tenants with higher credit quality, NNN focuses on property-level underwriting. As a result, it enjoys conservative rent coverage on its properties (generally in the 2-3x range). Furthermore, it also emphasizes great locations and a high land value component in the properties it owns because it believes these traits are even more important to the long-term risk-reward provided by the property. In particular, they like this trade-off because they can typically command higher cap rates and better lease terms when leasing to non-investment grade tenants.
While NNN has certainly been successful with its business model that has generated long-term alpha, it is also hard to argue against O’s long-term performance, which outshines NNN’s considerably.
Realty Income Vs. National Retail Properties: Balance Sheet
Both REITs clearly have fortress balance sheets, with O boasting an A- credit rating and NNN having a nearly as impressive BBB+ credit rating.
O has a 6.3 year weighted average term to maturity for its notes and bonds, whereas NNN has a much higher 14-year weighted average term to maturity. The vast majority of both REITs’ debt is unsecured. O’s fixed charge coverage ratio is 5.5x and its net debt to annualized pro forma adjusted EBITDA is 5.2x, both very solid metrics given its stable underlying cash flows. Finally, it has liquidity of over $2.5 billion. NNN, for its part, has a fixed charge coverage ratio of 4.7x and its net debt to annualized pro forma adjusted EBITDA is 5.3x, nearly as conservative as O’s is. Its liquidity stands at well over $1 billion, which is more than sufficient given its smaller size relative to O.
Both balance sheets are clearly strong, but O gets the edge here by virtue of its superior credit rating, though NNN’s weighted average term to maturity is very impressive.
Realty Income Vs. National Retail Properties: Dividend Outlook
As already stated, both REITs have very impressive long-term dividend growth track records and should be able to continue growing their dividends for many years to come given their reasonable payout ratios, strong management teams, stable business models, and stellar balance sheets.
Analysts forecast mid-single-digit annualized dividend growth moving forward for both businesses, which is in-line with their recent trajectory. Analysts expect O to grow its dividend per share at a 4.9% CAGR through 2026 and NNN is expected to grow its dividend per share at a 4.7% CAGR through 2026. O is expected to grow its AFFO per share at a 4.3% CAGR through 2026 while NNN is expected to grow its AFFO per share at a 2.7% CAGR through 2026.
Realty Income Vs. National Retail Properties: Valuation
When comparing these REITs side-by-side, we see that – while they have fairly similar dividend yields and price to NAV ratios – NNN is convincingly cheaper than O is on a P/AFFO and EV/EBITDA basis:
| Metric | P/AFFO | FWD Dividend Yield | EV/EBITDA | P/NAV |
| NNN | 14.71x | 4.67% | 16.92x | 1.11x |
| O | 16.73x | 4.59% | 17.52x | 1.17x |
This makes sense because – as we discussed in the business model section – NNN targets properties and tenants that offer higher cash flow yields in exchange for lower tenant credit quality.
That said, when taking into account that O has a slightly stronger expected growth rate moving forward, the total return potential is much closer than the P/AFFO multiple differentials suggest.
Investor Takeaway
The choice here really boils down to this:
- O offers monthly dividend, has a higher credit rating, has a slightly superior expected growth rate, and has a significantly superior long-term track record.
- NNN is the superior choice if you trust their unit-level underwriting method and want to buy a stock that – while it has a similarly low risk profile – trades at a meaningfully cheaper P/AFFO multiple alongside a slightly better dividend yield and P/NAV ratio.
Ultimately, we think the differences between these two are small enough and both are so impressive that it probably makes sense to just buy both. Combining the two gives you monthly cash flow from O’s dividends but also a higher annualized dividend and AFFO yield given NNN’s cheaper valuation. It also mitigates some of the business model risk inherent in the two REITs’ different approaches. We rate both as Buys at present as we expect them to generate ~10% annualized total returns over the long-term moving forward.
Be the first to comment