


alvarez
Introduction
Berkshire Hathaway (NYSE:BRK.A, NYSE:BRK.B) reported their second quarter earnings last Saturday. The market response has been fairly muted, implying no significant surprises in the financial statements. After going through the results in detail, I believe BRK is steadily increasing shareholder value over the long term.
Segment results
All in all, the segments produces solid EPS growth although margins were squeezed in a few segments. Here are the high-level quarterly figures for the operating businesses:
- Insurance underwriting – EPS of $0.26 (59.7% YoY growth)
- Railroad – $0.75 (13.4%)
- Utilities and Energy – $0.35 (7.0%)
- Manufacturing, Service and Retailing – $1.47 (11.8%)
This adds up to EPS of $2.84 for the operating businesses with a solid 14.8% YoY growth. Next, I’ll go through the segments in turn.
Insurance – Underwriting
Premiums earned grew modestly at 5.4% YoY, although there were differences between the insurance businesses. GEICO weakness continued as it only grew 2.7% while BH Primary continued its stellar performance with 20.3% growth. BHRG grew only 2.3%.
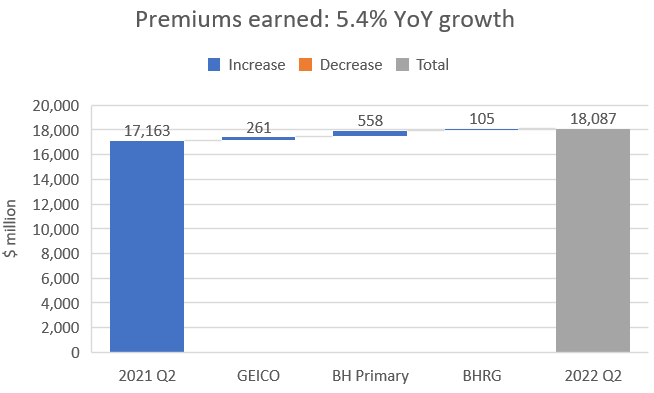
Premiums earned YoY growth (Berkshire Hathaway financial reports)
Underwriting produced solid pre-tax earnings at $722 million or 55.3% YoY growth. Most of this was attributable to BHRG and, I believe, non-recurring items such as a large foreign currency exchange gain and adjustment of previous year losses. GEICO really underperformed compared to the previous period while BH Primary produced solid underwriting results.

Pre-tax earnings YoY growth (Berkshire Hathaway financial reports)
Float decreased by $1 billion to $147 billion from the previous quarter and cost of float stayed negative for the quarter and for the last twelve months which is obviously satisfying.
Insurance – Investment income
At last, we’re starting to see some upwards momentum in investment income i.e. dividends from equity investments and interest from fixed income investments. The increase was primarily attributable to the net deployment of about $45 billion into equity securities during H1/2022 which is now earning dividends for BRK (58.3% YoY growth). Interest and other investment income also increased 44.3% to $228 million. The short-term treasuries held on the balance sheet are finally starting to yield something for BRK’s shareholders which is very satisfying after nearly two years of zero interest rates.

Investment income – Quarterly development (Berkshire Hathaway financial reports)
Railroad (BNSF)
Burlington Northern Santa Fe had a good quarter. Revenue growth accelerated although volumes were down across the product segment. The revenue increase came from higher average revenues per car/unit. Volumes will likely stay muted in the near term as there have been a few signs of weakness in the macro picture as of late. As we know, BNSF is a bet on the U.S. economy.
EBIT margins compressed during the quarter which was mostly due to fuel expenses increasing ~84% YoY. The rest of the costs were fairly in line versus the comparable period. Fuel costs will likely stay elevated in the near-term if the macro picture stays the same so I guess we have to live with lower margins for at least the rest of the year. With that said, EBIT still grew on an absolute basis YoY which equals more cash for BRK to spend on other ventures.
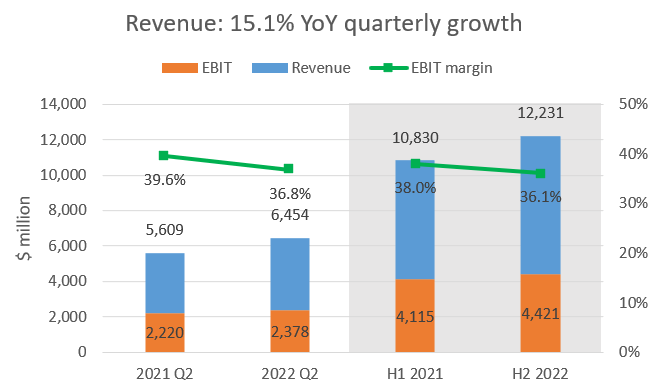
BNSF financial development (Berkshire Hathaway financial reports)
Utilities and Energy
Berkshire Hathaway now owns 92% of BHE (previous quarter 91.1%) as BHE acquired Greg Abel’s common stock for $870 million during the quarter. A few thoughts: It’s a positive that BRK increased their ownership stake in BHE as it means more earnings for BRK’s shareholders. However, I can only speculate on why the transaction took place now and what it means for Greg Abel going forward. Time will tell. With that out of the way, I like to look at Utilities and Energy separated into two segments: Energy and Real Estate brokerage.
Energy
The energy businesses also had a decent quarter. Topline grew 14.9% while after-tax earnings growth was more muted at 9.4% due to higher operating expenses in the regulated electric and natural gas utilities, especially PacifiCorp. Most of the growth in after-tax earnings came from production tax credits from wind-powered electricity generation that have reached commercial operations during the past year. These income tax benefits are of course nice to get although they now form a significant part of the results of the energy segment. My knowledge of renewable electricity generation tax benefits is not admirable but you have to assume management knows what they are doing.

Energy financial development (Berkshire Hathaway financial reports)
Real Estate brokerage
Real Estate brokerage had a tough quarter as topline decreased 5.2% while after-tax earnings decreased 37.8%. The decrease was mainly due to less activity in the real estate markets (lower funded volume, refinancing activity and lower closed units). With the housing market cooling down I think we will see further weakness in this segment going forward. Of course, it is a fairly small part of the whole pie.

Real Estate brokerage financial development (Berkshire Hathaway financial reports)
After-tax earnings of BHE’s businesses
To gain a slightly better understanding of the earnings of the different businesses I also like to look at the YoY change per business. The total after-tax earnings of the segment grew only 1.9% YoY. As mentioned above, PacifiCorp and Real Estate brokerage were the underperformers of the quarter versus the comparable period. The other regulated utilities MidAmerican Energy and NV Energy were also fairly weak with flat topline growth. Northern Powergrid, Natural gas pipelines and Other energy businesses compares favorably to the previous period mostly due to tax effects. At least Northern Powergrid’s and Natural gas pipelines’ tax items seem to be one-time occurrences which means operations and the market environment needs to improve to see growth here. Other energy businesses growth is due to new electricity generation being ramped up which equals more tax benefits. This is the business you should keep an eye on for future growth in the energy segment as BRK is investing quite a lot in wind power (grew 11.8% or 1,215 MW’s in 2021 vs. 2020).
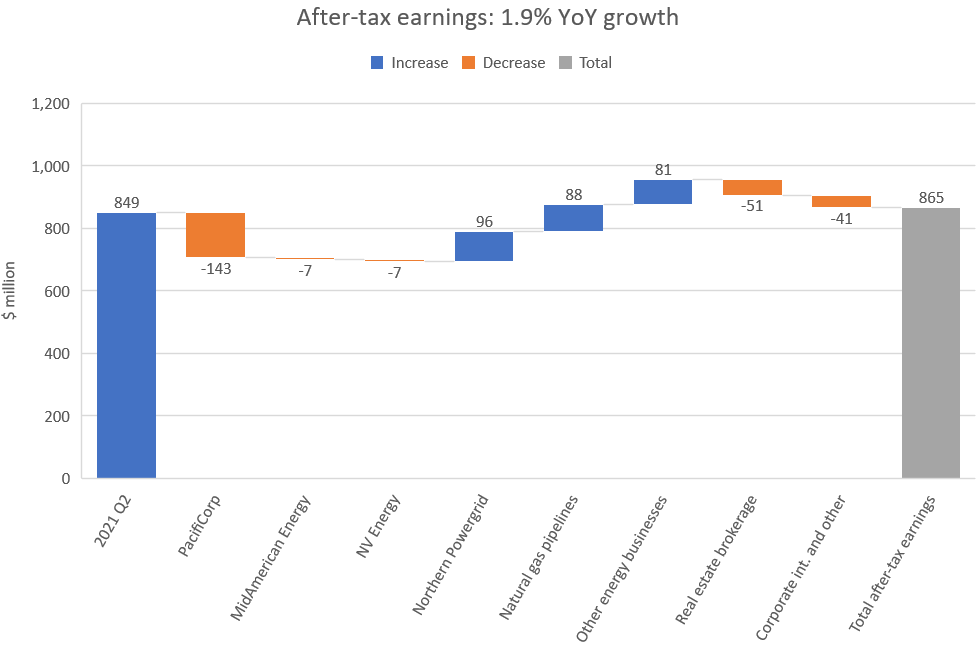
After-tax earnings of BHE businesses (Berkshire Hathaway financial reports)
Manufacturing
Manufacturing had a good quarter as a whole with some nuances when you look at the different segments. All segments grew well (13.6%) although growth decelerated in the Industrial and Consumer products segments (7.3% and 13.7% YoY respectively). Building products continued its strong trend with 20.4% YoY growth.
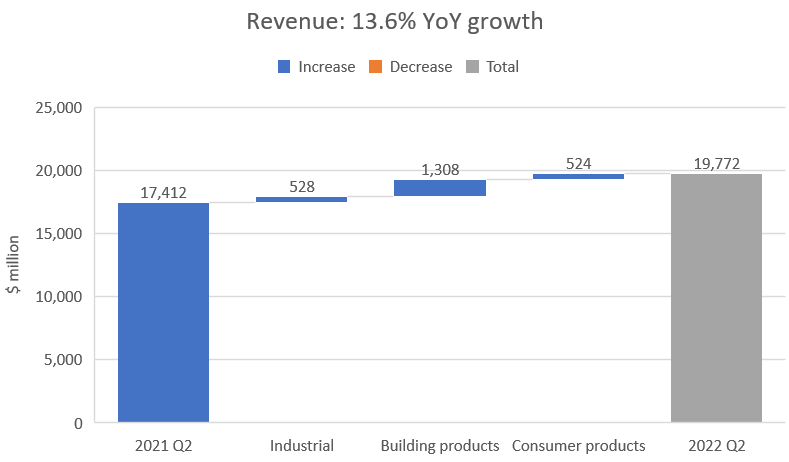
Revenue YoY growth (Berkshire Hathaway financial reports)
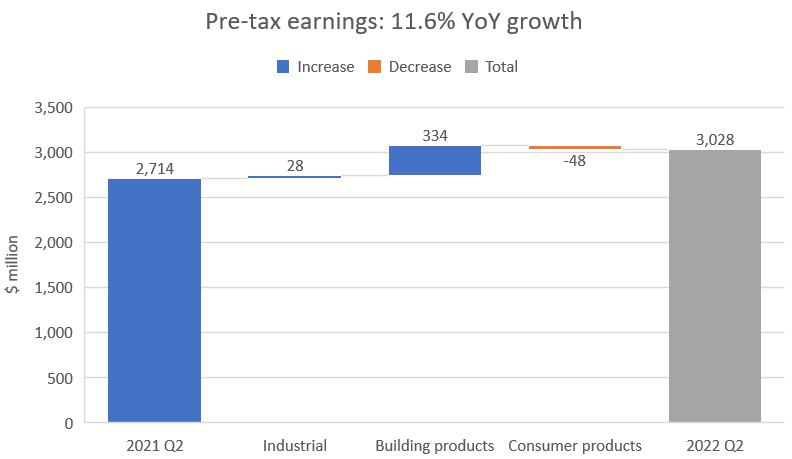
Although topline grew well across the board, expenses grew even faster for the Industrial and Consumer products segments (pre-tax earnings grew 11.6% for the whole segment). One exception was Lubritzol, part of the Industrial segment, which actually grew earnings 60.2% due to the fire in one of its facilities in the previous comparable period. However, the rest of the companies in the Industrial segment posted lower or flat earnings due to higher material and energy costs in addition to costs related to supply chain disruption. Building products was strong primarily thanks to Clayton Homes (about 44% of the segment) which benefitted from good activity in residential home construction. Management expects things to slow down due to higher interest rates on mortgages which makes sense. The other businesses in the segment also performed strongly. Consumer products earnings were also flat for the quarter due to weakness in the apparel and footwear businesses. Forest River’s leisure vehicle business actually grew earnings although it wasn’t enough to offset the weakness in the rest of the segment.
Pre-tax earnings growth (Berkshire Hathaway financial reports)
Service, Retailing and McLane
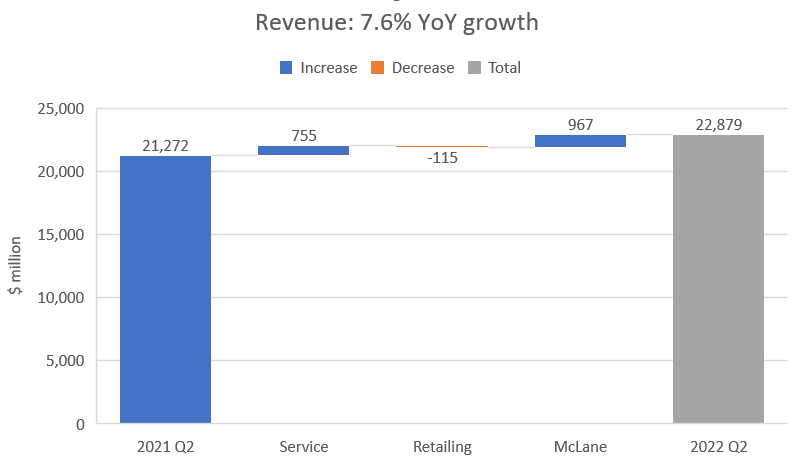
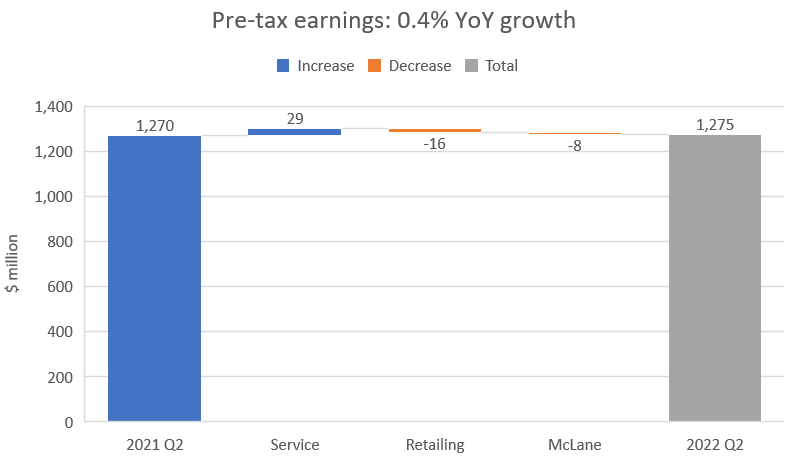
Service, Retailing and McLane had a fairly weak quarter as a whole. Topline grew 7.6% while pre-tax earnings were essentially flat with 0.4% growth YoY. The service segment was the strongest with 19.0% YoY topline growth due to (1) TTI, a distributor of electronic components, which saw strong demand and (2) aviation services due to an increase in training hours and customer flight hours. The Retailing segment was weak as a whole as topline declined 2.3%. McLane managed to grow topline 7.9% but as we’ll soon see, margins got squeezed.
Revenue YoY growth (Berkshire Hathaway financial reports)
Pre-tax earnings margins were squeezed across all segments although there is again some nuances between the businesses. On the services segment, TTI grew pre-tax earnings while aviation services were down due to increased utilization of subcontracted aircrafts. This was due to the increased demand in customer flight hours i.e. the increased demand wasn’t prepared for properly.
Berkshire Hathaway Automotive, which represents ~65% of the retailing segment, grew pre-tax earnings by 17.2% due to higher vehicle gross margins and higher finance and service contract earnings. On the other end of the retailing segment spectrum, the home furnishing businesses pre-tax earnings decreased 20.8%. McLane’s pre-tax earnings decreased 9.5% due to higher costs across the board. Management expects the current difficult environment to continue for the rest of 2022.
Pre-tax earnings YoY growth (Berkshire Hathaway financial reports)
Investment and derivative gains (losses)
I believe all of us follow the development of the listed equity portfolio of BRK although the value of the operating businesses are not affected by these developments. The listed equity portfolio is however so large that the quarterly swings affect the value of BRK. Let’s look at how the gains/losses of the listed equity portfolio have developed since 2018 as it was in 2018 that BRK started to record unrealized gains/losses in the earnings statement instead of other comprehensive income). As we can see, the drawdown during Q2 was the second largest ever, only slightly smaller than the pandemic related drawdown. One shouldn’t pay too much attention to the quarterly swings (blue bars) but in the long-term (orange area), however, we should expect this portfolio to produce competitive returns on capital which it has done so far.
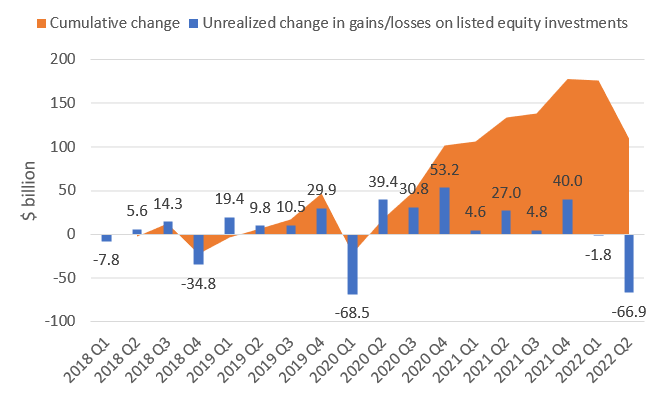
Listed equity portfolio gain/loss (Berkshire Hathaway financial reports)
Valuation
I’ve updated my valuation estimate of BRK. If you want to get a more comprehensive view on how I value BRK, please read my previous article, here. My valuation estimate has come down by about $50bn which is primarily due to the drawdown of the listed equity portfolio. The rest of the operating businesses are flat or slightly down due to lower multiples of the listed peers. As we can see, I value BRK at slightly below $800 billion or ~$360 per share.
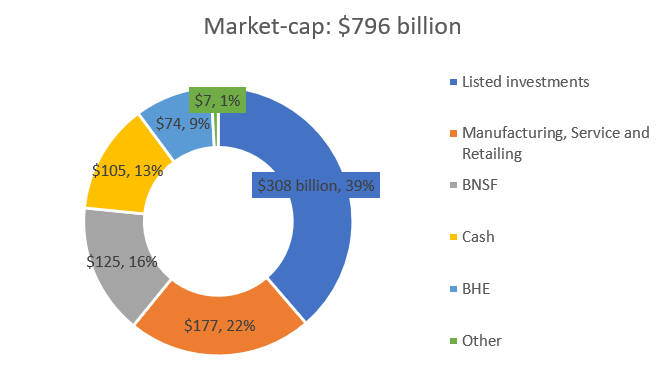
Sum of the parts valuation of Berkshire Hathaway (Author’s calculations)
As the current market cap of BRK is around $650 billion as of this writing (BRK.B shares ~$295), the margin of safety is about 18%, slightly shy of the magic 20% number. As I argued in my previous article, I’m fairly confident in BRK’s ability to produce attractive returns at these prices, which is why I rate BRK a buy.
Be the first to comment