

Scott Olson
By The Valuentum Team
We need to make sure that you’re aware of something very important. The media and perhaps many investment professionals define the concept of “value” as companies with low price-to-book (P/B) ratios, and the concept of “growth” as companies with high price-to-book ratios. This definition of “value” and “growth” and their corresponding returns have been magnified in writings throughout the media and across quantitative research, even in prestigious journals. Warren Buffett, the head of Berkshire Hathaway (NYSE:BRK.A) (BRK.B) has been rallying against most quantitative applications and how “growth” and “value” are defined in popular media and quantitative research for decades.
The area of large cap growth, which we believe to be mostly made up of “truly” undervalued stocks, has outperformed the area of small cap value by a huge margin the past decade or so. (Image Source: TradingView)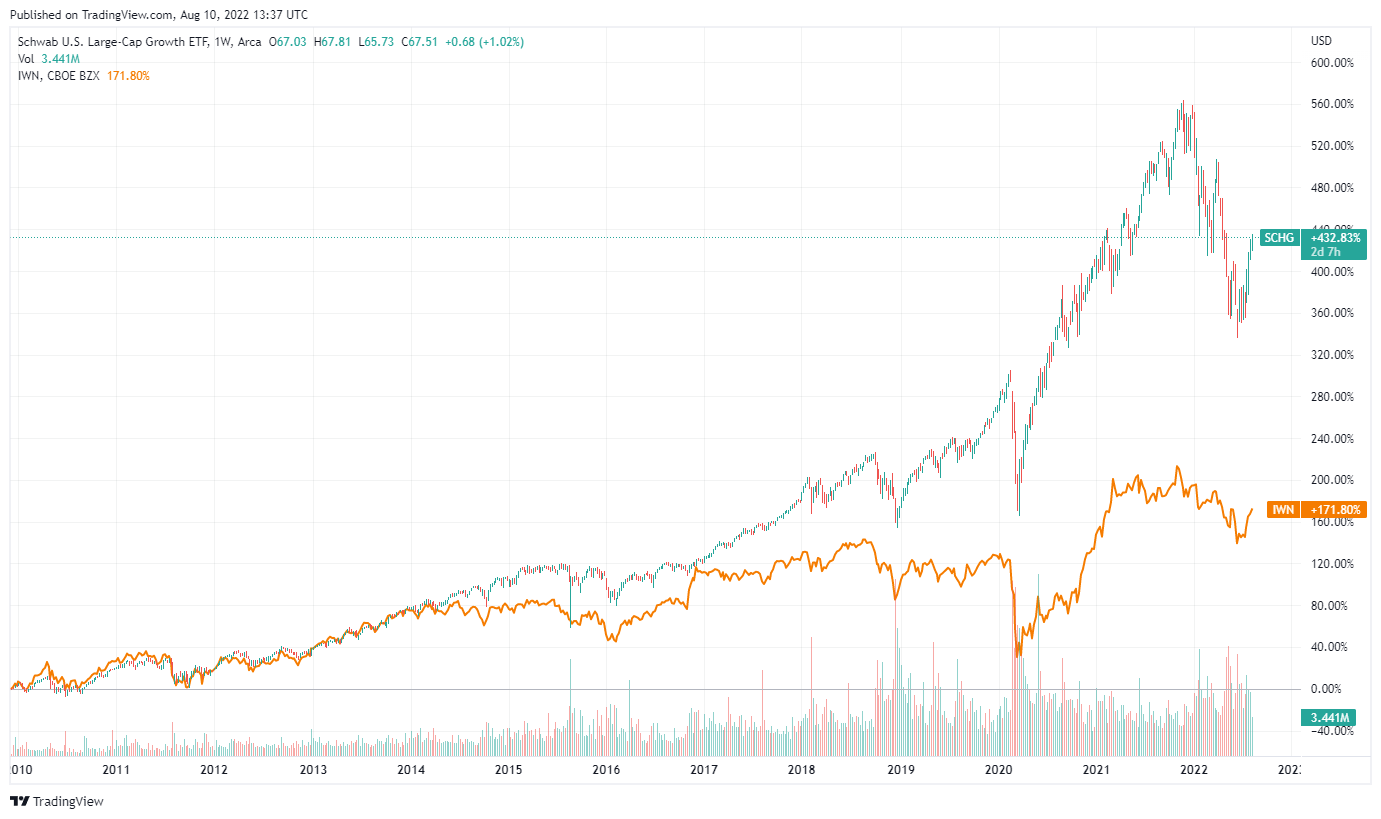
Here’s one of the Oracle’s most famous quotes, for example.
But how, you will ask, does one decide what [stocks are] “attractive”? Most analysts feel they must choose between two approaches customarily thought to be in opposition: “value” and “growth,”…We view that as fuzzy thinking…Growth is always a component of value [and] the very term “value investing” is redundant. — Warren Buffett, Berkshire Hathaway annual report, 1992
The traditional quantitative “value” factor has been underperforming for the past 15 years or so, and factor distribution tables from Credit Suisse (here), for example, only highlight the value factor’s prolonged weakness. Why is this important? Well, many investors may believe that true intrinsic value investors are also underperforming and in a more dire sense that value investing is dead. We cannot stress enough the vast differences between the concept of enterprise valuation, as in arriving at a fair (intrinsic) value estimate, and the traditional definitions of quant “value” that are based on price-observed metrics such as the P/B ratio. It is simply the difference between night and day, as quant investors tend to focus more on statistics than ensuring the data they are using makes sense in the valuation framework (i.e. causal versus spurious relationships).
An instance where statistics indicates a strong relationship, but common sense reveals that this relationship is spurious or false. (Image Source: Tyler Vigen)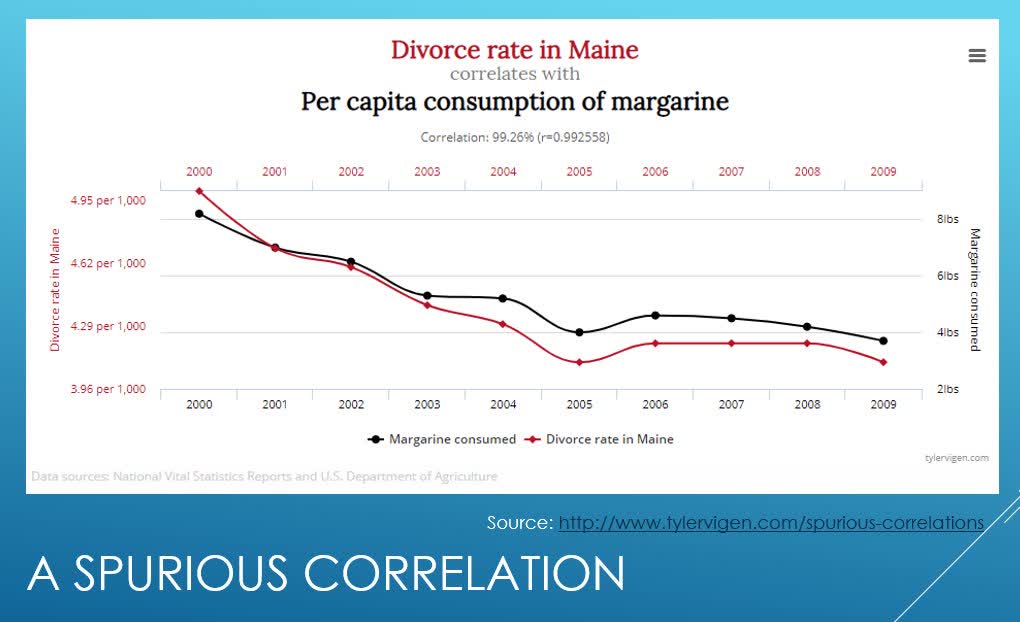
For starters, as in the example above that uses data for the divorce rate in Maine and per capita consumption of margarine, it may lead one to believe that there is a causal relationship between these two variables. But common sense suggests there’s simply not. It’s a spurious (false) relationship despite the analysis being empirical, data driven, evidence-based and so on. The same can be said about using book value (shareholders equity) in quant applications for value, in our view. Quite simply, there are instances where book value can be negligible or negative for important and widely-known companies that have tremendous intrinsic or market value.
Boeing (BA) and McDonald’s (MCD) have been two of the highest-profile examples. In 2008, Boeing’s total shareholders’ equity was -$1.14 billion (negative $1.14 billion), while at the end of the third quarter of 2018, McDonald’s total shareholders’ equity was -$6.79 billion (negative $6.79 billion). According to a study in 2007, some researchers estimated that approximately 5% of all listed stocks had negative book equity. There were an estimated 118 companies in the U.S. market with negative equity as of April 2018. One of the best performing stocks of this century, Domino’s, has had negative book equity since it went public in 2004. Other high-profile companies that had negative book equity in April 2018 were HP Inc. (HPQ), Motorola (MSI), Denny’s (DENN), AutoZone (AZO), Wayfair (W), H&R Block (HRB), and Yum Brands (YUM).
That there are documented high-profile B/M outliers, suggesting book equity is meaningless as a measure of value in just a few instances, is not necessarily the point though. Instead, it is the very understanding behind the existence of these high-profile outliers where problems with drawing any conclusions about “value” or “growth” from the B/M ratio arise. In Boeing’s case, the company incurred an increased pension liability due to the market turmoil of the Financial Crisis that caused an equity adjustment, driving book equity into negative territory. The negative equity at McDonald’s was driven by share buybacks funded with increased borrowings. To be fair, these items impact the intrinsic-value calculation for both firms, but the absolute or relative level of book equity to market value is still arbitrary for most operating, non-financial companies.
Situations like Boeing and McDonald’s are not merely outliers to be thrown out of quantitative studies, as they are often done when book equity is being studied. One might as well throw out all the other companies, too. Almost every company’s book equity is impacted one way or another by one-time items, their capital structure, and their dividend policy. This means that for a large number of companies, not just the ones that have negative or negligible measures, accounting book equity for operating, non-financial entities can be considered mostly arbitrary and largely unreliable when it comes to any measure of “value” or “growth.” Book equity may, indeed, depend more on one-time adjustments, a company’s capital structure, or its dividend policies than truly anything else.
So what are we trying to say? For one, intrinsic value investing is not dead (in some ways, it is doing really well), and its popularity may be suffering from an association with the traditional quantitative value factor, which has been doing very poorly in live, walk-forward studies. These studies are all over the media, too. Where we believe that continuous arbitrage of price-to-fair value opportunities will lead investors to long-term success as in intrinsic value analysis (and what we do at Valuentum), we do not believe that the traditional value factor, which has underperformed more in its live, walk-forward testing than its near-100 year backtest, will lead to success.
Price as the numerator of any valuation multiple is driven by the enterprise valuation construct. (Image Source: Valuentum)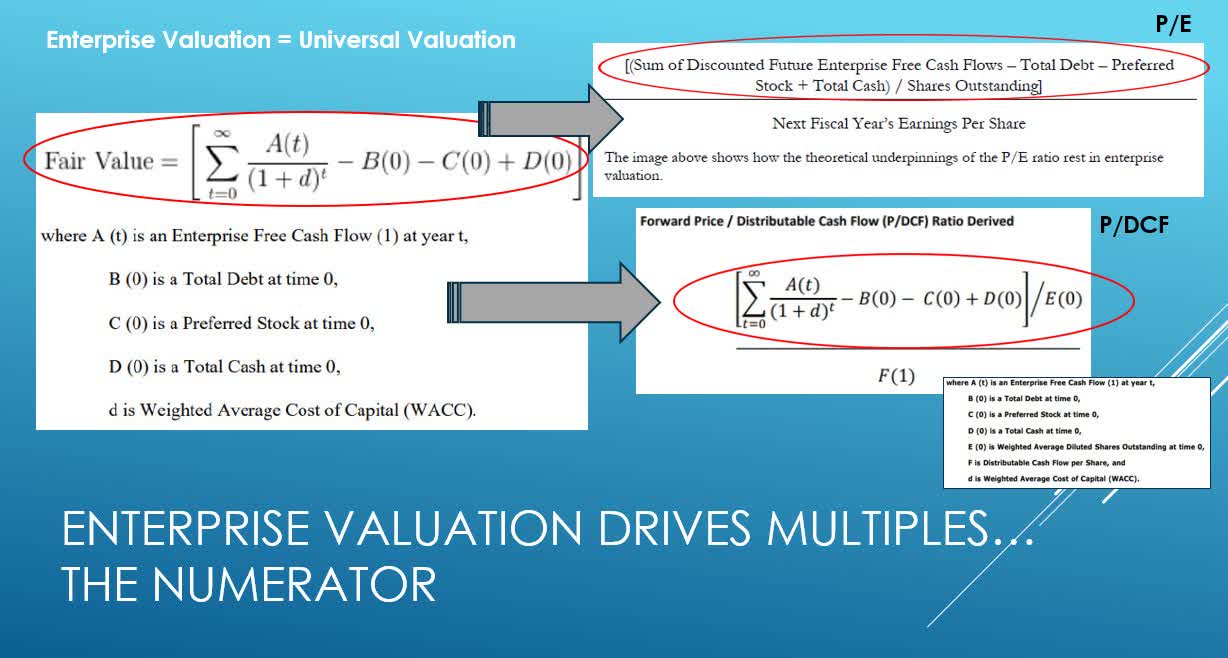
Intrinsic value estimation involves building an entire discounted cash-flow modeling framework on the basis of firm-specific fundamentals, while the traditional quant factor looks at a company’s price-observed P/B ratio, which in a large sense may represent an impractical and ambiguous measure of value. Your knowing of this could mean the difference between investing in true intrinsic value processes, as in enterprise valuation, and investing in potential spurious correlations of value, as in many or some quantitative applications, in my view. To be successful, the investor must first understand the true definition of intrinsic value, something that drives multiples, not something that is derived by multiples (see image above).
At the beginning of this article, we showed the vast underperformance of a small cap value ETF relative to a large cap growth ETF. If you were a value investor and you relied on these quant labels to make decisions, you’d fall into the exact trap that we’re guarding against. Not only are there the same companies in both traditional value and growth indices, but we believe the area of large cap growth is actually made up of some of the most undervalued stocks on the market on the basis of intrinsic value processes, as shown in the image below. To us, large cap growth is value, while value on most ETF labels is largely meaningless. Confusing, no? Well, we hope we were able to sort this out a bit in this article.
We think the area of large cap growth consists of some of the most undervalued stocks on the market today. (Image Source: Charles Schwab)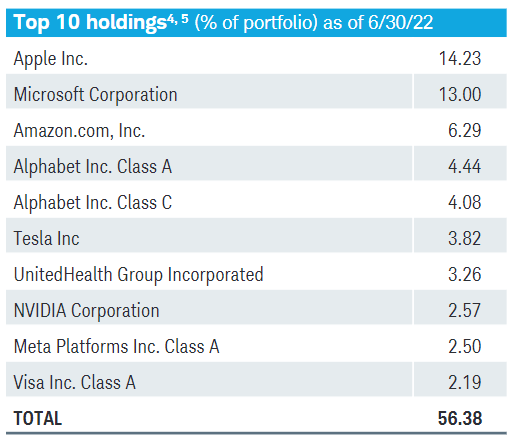
With all of this said, let’s now talk Berkshire Hathaway, which is a huge proponent of the intrinsic valuation process.
Berkshire, The One True Approach to Value Investing
Image Shown: Berkshire Hathaway Inc is a stellar cash flow generator in almost any operating environment. (Image Source: Berkshire Hathaway Inc – 10-Q SEC filing covering the Second Quarter of 2022)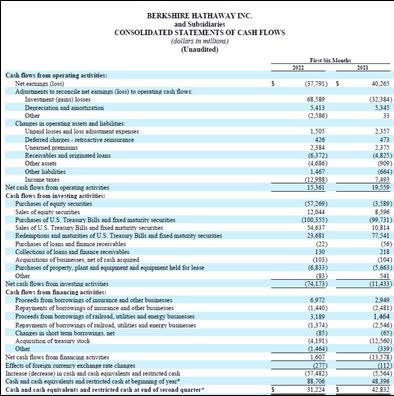
Berkshire Hathaway reported second quarter 2022 earnings in early August that saw its ‘operating earnings’ metric surge higher versus the year-ago level. This metric removes realized and unrealized gains/losses in its large equity portfolio from the picture to provide investors with a better understanding of the company’s underlying performance. Due to the downturn in equity markets seen during the first half of this year, Berkshire Hathaway’s GAAP net income swung to a large net loss last quarter. We love shares of Berkshire Hathaway Class B (ticker: BRK.B), and our fair value estimate sits at $320 per share with room for upside potential.
To arrive at our $320 per share fair value estimate of Berkshire Hathaway’s B shares, we assign a 1.5x price-to-book (P/B) multiple per Class B book value per share of ~$213.40 at the end of the third quarter of 2021 [BV per share: $481.1 billion/2.25 billion shares]. We assign a margin of safety band of 20% to arrive at the fair value estimate range for its B shares. The fair value estimate has been effective, as of January 12, 2022. Please note that, for general industrial firms, book equity may not make a lot of sense in valuation, but for banking/financial firms, it may be a better way to gauge intrinsic value through residual income methods rather than the free-cash-flow-to-equity process. Said another way, book equity is quite arbitrary for general industrial firms and therefore largely nonsensical in quant applications, while cash-based analysis for banks and insurers is less-than-ideal, given that most use cash to generate cash. For this reason, we tend to stay away from banks and financials given that they are very difficult to value intrinsically.
Earnings Update
Berkshire Hathaway’s operating earnings rose 39% year-over-year in the second quarter of 2022 to reach $9.3 billion. All of its core business reporting segments reported nice operating earnings growth last quarter on a year-over-year basis including its ‘Insurance-underwriting’ (up 55%), ‘Investment-investment income’ (up 56%), ‘Railroad’ (up 10%), ‘Utilities and energy’ (up 4%), and ‘Other businesses’ (up 8%) segments. Its ‘Other’ business reporting segment swung from a loss in the same period last year to a gain in the second quarter of 2022 due largely to gains from non-US dollar-denominated debt as the US dollar has been quite strong of late. We appreciate the widespread strength seen across Berkshire Hathaway’s business portfolio last quarter.
Image Shown: Berkshire Hathaway reported year-over-year growth in the operating earnings across all of its core business reporting segments last quarter. (Image Source: Berkshire Hathaway – Second Quarter of 2022 Earnings Press Release)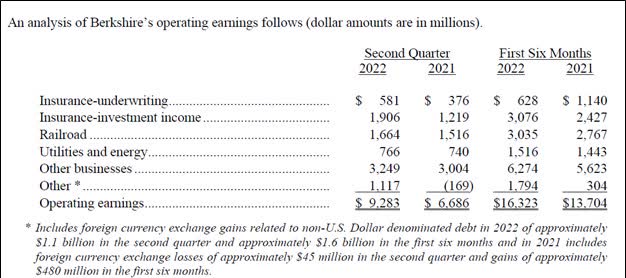
On a GAAP basis, Berkshire Hathaway’s total revenues grew 10% year-over-year to reach $76.2 billion, though $66.9 billion in investment and derivative contract losses resulted in a $43.8 billion net loss last quarter. The performance of Berkshire Hathaway’s investment portfolio is significant given the portfolio represents a sizable chunk of its intrinsic value; however, it’s important to differentiate the performance of its operating businesses from its investment portfolio.
During the first half of 2022, Berkshire Hathaway generated $8.5 billion in free cash flow and spent $4.2 billion buying back its stock. We view Berkshire Hathaway’s share repurchases as a good strategy in moderation given that shares of BRK have been trading moderately below our estimate of their intrinsic value during most of the first half of this year. Furthermore, shares of BRK.B are trading meaningfully below our estimate of their fair value as of this writing. Berkshire Hathaway will likely continue buying back meaningful amounts of its stock going forward.
Given Berkshire Hathaway’s massive cash-like balance at the end of June 2022 ($106.1 billion when looking at its cash and cash equivalents and short-term investments in US Treasury bills, and that’s exclusive of $21.1 billion in its investments in fixed maturity securities), we are intrigued by the potential acquisition opportunities Berkshire Hathaway may pounce on in the current environment.
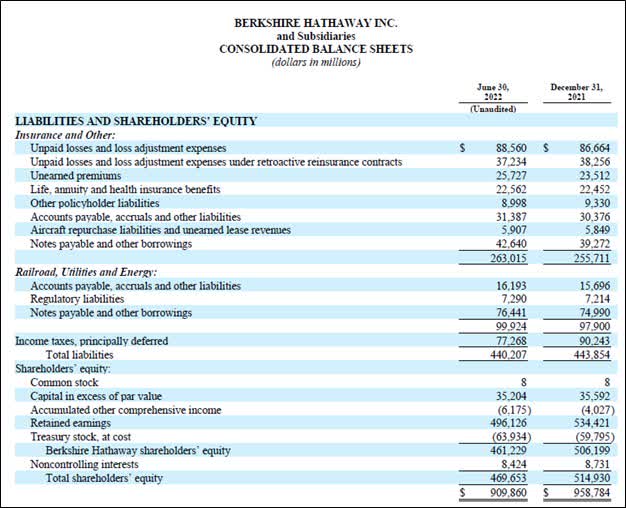
Berkshire Hathaway could capitalize on recent equity market weakness to acquire an undervalued enterprise outright or make a large strategic investment in one. For instance, Berkshire Hathaway has been steadily acquiring a large equity position in Occidental Petroleum Corporation (OXY) in recent months, a significant oil & gas producer with a sizable petrochemical and energy infrastructure footprint. Please note that Berkshire Hathaway also has substantial non-cancellable financial liabilities on hand as well, though it still has the funds to make a needle-moving deal. At the end of June 2022, Berkshire Hathaway’s insurance float stood at ~$147 billion.
Image Shown: We are intrigued by the potential acquisition opportunities Berkshire Hathaway may pursue in the current environment, given its large cash-like position on hand at the end of June 2022. (Image Source: Berkshire Hathaway – 10-Q SEC filing covering the Second Quarter of 2022) Image Shown: Berkshire Hathaway had substantial non-cancellable financial liabilities on hand at the end of June 2022, including debt and insurance policy-related liabilities. (Image Source: Berkshire Hathaway – 10-Q SEC filing covering the Second Quarter of 2022)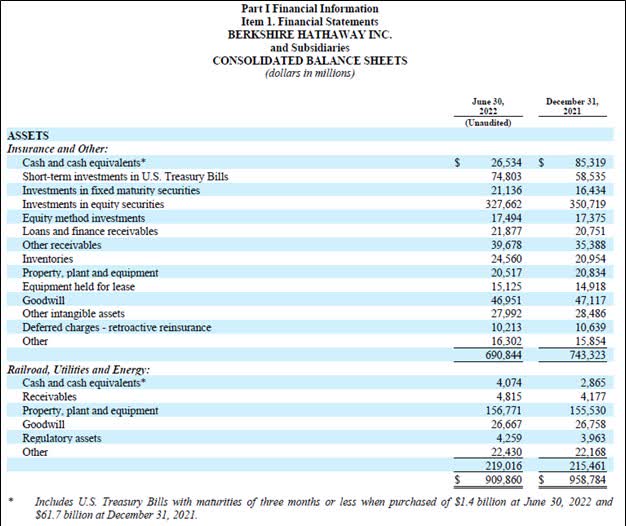
Concluding Thoughts
Berkshire Hathaway is a stellar free cash flow generator whose core businesses have been doing great of late. The conglomerate’s industrial (energy, utilities, railroad) and insurance businesses have proven to be incredibly resilient. Looking ahead, Berkshire Hathaway has multiple levers to pull when it comes to generating shareholder value, from additional share buybacks to a potential needle-moving acquisition. We continue to like Berkshire Hathaway as the pioneer of value investing, and we caution investors away from statistical processes that may be too dependent on garbage in, garbage out analysis.
This article or report and any links within are for information purposes only and should not be considered a solicitation to buy or sell any security. Valuentum is not responsible for any errors or omissions or for results obtained from the use of this article and accepts no liability for how readers may choose to utilize the content. Assumptions, opinions, and estimates are based on our judgment as of the date of the article and are subject to change without notice.
Be the first to comment