

Paul Morigi
Warren Buffett’s Berkshire Hathaway (NYSE:BRK.A) (NYSE:BRK.B) has performed with distinction during the 2022 bear market. Diversification of business units and equity investments outside of the imploding Big Tech sector are the primary reasons. A massive $108 billion in cash and short-term investments ($57 billion in net working capital) at the end of September didn’t hurt either, assets uncorrelated to price swings on Wall Street.
Making up 80%+ of the conglomerate’s rough $300 billion equity investment portfolio, Apple (AAPL), Bank of America (BAC), Coca-Cola (KO), Chevron (CVX), American Express (AXP), Kraft Heinz (KHC), Occidental Petroleum (OXY), and Moody’s (MCO) have performed far better as a group than the S&P 500. These eight long-term stock investments represent about 40% of the current equity capitalization of Berkshire and a little less than 30% of total reportable assets.
YCharts – Berkshire Hathaway, Top 8 Equity Investments by Size, 1-Year Total Returns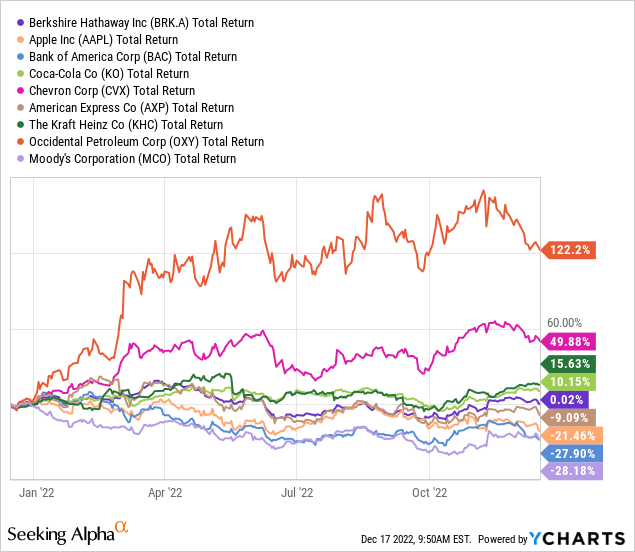
Insurance policy writing from the wholly-owned GEICO auto coverage division and industry-leading reinsurance operation, plus the Burlington Northern Santa Fe railway (among other businesses) do provide financial stability and some beneficial diversification in operations during bear markets. In aggregate, Berkshire’s quality assets alongside something of a rebirth in investor interest in the firm have delivered a flat return for owners over the last 12 months. The good news is this performance has handily bested the S&P 500 total return loss of -16% since the middle of December 2021.
YCharts – Berkshire Hathaway vs. S&P 500 Total Returns, 1 Year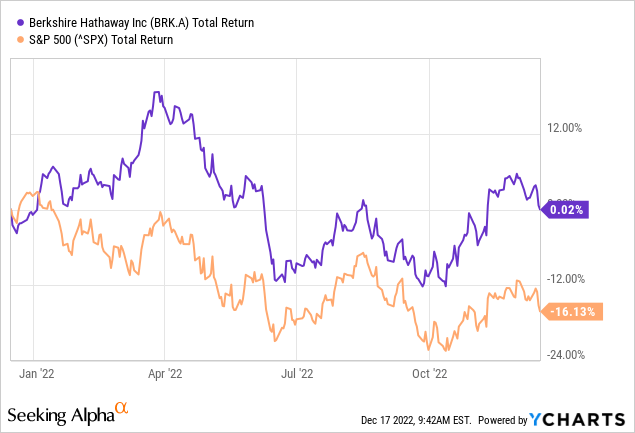
However, recessions can be a different animal to handle, especially if we get a deep economic contraction in 2023. December’s record 40-year inversion spread in the Treasury debt market yield curve (3-month vs. 30-year rates) is a screaming red flag our economy is poised to head lower next year. So, let’s review past recession performance by the Berkshire conglomerate to understand what may lie ahead for shareholders.
Recession Performance Since 1981
Below is a graph of Berkshire’s Class A price change since 1981, on a log scale. Compounded total returns (the company does not pay a dividend) have been +18.5% a year, with an astounding price rise from $400 to $454,620 per share! However, most of the gains were frontloaded on the chart with peak growth rates achieved before 1999. The standout idea is recessions have not been kind to the company (shaded in grey), and statistically represent the worst times to own Berkshire.
YCharts – Berkshire Hathaway Class “A” Price, Since 1981, Recessions in Grey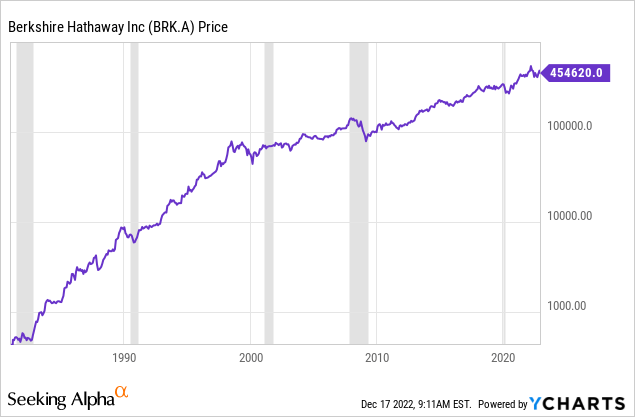
If you could avoid owning shares during recessions, your returns would be even better for compounding money. Interestingly, an inverted yield curve in Treasury bonds (like today) was present before every past recession over this research span. I discussed a month ago here the rotten performance for the Dow Jones Industrial Average after major Treasury yield-curve inversions.
2020 COVID Pandemic
One example of a dud “relative” period to own Berkshire vs. a plain-vanilla S&P 500 position occurred between September 2019 and September 2020, the economic shutdown pandemic year. While returns largely mirrored the main U.S. equity index into April 2020 (with a -30% price drop in early 2020), excessive levels of cash (going into a sharp market rebound) and a number of cyclical businesses dragged down results as the economy tried to recover.
YCharts – Berkshire Hathaway vs. S&P 500 Total Returns, Sept 2019 to Sept 2020, Recession in Grey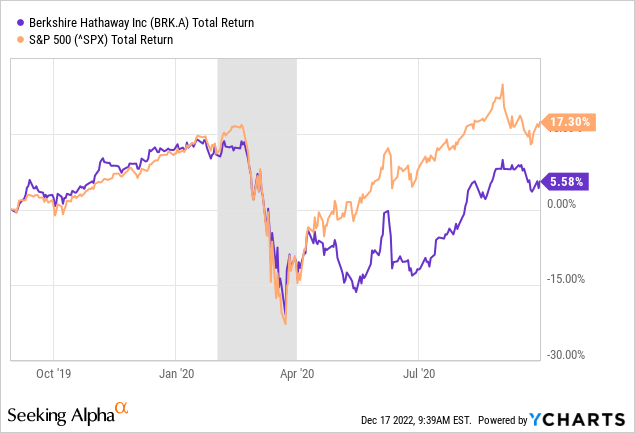
2008 to 2009 Great Recession
Berkshire Hathaway fell hard by nearly -50% during the official 2008 to early 2009 recession span, and struggled to rebound afterward. 2007 was not the worst year for the company’s share quote, so it did perform better than the S&P 500 over the entire “bear” equity market span between the middle of 2007 into March 2009. If you narrow down your focus to negative real GDP quarters, however, this company was far from an outperformance selection.
YCharts – Berkshire Hathaway vs. S&P 500 Total Returns, 2008 to 2009, Recession in Grey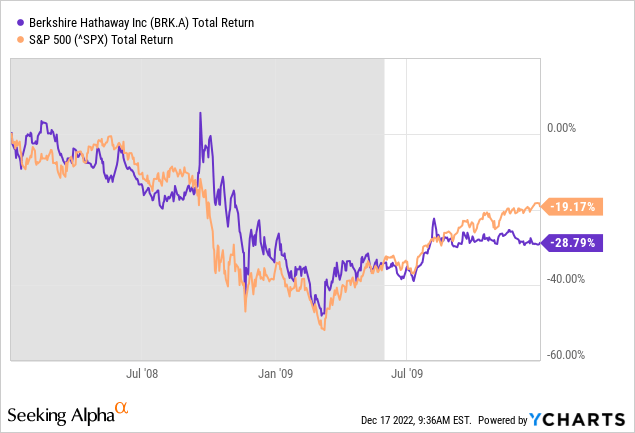
2001 to 2002 Tech Bust
One period that did show both bear market and recession outperformance was the original Technology Bust of 2000 -02. On the graph below, you can review Berkshire’s steady returns (minor losses) outlined at the tail end of the stock market bust and recession vs. the S&P 500.
YCharts – Berkshire Hathaway vs. S&P 500 Total Returns, 2001 to August 2002, Recession in Grey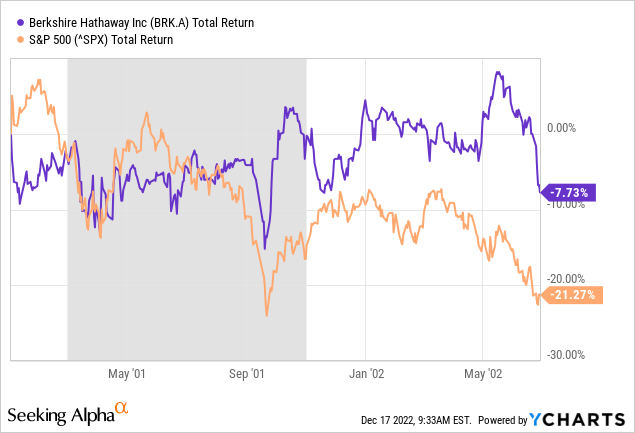
1990-91 Persian Gulf War
Berkshire was not a particularly great place to park your money in 1990. An inverted yield curve in late 1989 and early 1990 warned of trouble ahead for the market, then Saddam Hussein (Iraq) invaded Kuwait, sending economic fear (spiking crude oil prices) and war tensions to Wall Street. Between January and October 1990, Berkshire declined -35%, dramatically underperforming the S&P 500 index.
YCharts – Berkshire Hathaway vs. S&P 500 Total Returns, 1990 to June 1991, Recession in Grey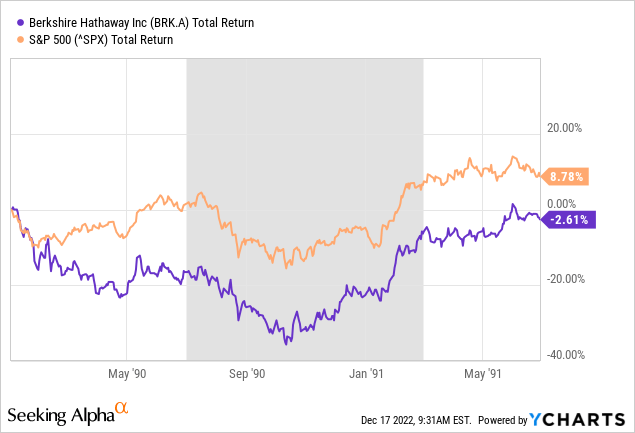
1982 Volcker Interest Rate Spike
The 1982 recession came at the end of the wicked 1970s inflation super-cycle. Fed Chairman Paul Volcker finally raised interest rates well ABOVE cost-of-living adjustments for the economy (Fed Funds would have to double from 4% today to 8%). This effort helped to instill confidence that interest rates could only head in one direction – lower, which propped up big bond holders like insurance companies. At the time, GEICO was Berkshire’s largest investment (then publicly traded) and oversized gainer in 1982. Investments in the Washington Post (now owned by Jeff Bezos) and others had a strong year also, pushing Berkshire’s price gain well above the S&P 500.
YCharts – Berkshire Hathaway vs. S&P 500 Price Change, 1981 to 1982, Recession in Grey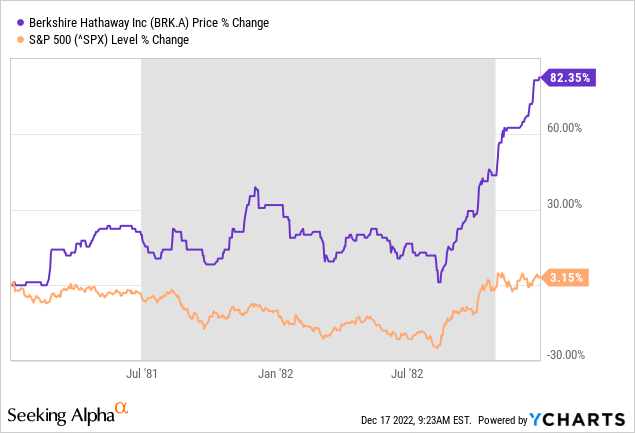
Final Thoughts
I know many of Berkshire Hathaway‘s cultish followers and Mr. Buffett himself are flustered with this reality, but the company’s total return for investors has only been able to achieve a mild “beat” vs. the S&P 500 since the 2002 recession ended. Believe it or not, gold bullion buried in your backyard has delivered the same advance in dollar value as owning Berkshire over the last 20 years (widely besting the S&P 500)!
YCharts – Berkshire Hathaway vs. Gold Price and S&P 500 Total Returns, Since 2002 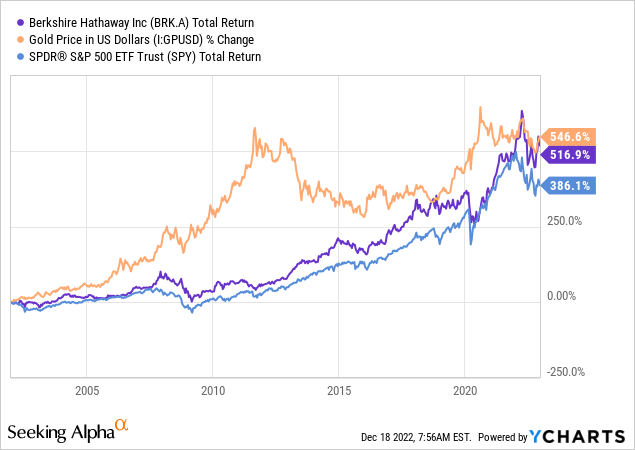
Since the Dotcom technology boom turned to bust in the year 2000, honest economic growth has almost completely disappeared for two decades in America. Stock market (and bond market) pricing have been largely a function of Federal Reserve money printing trends in my view, especially when paired with record deficit-required Treasury borrowing by Uncle Sam, directly financed with QE bond buying since late 2008. In other words, little inflation-adjusted economic growth has been part of our world for some time. Stocks have risen with money printing devaluations (inflation) in the economy, highlighted by the strong gold rise in debased U.S. dollars.
Anyway, given a recession is next, I don’t have an issue with small retail investors owning Berkshire Hathaway. It is a defensive pick for sure, with manageable debts, enormous liquid investments, and greater diversification than the typical Wall Street pick. I suspect Berkshire may fall less in percentage terms during 2023 than the S&P 500, just like 2022’s experience, assuming the selloff continues. If you are contemplating purchasing shares around $300, I would wait for lower prices. I am modeling a Berkshire -10% to -15% price decline into March as a probable outcome (this calendar month has produced major stock market bottoms numerous times in the past).
All told, a U.S. recession will likely bring increasingly negative effects to a list of cyclical business operations and Berkshire’s extensive stock holdings. There are scenarios where a sizable share price drawdown could mimic previous recession spans throughout history. In my view, Wall Street in general has not seriously discounted a drop in corporate earnings witnessed during recessions. If a severe contraction in GDP appears soon, sharply declining business earnings and worker incomes in the economy could snowball into another -20% or -30% shrinkage in stock quotes during 2023, including Berkshire.
More bad news, total U.S. market capitalization to nominal GDP stats still argue a major haircut on Wall Street remains a possibility. One of Warren’s favorite valuation tools over the decades remains near record highs (excluding the crazy Fed money printing 2020-22 experience) drawn below. The U.S. stock market remains overvalued by 30% vs. the 50-year median average of this data point and would have to trade -70% lower to reach the 1982 low.
YCharts – US Stock Market Value vs. GDP Output, Since 1972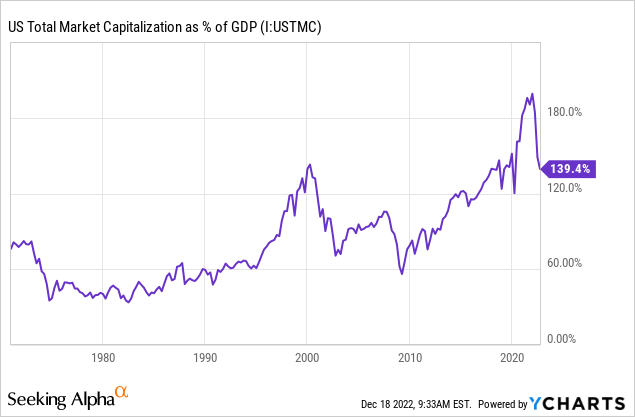
And, while investor pessimism is high (typically indicative of an approaching equity bottom), the level of “fear” is not. My baseline forecast is a final blowout in investor sentiment fits together nicely with the advent of a significant rise in unemployment during the first half of 2023 (usually the last lagging indicator of recession to appear).
I would not be surprised by a negative return from Berkshire for all of 2023. If this is our reality, holders of cash-like investments will actually generate stronger gains (on rising short-term yields) over both 2022 and 2023 than shareholders of most every U.S. equity, including Buffett’s operation.
Consequently, the highest rating I can give Berkshire Hathaway is a Hold/Neutral setting. Buying on weakness for long-term portfolios is my suggestion. For sure, I would keep investment return expectations lower than a decade or two ago. The company is so massive in size and diversified in businesses owned, macroeconomic returns similar to the S&P 500 are likely. Mr. Buffett has expressed as much for years.
Thanks for reading. Please consider this article a first step in your due diligence process. Consulting with a registered and experienced investment advisor is recommended before making any trade.
Be the first to comment