Marti157900/iStock Editorial via Getty Images
When looking back at the past several years, there are plenty of case studies on failed retail turnarounds and very few on successful ones. While the jury is still out on Bed Bath & Beyond (NASDAQ:BBBY), it is too early in the turnaround process for their shares to be trading at their current valuation. After a disruption caused by pandemic restrictions, management now has to navigate through supply chain headwinds, like historically high freight rates and port congestion. This has caused a massive y/y decline in margins and has fueled pessimism among investors. As shares are down 50% YTD, it seems like any hope for a successful turnaround has been abandoned.
Despite disappointing results these past two quarters and a gloomy outlook for the first half of the upcoming fiscal year, there are still many reasons for optimism. While a sale of buybuy Baby is still very much on the table, easing supply chain conditions alone could send shares soaring. If you’ll indulge me in a bit of well-placed optimism, I’ll make the case for why these two scenarios could very well occur and the impact they would have on BBBY’s share price.
Gross Margin Outlook
Retailers all across the sector are seeing their margins shrink as supply chain issues increase their product costs. Bed Bath & Beyond’s margins are no exception. BBBY’S Q4 FY21 gross profit margins were 28.8%, down 400 bps y/y. According to management, the reasons for this 400bps y/y decline were:
- 360 bps related to port, freight, and shipping inflation:
- 100 bps due to first time fee for inventory held at ports
- 170 bps due to higher than expected freight and shipping costs
- 90 bps due to warehouse-related inventory adjustments
- 40 bps from product cost increases net of marketing and price optimization
As per CFO Gustavo Arnal (from the earnings call linked above):
Turning to gross margins. We’re expecting modest gross margin expansion for the full year. Gross margins in the second half of the year are anticipated to improve year-on-year as comparisons ease and supply chain conditions improve.
On the bright side, this recent gross margin decline seems unlikely to persist at the same magnitude. The first time port-related fee seems like a one-time blunder and, according to management, the same goes for the warehouse-related inventory adjustments. As far as freight and shipping costs go, freight costs have been on the decline since their peak in the fall of 2021. Also, new container ships are currently being built and are scheduled for delivery in 2023. Therefore, without any significant surprises, I would be surprised to see freight costs remaining elevated past the next few quarters.
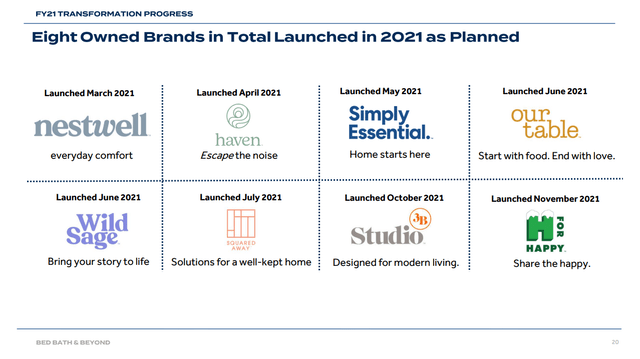
BBBY Q4 Earnings Call Presentation (SA Uploaded Presentation)
On the even brighter side, Bed Bath & Beyond has launched 8 of their own brands this past year. Company-owned brands tend to have much larger profit margins than third-party brands. With a reported 25% run rate, Bed Bath & Beyond has been doing a stellar job of marketing and selling these brands to their customers. If this trend continues, we could see a significant uptick in gross profit margins in the coming quarters.
buybuy Baby Sale Still In Play
Enter Ryan Cohen, founder of Chewy turned activist investor. Buying up an almost 10% stake in BBBY, Ryan Cohen advocated for a sale of BBBY’s baby business, buybuy Baby. Since then, BBBY has added 3 new board members and has appointed them to a new committee tasked with assessing how buybuy Baby can unlock value for BBBY’s shareholders. All corporate jargon aside, a full or partial sale of buybuy Baby is a real possibility. However, the 2 questions investors want to know are: Is there sufficient interest among potential buyers? And, if so, how much could it sell for?
Why the Interest?
Let’s start by looking at reasons why potential buyers would be disinterested in buybuy Baby. First, with U.S. birth rates declining every year, 2021 being an exception, buybuy Baby is not a “big player in an emerging market” type that attracts the majority of investors. The U.S. baby products market is only expected to grow at a 3.7% CAGR from now until 2030. We also have the possibility that buybuy Baby may not be profitable when taking into account the increased overhead that comes with detaching from Bed Bath & Beyond. To make matters worse, an environment of rising rates makes debt financing less attractive for cash-strapped corporations and private equity firms. Even if rising rates don’t deter buyers, the average bid could be lower than it would have been during last year’s economic boom given new macroeconomic uncertainty.
While the above reasons are enough to make any BBBY shareholder pessimistic about a buybuy Baby sale, there are still plenty of reasons for optimism. According to management, buybuy Baby hit $1.4B in sales for FY21. Management also stated that buybuy Baby had double-digit growth compared to FY20, but that figure is misleading when you consider that FY20 revenue was negatively affected by the pandemic. The better indicator is the reported single-digit comparable sales growth of buybuy Baby, while the bed and bath banner experienced comparable sales growth of -15%. When accounting for 20-25 new locations planned for this year, I am confident that buybuy Baby’s net sales will continue to grow and their comparable sales will sustain a low single-digit growth rate. Another optimistic figure is buybuy Baby’s >50% digital penetration of total sales. A modestly growing business with a solid e-commerce channel is definitely worthy of an investor’s attention.
A report by the WSJ in April confirmed that a couple of buyers have already expressed interest in buybuy Baby. While this is a good sign, interest is not the same as an offer and there are currently no details on any bid amounts.
Potential Value?
While management has been reluctant to give sufficient enough specifics on buybuy Baby’s financials to speculate a valuation, they did reveal that buybuy Baby’s adjusted EBITDA margin for FY21 was in the mid-single digits. Using the $1.4B figure, we can assume that adjusted EBITDA for buybuy Baby is in the $56M-$84M range. The issue with this estimate is that we do not know the exact adjustments management made to arrive at a mid-single digit figure. The adjustments are important as one of the main concerns I mentioned is the profitability of buybuy Baby when separated from its parent company. Still, we can use this EBITDA figure to get a rough idea of buybuy Baby’s market value.
Using 2 public specialty retailers that have a similar target audience to that of buybuy Baby’s, I created a chart using 5 different metrics. I believe these metrics are relevant to determining buybuy Baby’s standing among its competitors as well as its potential market value. These 5 metrics are: North American retail sales, digital sales penetration, physical stores, EV/Sales, and EV/EBITDA.
| Company: | FY21 North America Retail Sales | Digital Sales % | Physical Stores | EV/Sales (FWD) | EV/EBITDA (FWD) |
| buybuy Baby (Private) | $1.4B | 50%+ | 130 | N/A | N/A |
| Carter’s Inc. (CRI) | $1.9B | 40%(2) | 751 | 1.48 | 10.59 |
| The Children’s Place Inc. (PLCE) | $1.7B(1) | 45%(3) | 582 | .9 | 12.7 |
(1) Sales figure includes U.S. Wholesale Sales
(2) Denominator includes International Retail Sales
(3) Denominator includes International and Wholesale Sales
While these companies’ target audience is similar to buybuy Baby’s, these three companies are far from identical when it comes to product mix. Still, we can see that when it comes to specialty baby retailers, buybuy Baby’s domestic retail sales are very close to its competitors’, despite a much smaller physical footprint. Also, its digital penetration is slightly higher. The conclusion I derive from the first 3 columns is that buybuy Baby can compete on the same playing field as similar specialty retailers. This is attractive to buyers looking to enter, or expand their reach in, the baby products industry.
I included the last 2 columns, 5-year Average EV/Sales and EV/EBITDA, for those who may be curious as to what valuation buybuy Baby could get based on the valuation of its public competitors. However, I believe Carter’s EV/sales to be a bit on the high end and not very comparable to buybuy Baby. This is primarily due to Carter’s international and wholesale segments accounting for almost 50% of their total revenue. These revenue segments do not apply to buybuy Baby at this time.
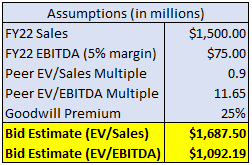
Below is a speculative buybuy Baby bid estimate using PLCE’s EV/sales multiple and the midpoint of both Carter’s and PLCE’s 5 year average EV/EBITDA:
Buybuy Baby Bid Estimate (Image by Author using data from peer group’s recent 10K)
The $1.5B FY22 revenue assumption factors in 20-25 planned store openings. I used 5% as the EBITDA margin to reflect the “mid-single digits adjusted EBITDA margin” statement by management. Although the goodwill premium could be higher than 25%, I kept it conservative to reflect a mature baby products industry and a rising interest rate environment. Although this is a highly speculative calculation based on limited public information on buybuy Baby, a sale price between $1.1B to $1.7B seems reasonable.
BBBY’s Upside
With buybuy Baby Sale…
Assuming the buybuy Baby subsidiary sells for around $1.1B to $1.7B, shares could theoretically triple as over $1B in cash is added to BBBY’s total assets. BBBY’s management could use that money to pay down debt or buy back even more shares. Paying down debt would reduce interest expense resulting in expanding profit margins and buying back even more shares would continue management’s goal of returning value to shareholders. In my assessment, a large cash injection into the company gives Bed Bath & Beyond another several years of ample liquidity to turn the company around and further increase shareholder value.
Without buybuy Baby Sale…
Now, some investors do not want to risk their capital on a potential sale of a subsidiary. So, how undervalued is BBBY without a sale of buybuy Baby? That question may be hard to answer using standard metrics considering they reported negative operating income in these past two quarters and I believe they will likely report negative operating income for the next two quarters. Therefore, a better question is: When will Bed Bath & Beyond return to positive EBITDA?
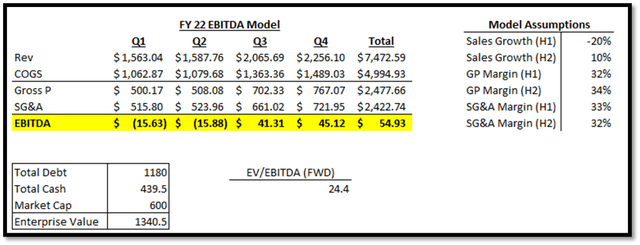
Splitting up FY22 into two halves, I conducted an EV/EBITDA model using the following assumptions based on statements by management and my own reasoning:
- H1 of FY22
- -20% sales growth, 32% gross profit margin, 33% SG&A/Rev
- Double digit sales decline factors in the 200 stores closures in FY21 as well as management’s statement of inflation affecting consumer spending
- 32% conservative gross margin assumption accounting for a recent decline in freight costs but supply chain conditions still too chaotic to replicate FY21 Q1’s and Q2’s gross margin of 34.86% and 34%.
- 33% SG&A/Rev assumption is in-line with prior period and takes into account management’s $100M SG&A optimization plan for this year
- -20% sales growth, 32% gross profit margin, 33% SG&A/Rev
- H2 of FY22
- 10% sales growth y/y, 34% gross profit margin, 32% SG&A/Rev
- Conservative 10% sales growth accounting for a scenario where BBBY does not lose out on $175M in revenue due to port congestion and stranded inventory. Also includes scenario where previous store remodeling helps drive in more sales.
- Gross profit margin of 34% assumes significant easing of supply chain pressures and continuing company-owned brands penetration.
- 32% SG&A/Rev assumption takes into account H2 sales growth and management’s $100M SG&A optimization plan
- 10% sales growth y/y, 34% gross profit margin, 32% SG&A/Rev
FWD EV/EBITDA Model for FY22 (Model by Author using recent 10k and the above assumptions)
Using Q1 FY22 as the starting point and working with the above assumptions, we get a 24.4 EV/EBITDA multiple. This is much higher than the sector median of 12. Using this calculation alone, BBBY shares seem overvalued. However, if we push the starting line to Q3, when management projects supply chain conditions easing significantly, we get a much different multiple.
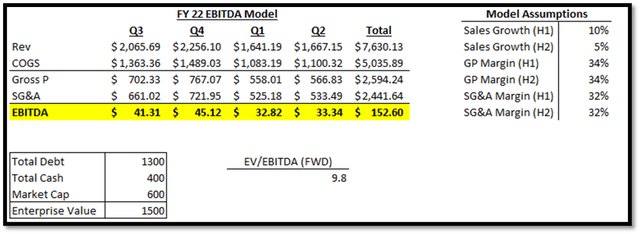
EV/EBITDA Model for H2 ’22 to H1 ’23 (Model by Author using the above assumptions and 10k Data)
Assuming gross margins return to normal in H1 of FY23, due to improved macroeconomic conditions and more penetration of company-owned brands, BBBY could generate ~$150M in EBITDA. This would bring their EV/EBITDA multiple below the sector median of 12, assuming no major change to their EV. Based on my analysis, I do not see Enterprise Value changing significantly during this time period. With expected capex of $400M and no planned share buybacks, I believe cash balance will hover between $350-$500M depending on how much positive operating cash flow BBBY can generate and how much of their $1B revolving credit facility they end up utilizing.
Their first chunk of senior unsecured debt, totaling $289M, does not mature until August 2024, so I do not believe we will see a significant reduction in debt anytime in the next several quarters. To be conservative, I tacked on $120M in new debt and a $40M reduction in total cash to reflect a scenario where operating cash flow is much lower than capex. With that, BBBY’s market cap would have to rise to ~$900M to return to an acceptable 11.8x FWD EV/EBITDA multiple. That would mean ~50% upside if bought at the $7 price ($600M market cap) shares hover at currently.
While this analysis is sensitive to assumptions, I refrained from being overly optimistic in my sales growth and gross margin assumptions. As a result, my analysis shows how far removed BBBY’s current market cap is from a scenario where margins recover in Q3 ’22. It also implies that buying BBBY shares, in hopes of a sale of the buybuy Baby subsidiary, may still offer a sizable upside even if the divestiture does not go through.
Risks
Supply Chain Headwinds Persist
Although I’ve cited declining freight costs and additional container ship deliveries planned for 2023, freight costs could continue to stay elevated. Geopolitical uncertainty, record fuel costs, and unexpected port congestion could still keep prices elevated into 2023. This would keep margins suppressed for longer than the above analysis expects.
Consumer Spending Dwindles
With higher prices at the pump and uncertainty surrounding the Fed’s efforts to reduce inflation, consumer spending may take a significant hit as interest rates rise. This would put BBBY at risk of even lower sales growth and ultimately, lower EBITDA margins.
Final Thoughts
Bed Bath & Beyond is not a shining example of an old retailer thriving despite changing times. Prior to 2020, it was heading down the path of other now-bankrupt retailers. One of the main factors of any successful turnaround is time – more specifically, liquidity. With ample liquidity and a determined management, any declining retailer has a shot at survival. It seems like Bed Bath & Beyond has both of these.
While it is much too early in the turnaround process to accurately assess management’s performance, shares are close to their 52-week low and short interest has hit 28%. It seems as if the bears are ignoring 2 possible catalysts, gross margin recovery and a buybuy Baby sale, that could send BBBY shares soaring. For that reason, I am modestly bullish on BBBY shares given an 18-month time horizon.


Be the first to comment