

Darren415
This article was first released to Systematic Income subscribers and free trials on Aug 6.
Welcome to another installment of our BDC Market Weekly Review, where we discuss market activity in the Business Development Company (“BDC”) sector from both the bottom-up – highlighting individual news and events – as well as the top-down – providing an overview of the broader market.
We also try to add some historical context as well as relevant themes that look to be driving the market or that investors ought to be mindful of. This update covers the period through the first week of August.
Be sure to check out our other Weeklies – covering the CEF as well as the preferreds/baby bond markets for perspectives across the broader income space. Also, have a look at our primer of the BDC sector, with a focus on how it compares to credit CEFs.
Market Action
BDCs were the best performing income sector that we track this week with a gain of around 1.5%. Good earnings reports, stable credit spreads, higher stocks and higher short-term rates all supported the sector.
Year-to-date returns are quite dispersed, however, the average total return of around -4% is fairly strong within the broader income space.
Systematic Income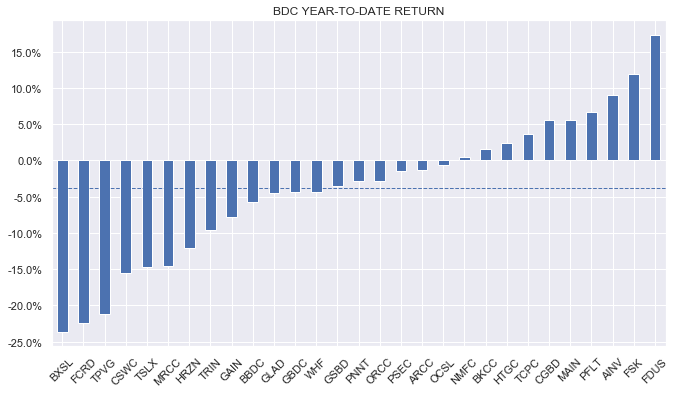
BDCs have continued to climb out of their hole and they are about half-way there already.
Systematic Income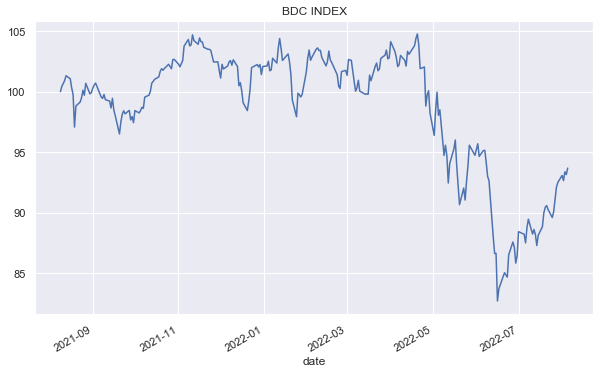
The average reported NAV is down around 2.5% so far in Q2 – a reflection of wider credit spreads we have seen over Q2. On a mark-to-market basis, however, this would likely be closer to a drop of around 1.5% as credit spreads have tightened back significantly since the end of the quarter.
Systematic Income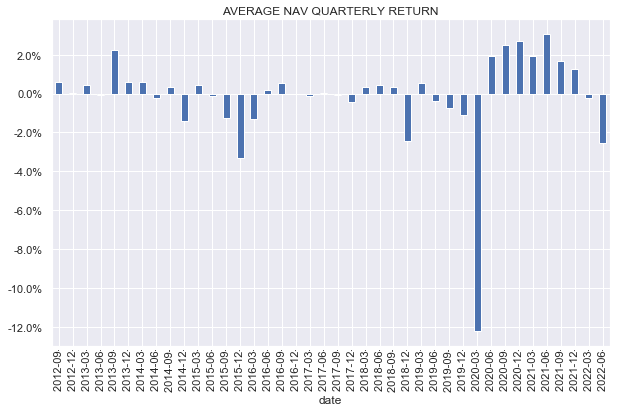
The average valuation in the sector has sharply bounced back towards its historical average with the overall sector being fairly-valued based on this metric.
Systematic Income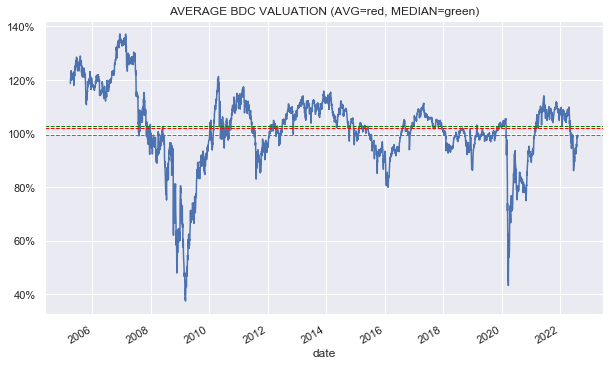
Market Themes
One of the most anticipated pieces of data in the ongoing BDC earnings season is how net income is shaping up across the sector. Sharply higher short-term rates should, in theory at least, lead to rising BDC income levels given the average BDC has around 90% of its holdings in floating-rate securities. The fact that on average about 60% of BDC liabilities are fixed-rate helps also though even if 100% of its liabilities were floating-rate net income would still rise with higher short-term rates, all else equal.
However, theory and practice are not always aligned so here we take a quick look at how net income levels are changing for those BDCs that have reported so far. The chart below shows the quarterly change in net income (blue lines) with the average of this metric shown as a grey line. It also shows the change in net income relative to the trailing-twelve month average (orange lines) with the average of this metric as a yellow line. We use the core or adjusted net income if reported and GAAP net income otherwise. The chart is clipped at +-20% for clarity.
Systematic Income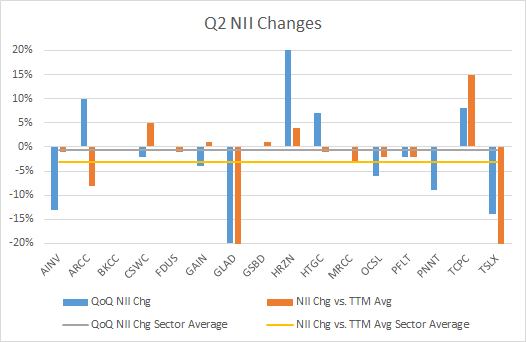
What we see is two things. First, there is a lot of divergence – lots of increases in net income and lots of decreases. This makes sense as there are lots of other drivers of income than just short-term rates and different BDCs are exposed to these other drivers in different ways. The second thing we see is that the average quarterly change in net income was slightly negative at -0.6% (median was -1%). The Q2 change from the trailing-twelve month average was -3.1% (median was -1%). Overall, we can conclude that net income is running pretty flat to slightly lower relative to its recent past on average.
This may come as a surprise to investors who expected a sharp rise in net income, however, there are two key things in play. First, the actual level of Libor that was used in accruing coupons over Q2 was not particularly high. We estimate this level to be around 1% versus 2.8% where Libor is today. A level in Libor of 1% is also roughly in line with the average Libor floor, meaning BDC assets did not actually benefit a whole lot from the rise in Libor from zero to 1% but were hurt somewhat on the liability side where there are no Libor floors. In other words, BDCs have only started to climb out of the NII valley, as we call it, in Q3.
The second key driver of the slight drop in net income so far is that prepayment fees were very large in Q4 which created an artificially high bar for net income figures over the following quarters.
Overall, we are upbeat about net income figures for Q3 given the sharp rise in Libor over the last few months. Non-accruals across the sector are also holding up and BDCs are taking advantage of better pricing to grow their portfolios. We expect these tailwinds to keep net income moving higher on average over the following quarter.
Market Commentary
Q2 earnings continued to dominate news flow in the sector. In this weekly commentary we will highlight only a handful of the reviews we normally do on the service.
Oaktree Specialty Lending Corp. (OCSL) NAV fell 5%. The company has tended to be fairly conservative with its marks relative to the broader sector. We saw the same behaviour in 2020 where its NAV fell much more than the sector average but then bounced right back as spreads tightened.
Systematic Income Preferreds Tool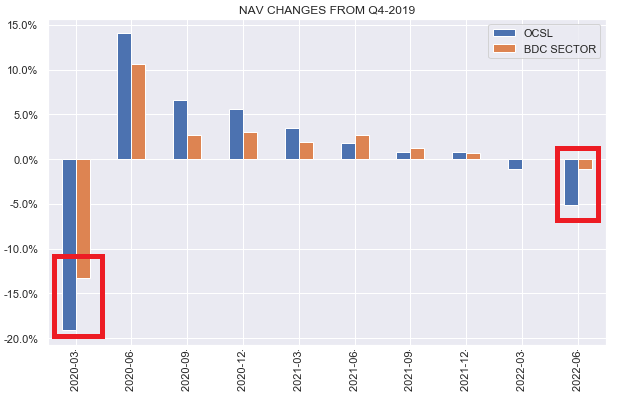
Non-accruals remained at zero and there were realized gains over the quarter. Leverage ticked up although that was mostly due to the drop in valuations as net investments were flat. Dividend was raised half a cent so the yield is now 9.6%. Dividend coverage is 100% however it should move higher as short-term rates continue to filter through. The company also raised its leverage target which will give it more capacity to grow assets.
OCSL valuation at 103% is a bit expensive relative to where it’s traded, however we should keep in mind that if we did an apples-to-apples NAV valuation it would probably only see a 2-3% drop in the NAV versus its actual 5% drop.
Systematic Income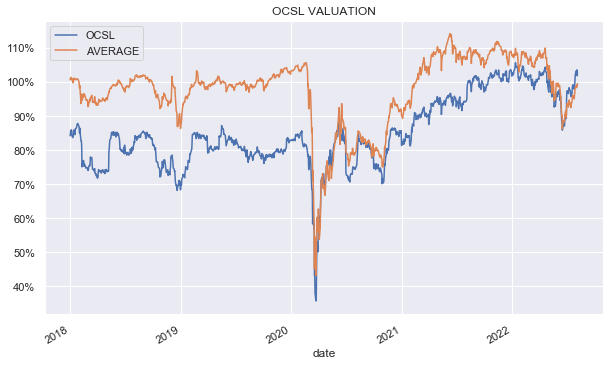
This means that its valuation is closer to 100% which is in the fair-value camp. The stock remains in the Core Income and High Income Portfolios. It has outperformed the BDC sector year-to-date by around 3% and is flat on the year.
Fidus Investment (FDUS) NAV fell half a percent while GAAP income increased (adjusted was flat). The company has mostly fixed-rate liabilities so its income beta to higher Libor is quite high. The company also continues to rotate to a higher first-lien allocation which has increased each quarter over the last few years. This rotation will be a tailwind to net income over the coming quarters.
Systematic Income
Non-accruals increased to 1% on fair-value from 0.3% (and from zero at the end of the year) and is worth watching. Leverage remains pretty low at 0.8x. FDUS is trading at a yield of 10.6% with a valuation of 101%. We have held the stock in our High Income Portfolio since last year – it is up 17% in total return terms in 2022.
Stance And Takeaways
The continued strength in the labor market means that, despite the market consensus, the Fed is very unlikely to quickly pivot to a more dovish stance. Our view remains that investors should have some allocations in their portfolios that can take advantage of short-term rates that could very well rise above what the market expects and stay there longer than the market expects. Historically resilient BDCs can perform this function very well in diversified income portfolios. After adding to our BDC holdings on the way lower, we have not chased the recent rally. In fact, we downgraded our OCSL holding from Buy to Hold on the back of its 14% bounce from the recent trough. The market is likely to remain volatile which may give income investors better entry points for additional BDC allocations this year.
Be the first to comment