

Darren415
This article was first released to Systematic Income subscribers and free trials on Aug. 13.
Welcome to another installment of our BDC Market Weekly Review, where we discuss market activity in the Business Development Company (“BDC”) sector from both the bottom-up – highlighting individual news and events – as well as the top-down – providing an overview of the broader market.
We also try to add some historical context as well as relevant themes that look to be driving the market or that investors ought to be mindful of. This update covers the period through the second week of August.
Be sure to check out our other Weeklies – covering the Closed-End Fund (“CEF”) as well as the preferreds/baby bond markets for perspectives across the broader income space. Also, have a look at our primer of the BDC sector, with a focus on how it compares to credit CEFs.
Market Action
It was a great week for the BDC sector with a 3% total return as all but two stocks rallied with the two laggers falling on the back of public offerings. The recovery in the income space accelerated this week on the back of benign inflation indicators as well as a bounce in consumer sentiment. Good earnings releases, dividend increases as well as a rise in short-term rates also supported the sector.
All of this leaves the BDC sector pretty flat for the year which is quite an extraordinary feat in the context of everything that’s happened. By contrast, high-yield corporate bond CEFs are down 13% and loan CEFs are down 9% year-to-date.
Systematic Income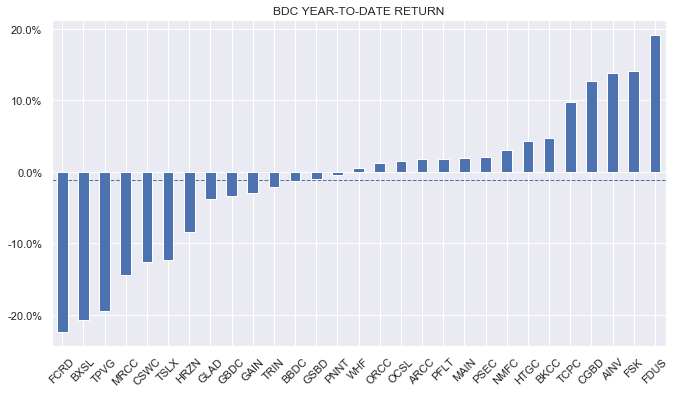
With most BDC earnings out, the average NAV drop in Q2 was a bit under 3%.
Systematic Income
Total NAV return, however, was only marginally in the red as dividends almost matched the drop in NAVs.
Systematic Income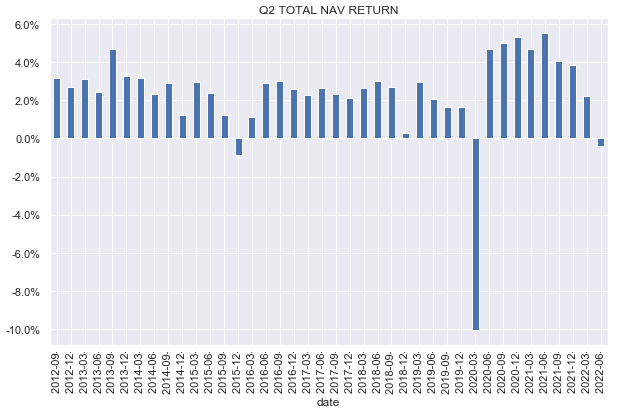
The average BDC valuation has risen to 103% which is in line with the historic median level (green line) and only marginally above the historic average (red line). Given the very likely downtrend in corporate earnings and a very significant ongoing squeeze in interest coverage in the sector this now feels on the slightly expensive side to us.
Systematic Income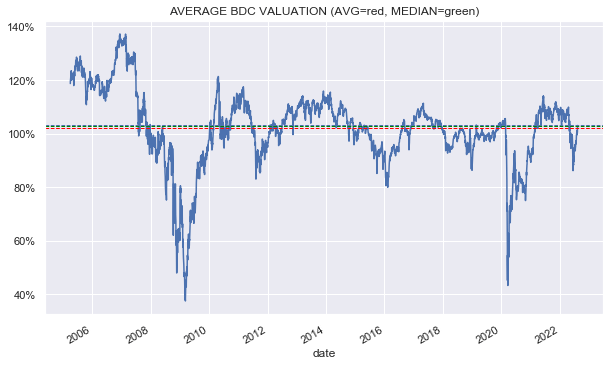
Market Themes
Relative to other income sectors, BDCs NAVs were highly resilient over Q2. The median BDC NAV drop in Q2 was just 2.1% with the average around 2.7% due mostly to a continuing value trap that is FCRD.
Systematic Income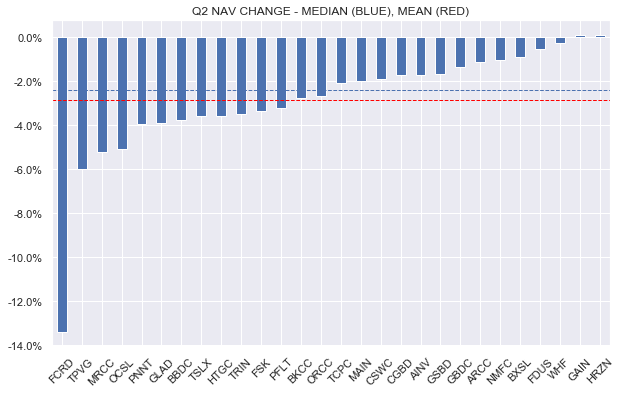
In the context of that performance, only Munis put up a stronger Q2 number.
Systematic Income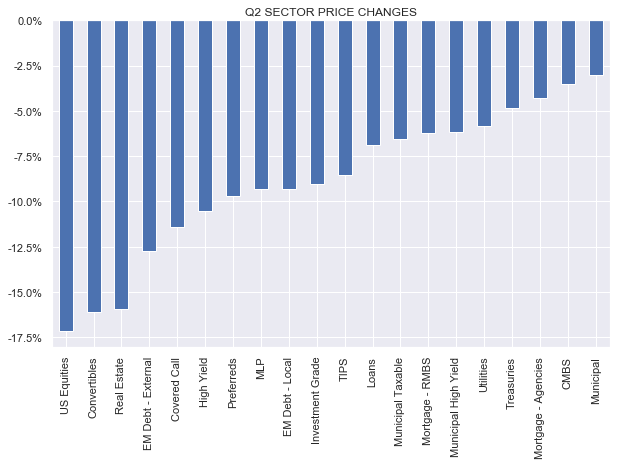
Given the fact that BDCs are highly-leveraged (significantly higher than even credit CEFs) and hold allocations to companies which themselves operate at an elevated level of leverage, what explains this resilient NAV performance over Q2?
The first-order explanation is pretty simple – BDC NAVs are not truly marked-to-market unlike the assets of all the other sectors in the chart above. BDC holdings are marked each quarter using market inputs and third-party valuation specialists and auditors. However, they are not susceptible to the same kind of liquidity considerations as other assets that are publicly traded. It is no coincidence that BDC prices tend to drop much more than NAVs during drawdowns. For instance, the average BDC price fell around 45% in Q2 of 2020 while the average NAV fell just 10%. In short, it’s fair to conclude that the market doesn’t really believe that in a sharp drawdown BDC NAVs are really and truly that resilient.
Overall, there is nothing inappropriate about this dynamic and, in fact, it gives BDCs a kind of super power, much like the one enjoyed by private equity. It allows BDCs to maintain a very high level of leverage while holding very illiquid assets. Loan CEFs tend to carry much less leverage, in large part, because of the increased risk of deleveraging. For instance, loan CEF NAVs fell on the order of 30% in Q2 of 2020 – a drop which pushed many funds to deleverage. Clearly, few people really believe that BDC assets are somehow more than 3x as resilient even as their yields tend to be above those offered by publicly traded loans.
There are a number of other second-order factors for Q2 NAV resilience. One is the fact that many BDCs perform NAV-accretive market actions such as public offerings / ATM issuance (if the stock is trading at a premium such as CSWC or MAIN) or stock buybacks (if the stock is trading at a discount such as CGBD). This can add up to 1-2% to the NAV per quarter. Secondly, BDCs can feature significant gains from their equity / warrant positions which is what distinguishes them from loan CEFs. Third, the recent path of rising rates has helped to boost net income above the ongoing dividend level which goes directly to the NAV (at least temporarily, as the BDC may often increase the base dividend and/or pay out a special/supplemental dividend). Fourth, BDCs can feature sizable unexpected fee income due to early repayments. Admittedly, this source of income has been relatively subdued in Q2.
Different BDCs have different profiles with respect to these additional drivers of returns but most BDCs feature at least some of these. This doesn’t mean that BDCs are impervious to sizable permanent losses but they can provide a tailwind to the NAV during periods of volatility.
Market Commentary
This week we highlight a subset of BDC earnings that we continue to report on at Systematic Income.
The Blackstone Secured Lending Fund (BXSL) reported good Q2 results. The NAV was down by 1% though most of that was due to the special dividend. Base dividend coverage is 117%, suggesting that the base dividend should start moving higher at some point.
Systematic Income BDC Tool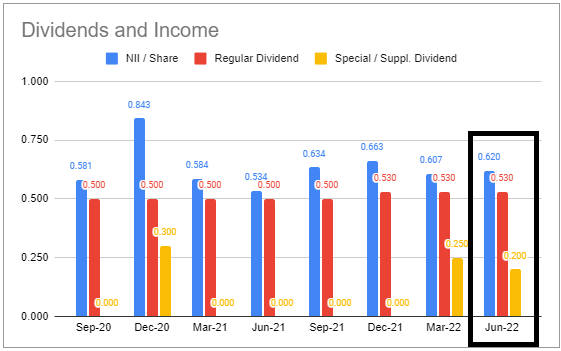
Leverage moved higher and is fairly high overall at 1.3x. Non-accruals remain at zero though PIK income increased. We bought BXSL in our Core Income and High Income Portfolio in the second week of July when it was trading around $23. At $25.20 it’s much less compelling although we expect its valuation of 97% to move closer to the sector average over time.
Golub Capital (GBDC) NAV fell 1.4% with the total NAV return in Q2 being +0.6% – about 1% better than the sector. Adjusted net income ticked higher to $0.31 from $0.3 versus a dividend of $0.30. Net new investments were positive and leverage moved higher. This, along with a high beta to rising short-term rates, should keep net income rising in the coming quarters. Non-accruals were flat as was the internal portfolio quality rating. GBDC has tended to be a low-octane BDC due to its high first-lien allocation and lower-yield asset profile, however it has outperformed the sector in the last two quarters.
Systematic Income BDC Tool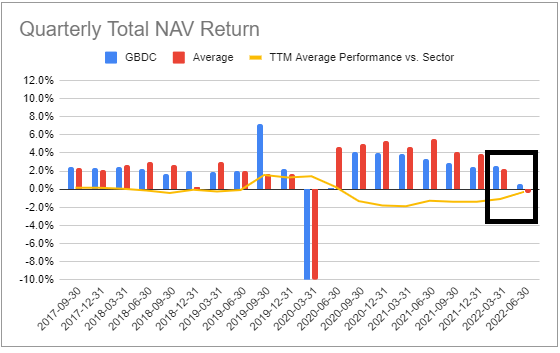
With a 94% valuation it looks fairly attractive versus the sector average of 103%, particularly given its lower fee structure. It’s a nice position to balance out some of the higher-equity BDCs such as FDUS or ARCC in BDC portfolios. GBDC remains in our Core Income and High Income Portfolios.
Stance & Takeaways
Our BDC sleeve in the High Income Portfolio generated a total return of a bit over 10%+ year-to-date, outperforming the broader sector as the following chart shows.
Systematic Income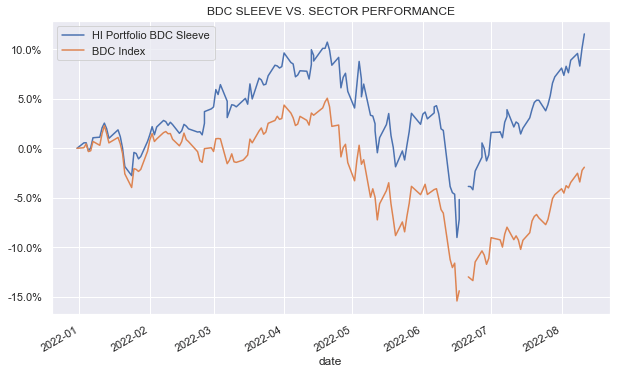
This performance is due to three main factors. First, our main overweights were in TCPC (since rotated into other BDCs), FDUS and CGBD all of which had double-digit total returns year-to-date. Two, we added to our BDC exposure during the dip, particularly in TRIN and BXSL, rotating from shorter-maturity assets like BDC and mREIT bonds that held in very well. And three, we made some timely rotations between BDCs as their valuations gyrated widely this year.
Because we were able to add to our BDC holdings through the drawdown the bar to additional buys is fairly high at the moment, particularly at current levels which are well above our entry levels. That said, for investors who find they are still underweight BDCs, we continue to like both BXSL and GBDC here due to their below-average valuation and a higher-quality allocation profile.
Be the first to comment