


Laurence Dutton
The Aberdeen Standard Bloomberg All Commodity Strategy K-1 Free ETF (NYSEARCA:BCI) captures the price performance of the most important futures contracts across energy, agriculture, metals, and even livestock. This is a segment that has benefited from a heightened profile over the past year amid supply chain disruptions and global inflationary trends supporting positive momentum. Indeed, BCI has returned over 25% in 2022 which is in contrast to the selloff in equities and bonds amid the broader market volatility.
We like BCI as a good option for exposure to this important alternative asset class that can work as a portfolio diversifier and long-term core holding. The fund’s “K-1 Free” structure means investors don’t need to worry about the tax implications of investing directly in futures contracts as BCI reports income and distributions on a standard Form 1099, just like any other stock and ETF. We are bullish on commodities and expect more upside from BCI this year.
What is the BCI ETF?
BCI passively tracks the “The Bloomberg Commodity Index” which consists of 23 commodities that are weighted by trading volume and world production levels with criteria of global significance. The portfolio of futures contracts is collateralized with short-term U.S. Treasuries that generate some interest income that helps to balance some of the underlying costs as well as support the overall portfolio management process.
Taking a look at the current holdings in the BCI portfolio, gold futures are technically the largest position at 14% of the fund, followed by natural gas futures at 11% and crude oil at 9%. The sector weights are more relevant with “energy” representing 36%, followed by agriculture at 27%, and precious metals at 18%.
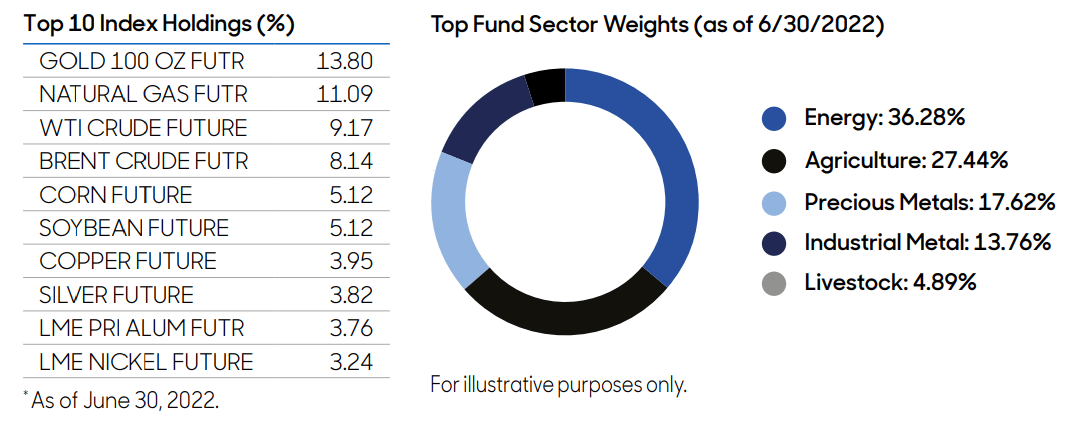
source: Aberdeen
It’s also worth mentioning that BCI distributes an annual dividend based on the underlying realized gains and ordinary income. For 2021, the per-share amount of $4.46 was paid out in late December corresponding to a yield of 16% while the net asset value was reduced by the same amount. This was an exceptional circumstance based on the timing of market conditions. Keep in mind that the annual payout is variable depending on the underlying portfolio performance each year so it’s unclear what the 2022 forward yield will be, but the vehicle works as a compelling income instrument as a component of the total return.
BCI Performance
Commodity price performance particularly with energy, agriculture, and industrial metals have a cyclical component. This means that global macro trends between production and supply levels against demand trends are the primary drivers of price action. On the other hand, it’s also clear that each commodity type is exposed to very different factors, specific to their markets.
This year energy and agriculture have outperformed amid the recovery of global economic activity following the pandemic while the Russia-Ukraine war added an incremental layer of disruption to global trade, further adding to higher prices.
The chart below places BCI’s 25% total return year-to-date in the context of the trends from individual commodity price tracking exchange-traded funds that we use here for reference purposes. The United States Natural Gas ETF (UNG) stands out with a 157% return, followed by a 40% gain from the United States Oil Fund (USO), and a 24% return by the Teucrium Corn ETF (CORN). On the other hand, iShares Silver Trust (SLV) has been a laggard, down by 19% in 2022. In other words, BCI is a mix of all these underlying markets, capturing the major themes in commodities as an asset class.
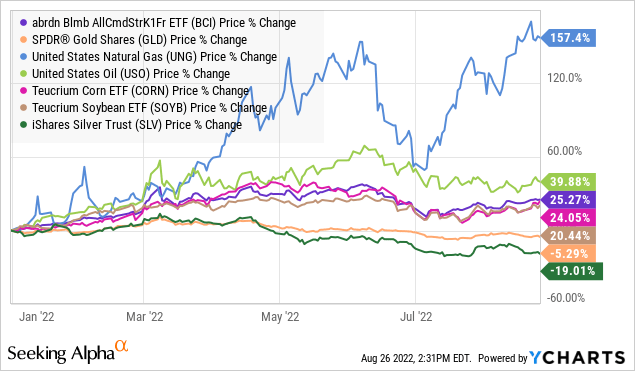
Naturally, if we had some certainty that natural gas will continue to be the big winner going forward or silver will heroically reverse higher, a tactical position in one of those funds could make sense. The attraction in BCI comes down to the inherent uncertainty of investing, using a strategy based on diversification. Whether crude oil or grains lead higher from here, BCI will be balanced into the high-level themes.
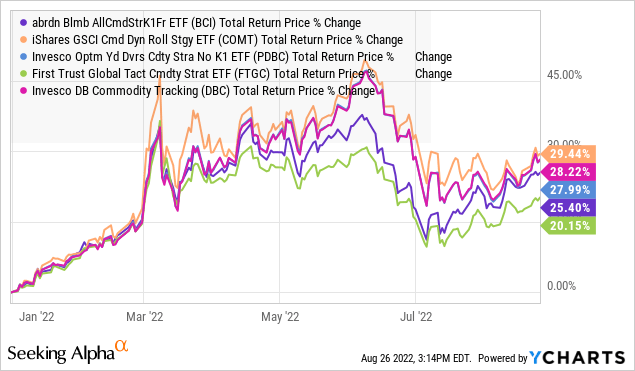
It’s worth considering alternative ETFs in this category which each follow a slightly different strategy, but are nevertheless intended to track “commodities”. On this point, a key distinction in other names like the Invesco DB Commodity Tracking ETF (DBC) and the iShares GSCI Commodity Dynamic Roll Strategy ETF (COMT) is that both have a larger tilt towards energy sector futures contracts, currently representing 63% of their fund holdings.
By this measure, DBC and COMT have both outperformed BCI in 2022 with a 28% and 29% return given their exposure to the momentum in oil and natural gas. There is also the First Trust Global Tactical Commodity Strategy Fund (FTGC) which is actively managed but has diverged from the group with a weaker performance this year, returning only 20%.
While we won’t claim one fund is “better” or worse than another, BCI stands out with its category low expense ratio at just 0.25% compared to 0.48% for COMT, 0.85% from DBC, and 0.95% with FTGC. We also see its higher relative positioning in agriculture as a strong point over the long run.
Analysis and Forward-Looking Commentary
The setup in commodities has been a recent correction lower from their highs earlier in the year. BCI is currently off around 10% from its peak in early June. Several factors have contributed to this pullback including a strong Dollar along with softer economic indicators out of China, the world’s largest commodity consumer.
Going back to the initial headlines of the Russia-Ukraine invasion, WTI and Brent crude oil briefly traded above $130 per barrel before trending lower to a current level near $90.00. Similarly, agricultural markets saw near record prices amid concerns that exports from the region would be blocked, leading to tight supplies globally. Fast forward, even as the geopolitical situation remains tense, easing supply chain disruptions have helped to ease price pressures.
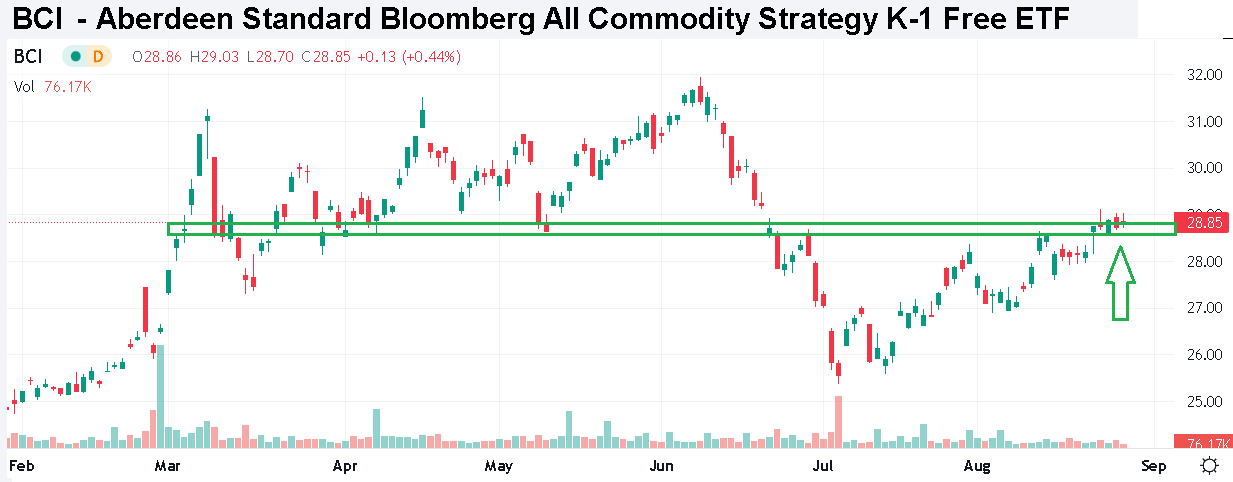
That being said, we view this latest dip as a new buying opportunity ahead of another leg higher. We can point to corn and wheat futures, along with oil, as examples where the prices appear to have formed a bottom, with the selloff likely going too far. A scenario where global economic conditions and underlying demand trends remain resilient can support a rebound in all commodities from here.
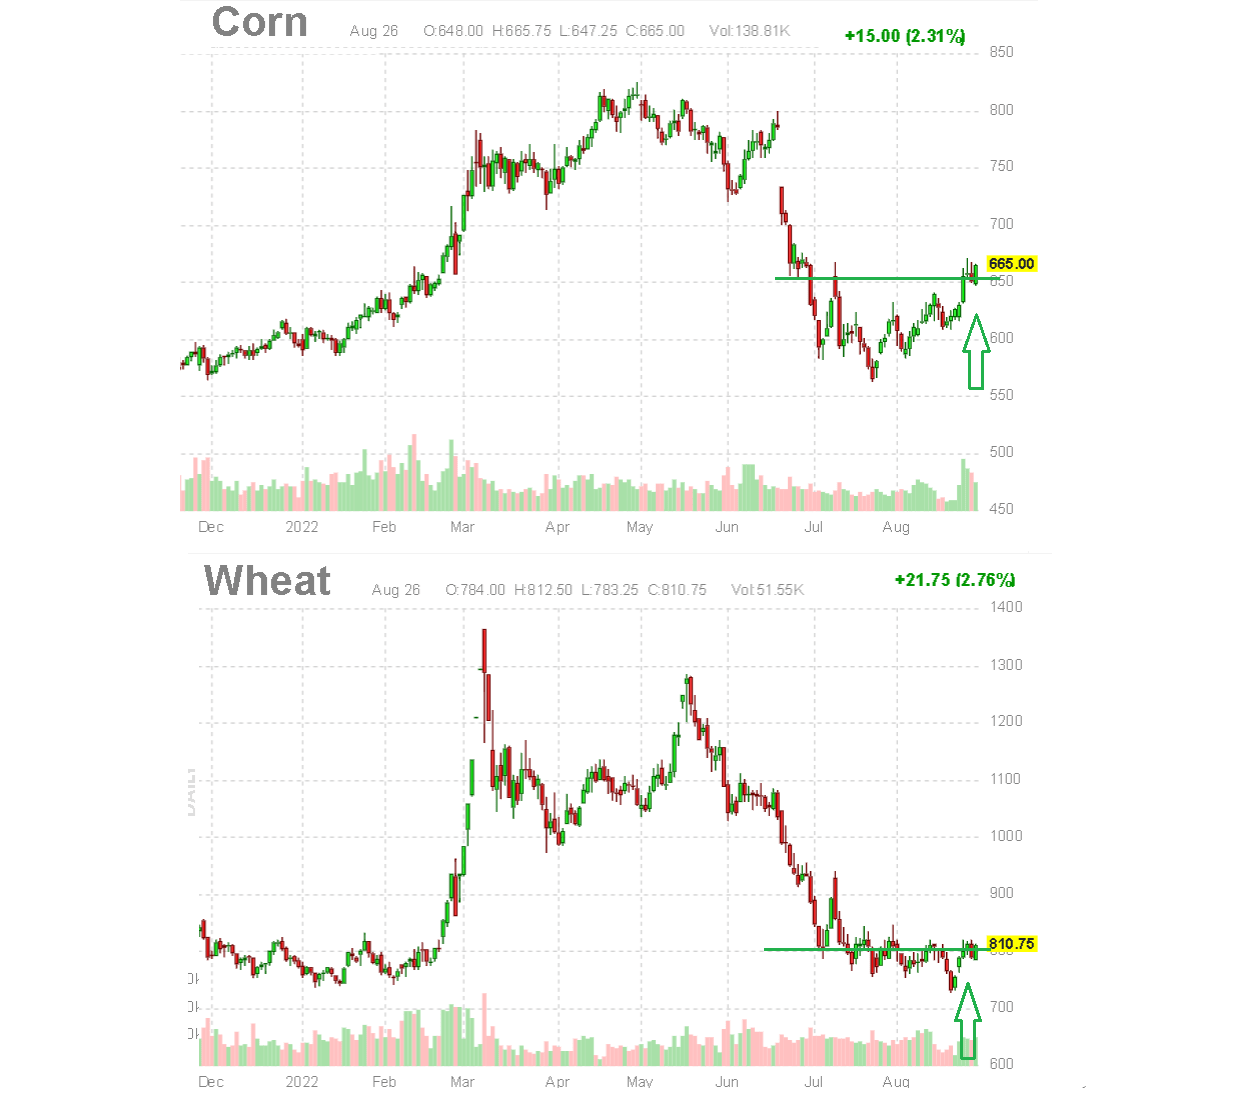
source: finviz.com
The BCI ETF is well-positioned to capture these trends and resume its climb higher. Longer-term, the dynamics of an increasing global population against limited natural resources and continuous expansion of the global money supply of fiat currencies should support positive returns in commodities over many years.
Seeking Alpha
Final Thoughts
The BCI ETF is a high-quality and low-cost fund that performs exactly as intended for exposure to commodity price performance. The fund can work in the context of a broader portfolio that includes stocks and bonds to add diversification into an alternative asset class.
In terms of risks, the most bearish scenario for commodities and the BCI ETF would be a deteriorating economic environment defined by collapsing consumer spending and sharply lower global trade levels. A bullish call here on BCI is based on a more optimistic view of the macro outlook to keep pricing pressures elevated supporting positive returns across agriculture, energy, and industrial metals.
Be the first to comment