

chonticha wat
Barrick Gold Corporation (NYSE:GOLD) has seen its relative performance stabilize in recent years since the appointment of a new CEO. Barrick has significant operating leverage to gold prices, with the company producing over 5 million oz of gold per year and capable of generating over $20 billion in FCF at $2,000 / oz gold price. For me personally, I prefer the superior business model of royalty companies like Wheaton Precious Metals Corp (WPM) that is relatively more immune to cost pressures that are impacting the gold miners.
Brief Company Overview
Barrick Gold Corporation is one of the largest gold mining companies in the world with annual gold and gold equivalent production of over 5 million oz.
Barrick was founded by the legendary Peter Munk in the 1980s and throughout the 2000s, the company was considered the largest gold miner in the world. However, the largest gold miner title was snatched away by Newmont Corporation (NEM) in 2019 when it bought Goldcorp.
Underperformed For A Decade
Long-time followers of the company will remember that for many years, Barrick was considered a clumsy dinosaur, perpetually mismanaging its industry leadership position. For example, it bought Equinox Minerals in 2011, at the peak of the last copper cycle, to diversify into copper production.
Poor management caused Barrick to underperform its peers, as measured by the VanEck Vectors Gold Miners ETF (GDX), by almost 25% in total return over the decade to the end of 2018 (Figure 1).
Figure 1 – GOLD has underperformed peers for a decade (Seeking Alpha)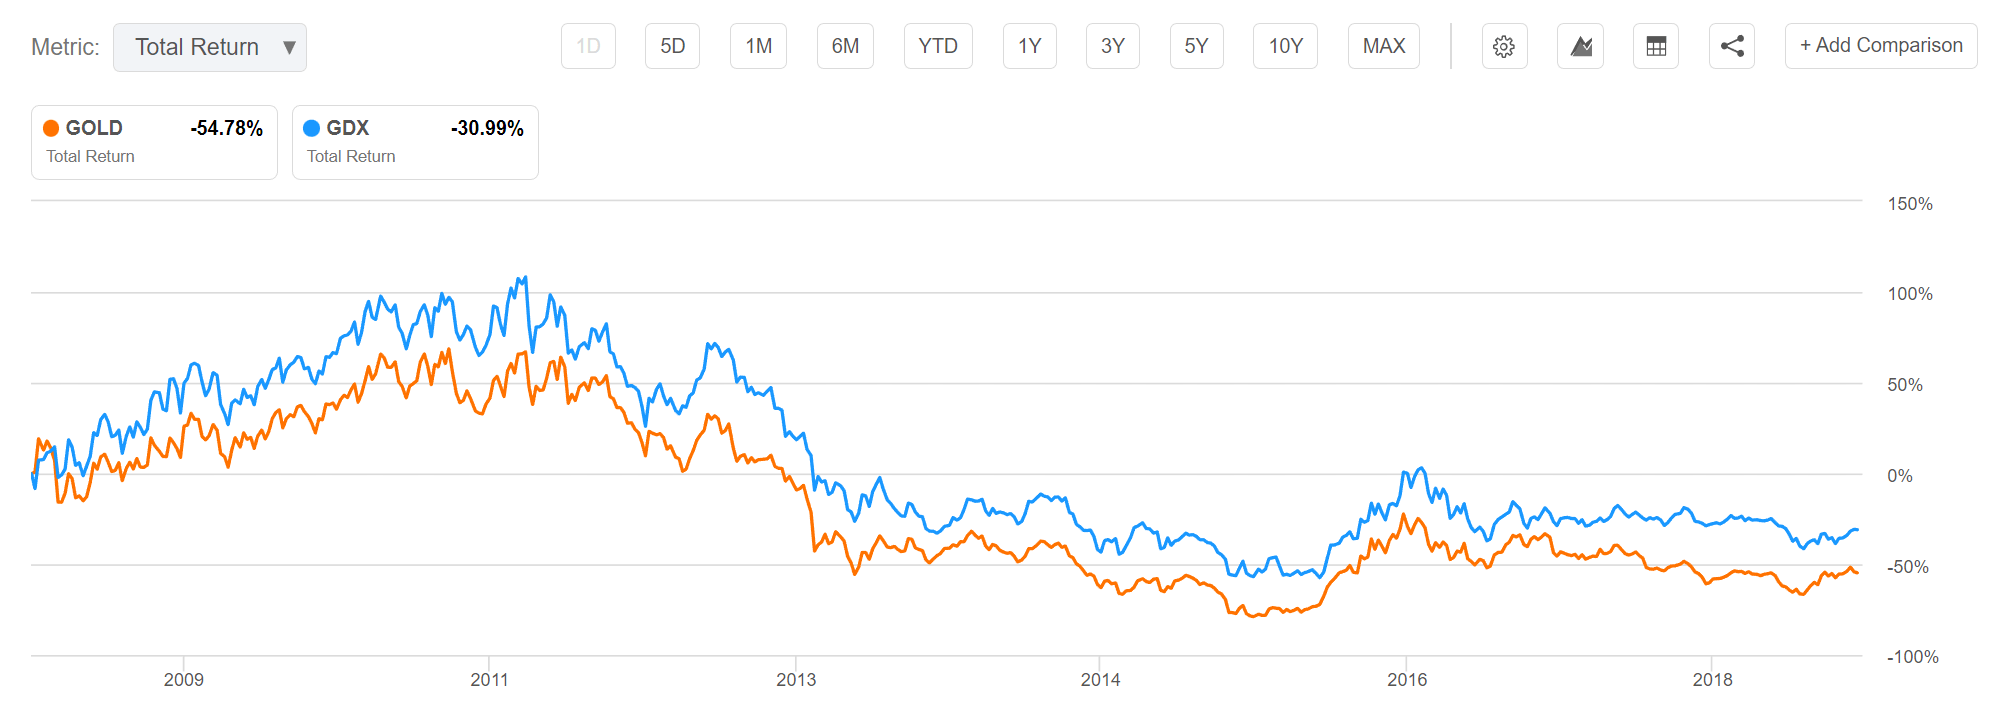
New CEO Working To Regain Investor Trust
In 2018, when Barrick acquired Randgold Resources, it also acquired a new CEO, Mark Bristow. Mr. Bristow is widely regarded as one of the best executives in the gold mining industry, having led Randgold from a small minnow in the early 2000s to a $6.5 billion sale to Barrick.
Since Mr. Bristow assumed the CEO role, he has worked hard to improve shareholder returns and regain investor support for Barrick. In the past 3 and a half years, Barrick has produced ~17 million oz of gold and generated $7 billion in free cash flows (helped by a buoyant gold price). Shareholders have received $2.5 billion in dividends and buybacks (Figure 2).
Figure 2 – GOLD shareholder returns (GOLD investor presentation)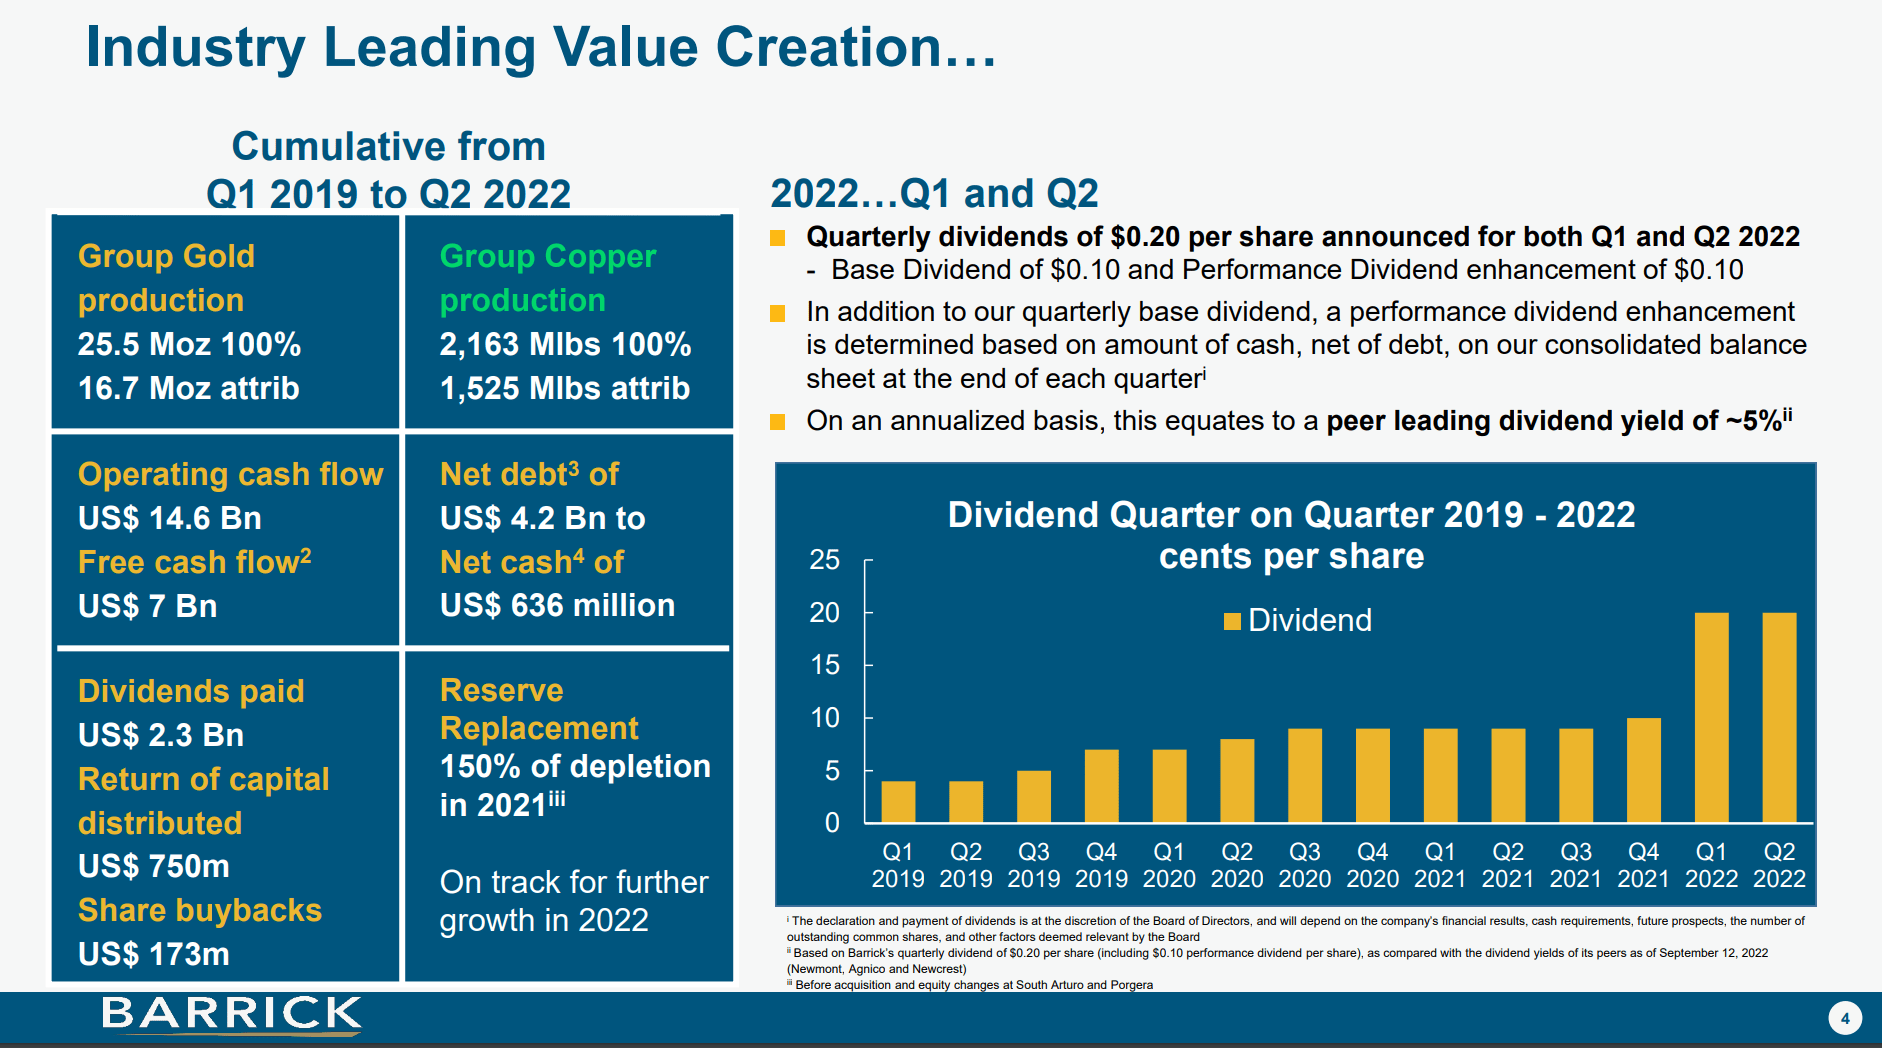
Mr. Bristow’s leadership seems to have stabilized Barrick’s relative performance. Measured from January 1, 2019, Barrick’s stock price has actually outperformed the GDX by 10%.
Figure 3 – GOLD has outperformed peers since Mr. Bristow’s appointment (Seeking Alpha)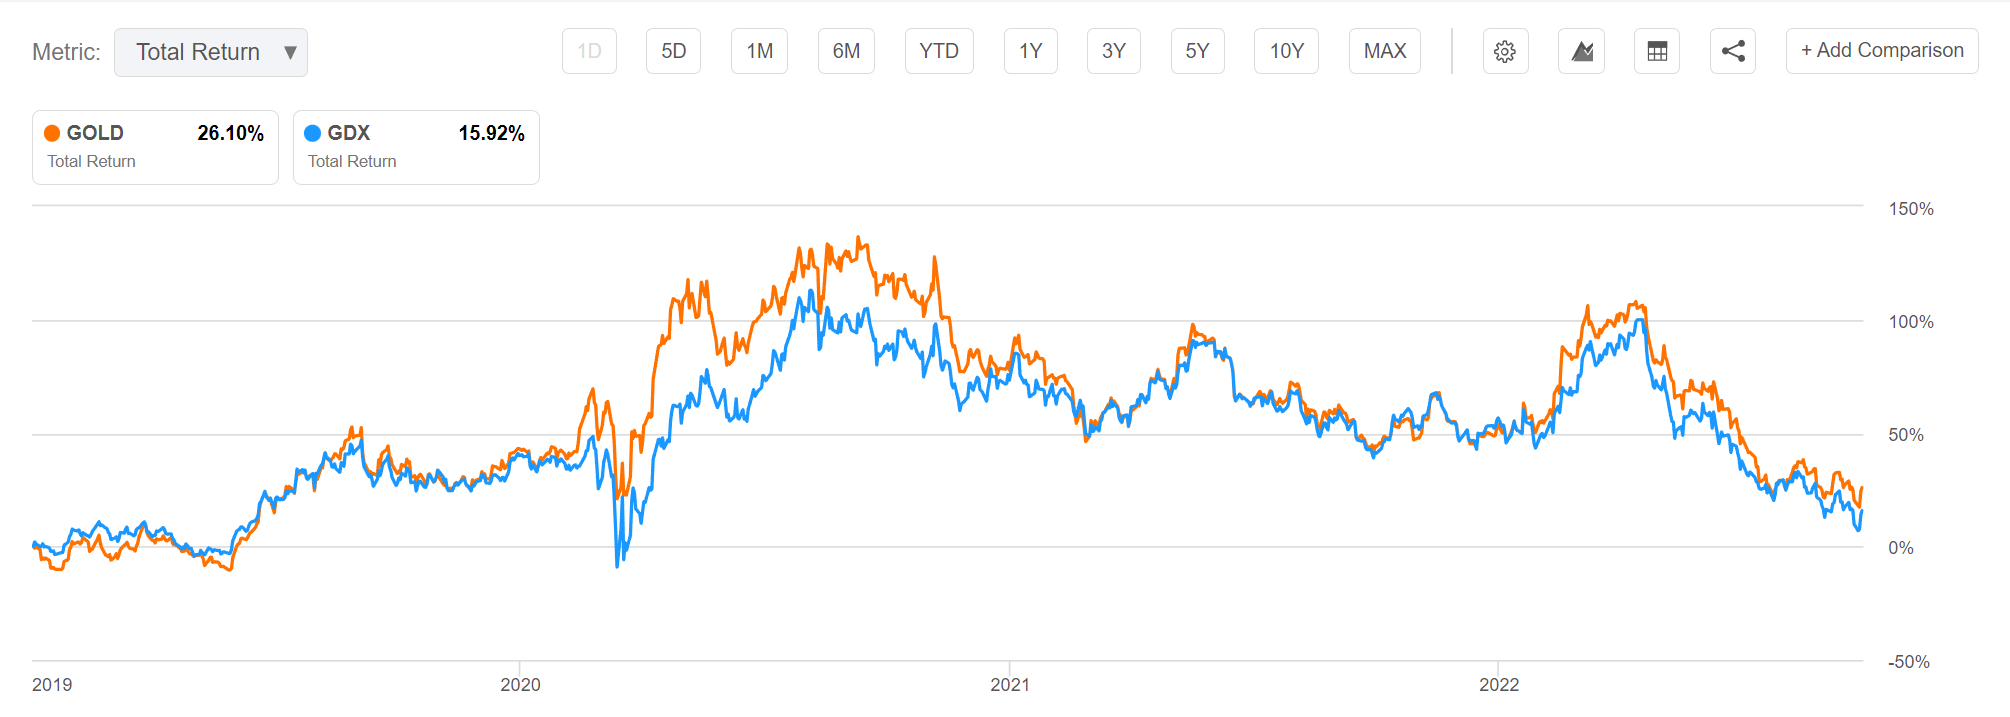
Large Production Supports Free Cash Flow Generation
With ownership of 6 tier-1 gold mines (>500k oz / yr, >10 yr mine life, lower 2 quartile costs), Barrick looks well positioned to sustain current gold production levels of ~5 million oz / year over the next decade (Figure 4).
Figure 4 – GOLD production profile (GOLD investor presentation)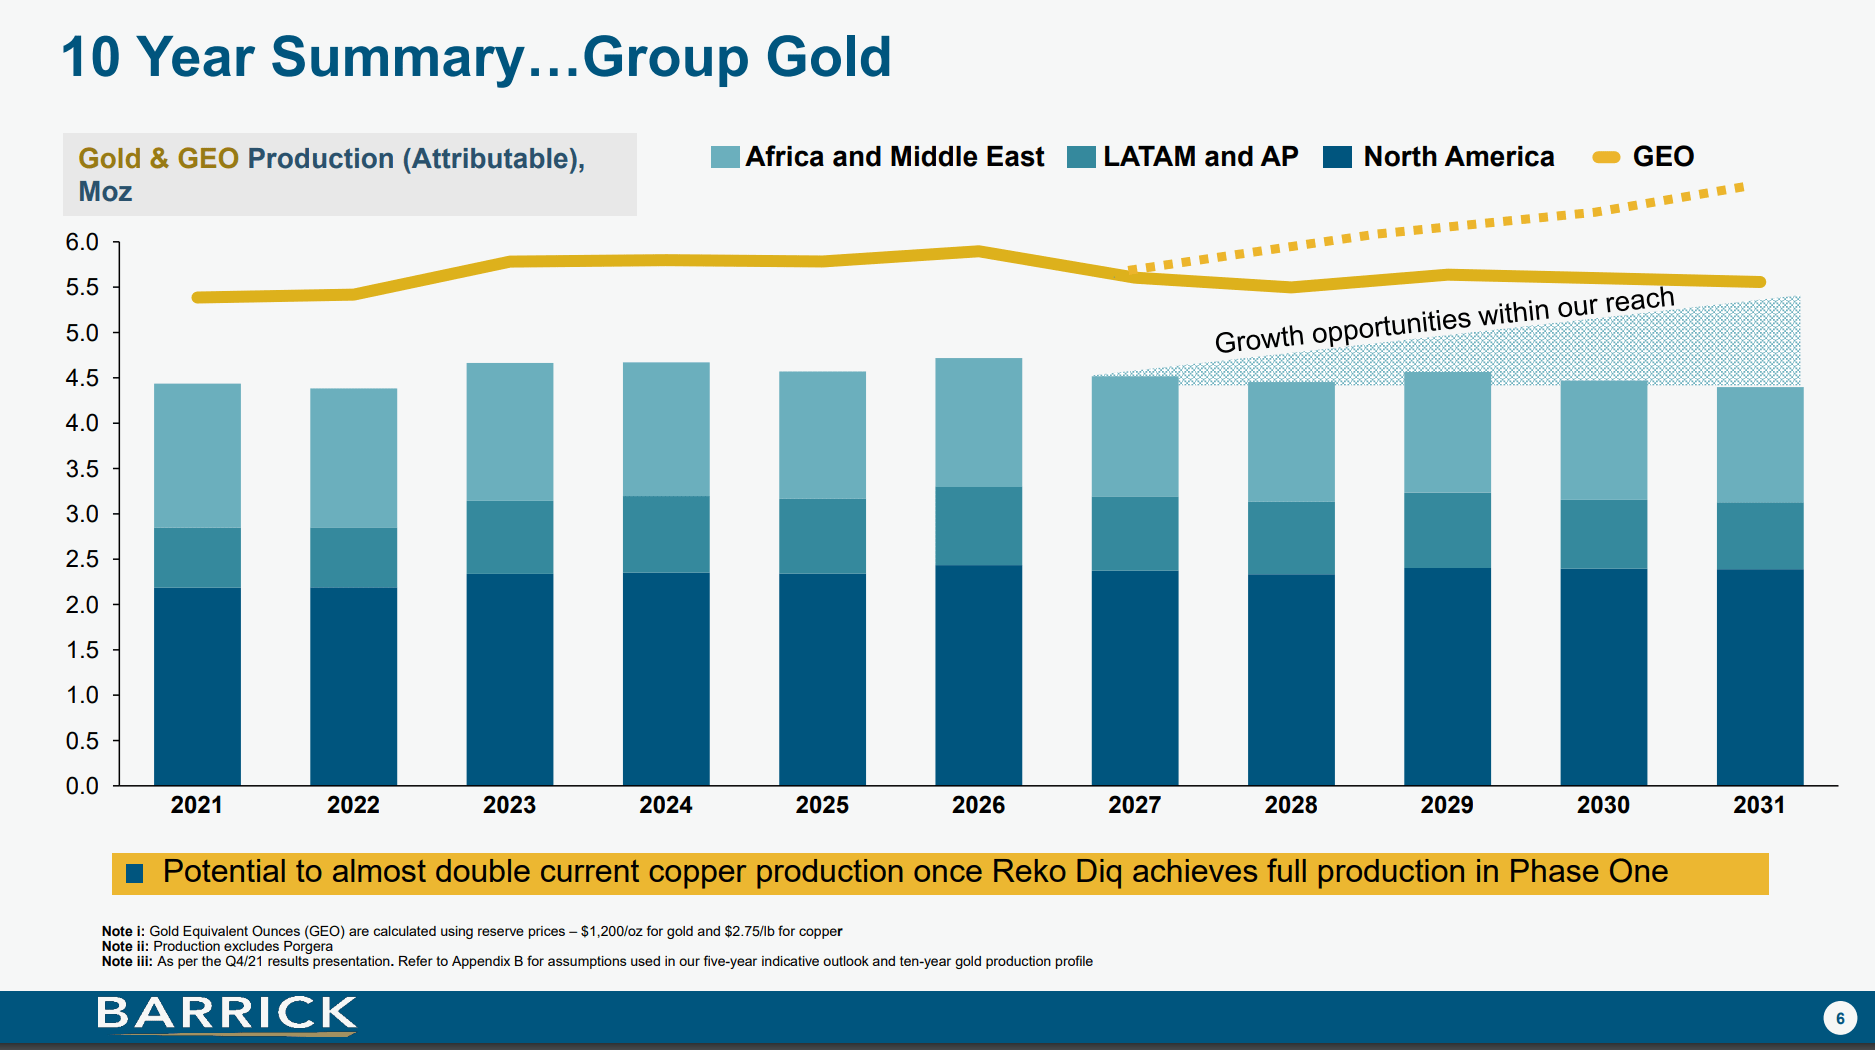
This large production base gives Barrick a lot of operating leverage to higher gold prices. According to the company’s analysis, at $2,000 / oz gold and $5.00 / lb copper, Barrick can generate upwards of $20 billion in free cash flow (“FCF”) over the next 5 years, essentially 75% of its current market cap (Figure 5).
Figure 5 – GOLD FCF sensitivity to gold prices (GOLD investor presentation)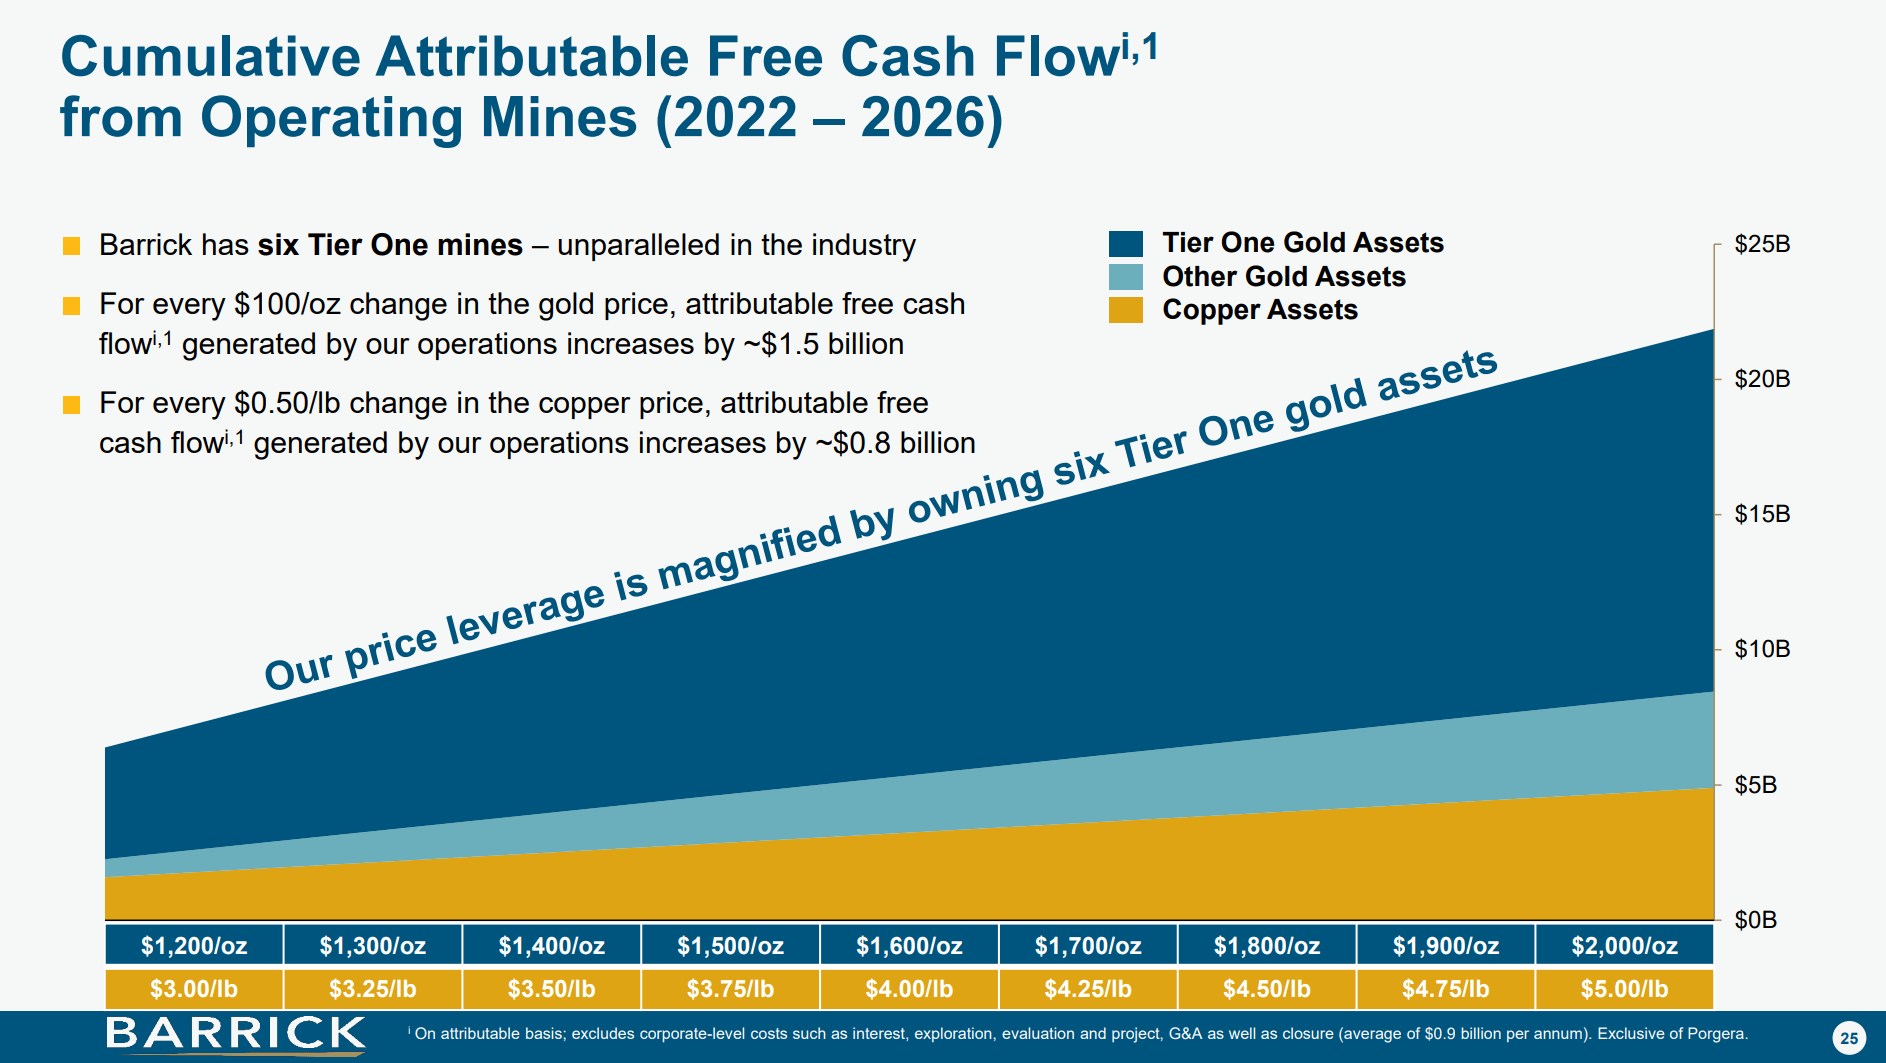
Rising Costs A Headwind
However, the main concern regarding Barrick, and gold miners in general, is rapidly rising costs. From the company’s Q2 report, we can see that the cash cost of production has risen 18.4% YoY to $855 / oz due to the impact of higher energy prices (Figure 6).
Figure 6 – GOLD suffering from rising input costs (GOLD investor presentation)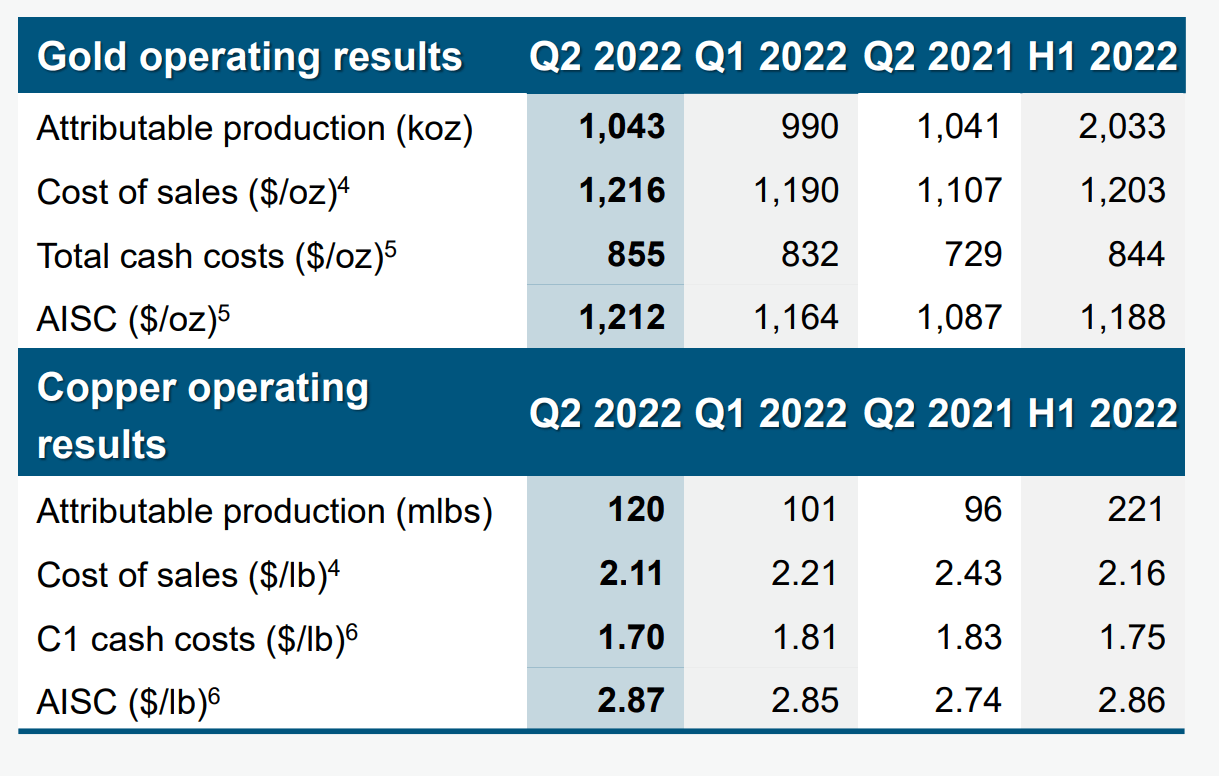
Although Barrick expects some cost relief in H2/2022, the fact that cash costs have increased so dramatically in a short period of time is a cause for concern. In Figure 7, we can see that the cash cost to extract an ounce of gold has increased dramatically by 45% compared to 2018’s levels, while the all-in-sustaining-cost (“AISC”) have increased by 50%
Figure 7 – GOLD cash costs and AISC are soaring (Author created from company reports)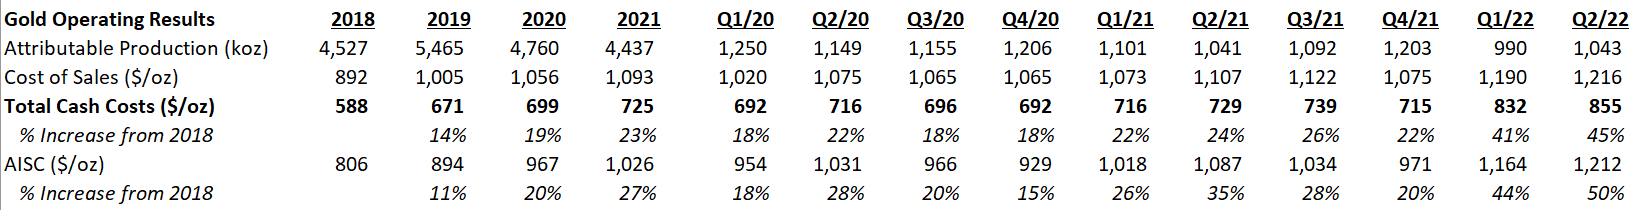
I Prefer The Royalty Business Model
The financial risk from cost inflation is one of the primary reasons I prefer the royalty business model of Wheaton Precious Metals Corp. and Franco-Nevada Corporation (FNV).
The following paragraphs are excerpted from my recent article on WPM.
With rising inflation hitting everything from fuel to labor, the royalty and streaming business model really shines through.
Since inception, WPM has consistently ‘produced’ gold and silver at first quartile cash costs. For 2022 to 2026, WPM has estimated contractual costs of ~$440 per ounce of gold while gold miners like Barrick, one of the largest gold miners in the world, are seeing cash costs rise by over 10% in 2022 alone (GOLD had 2021 cash costs of $725 / oz, but is expecting over $800 / oz cash costs in 2022) due to the “impact of higher energy prices.
Figure 8 shows WPM’s cash costs, which shows the company’s relative immunity from the cost inflation pressures impacting gold miners.
Figure 8 – WPM relatively immune from cost inflation (WPM investor presentation)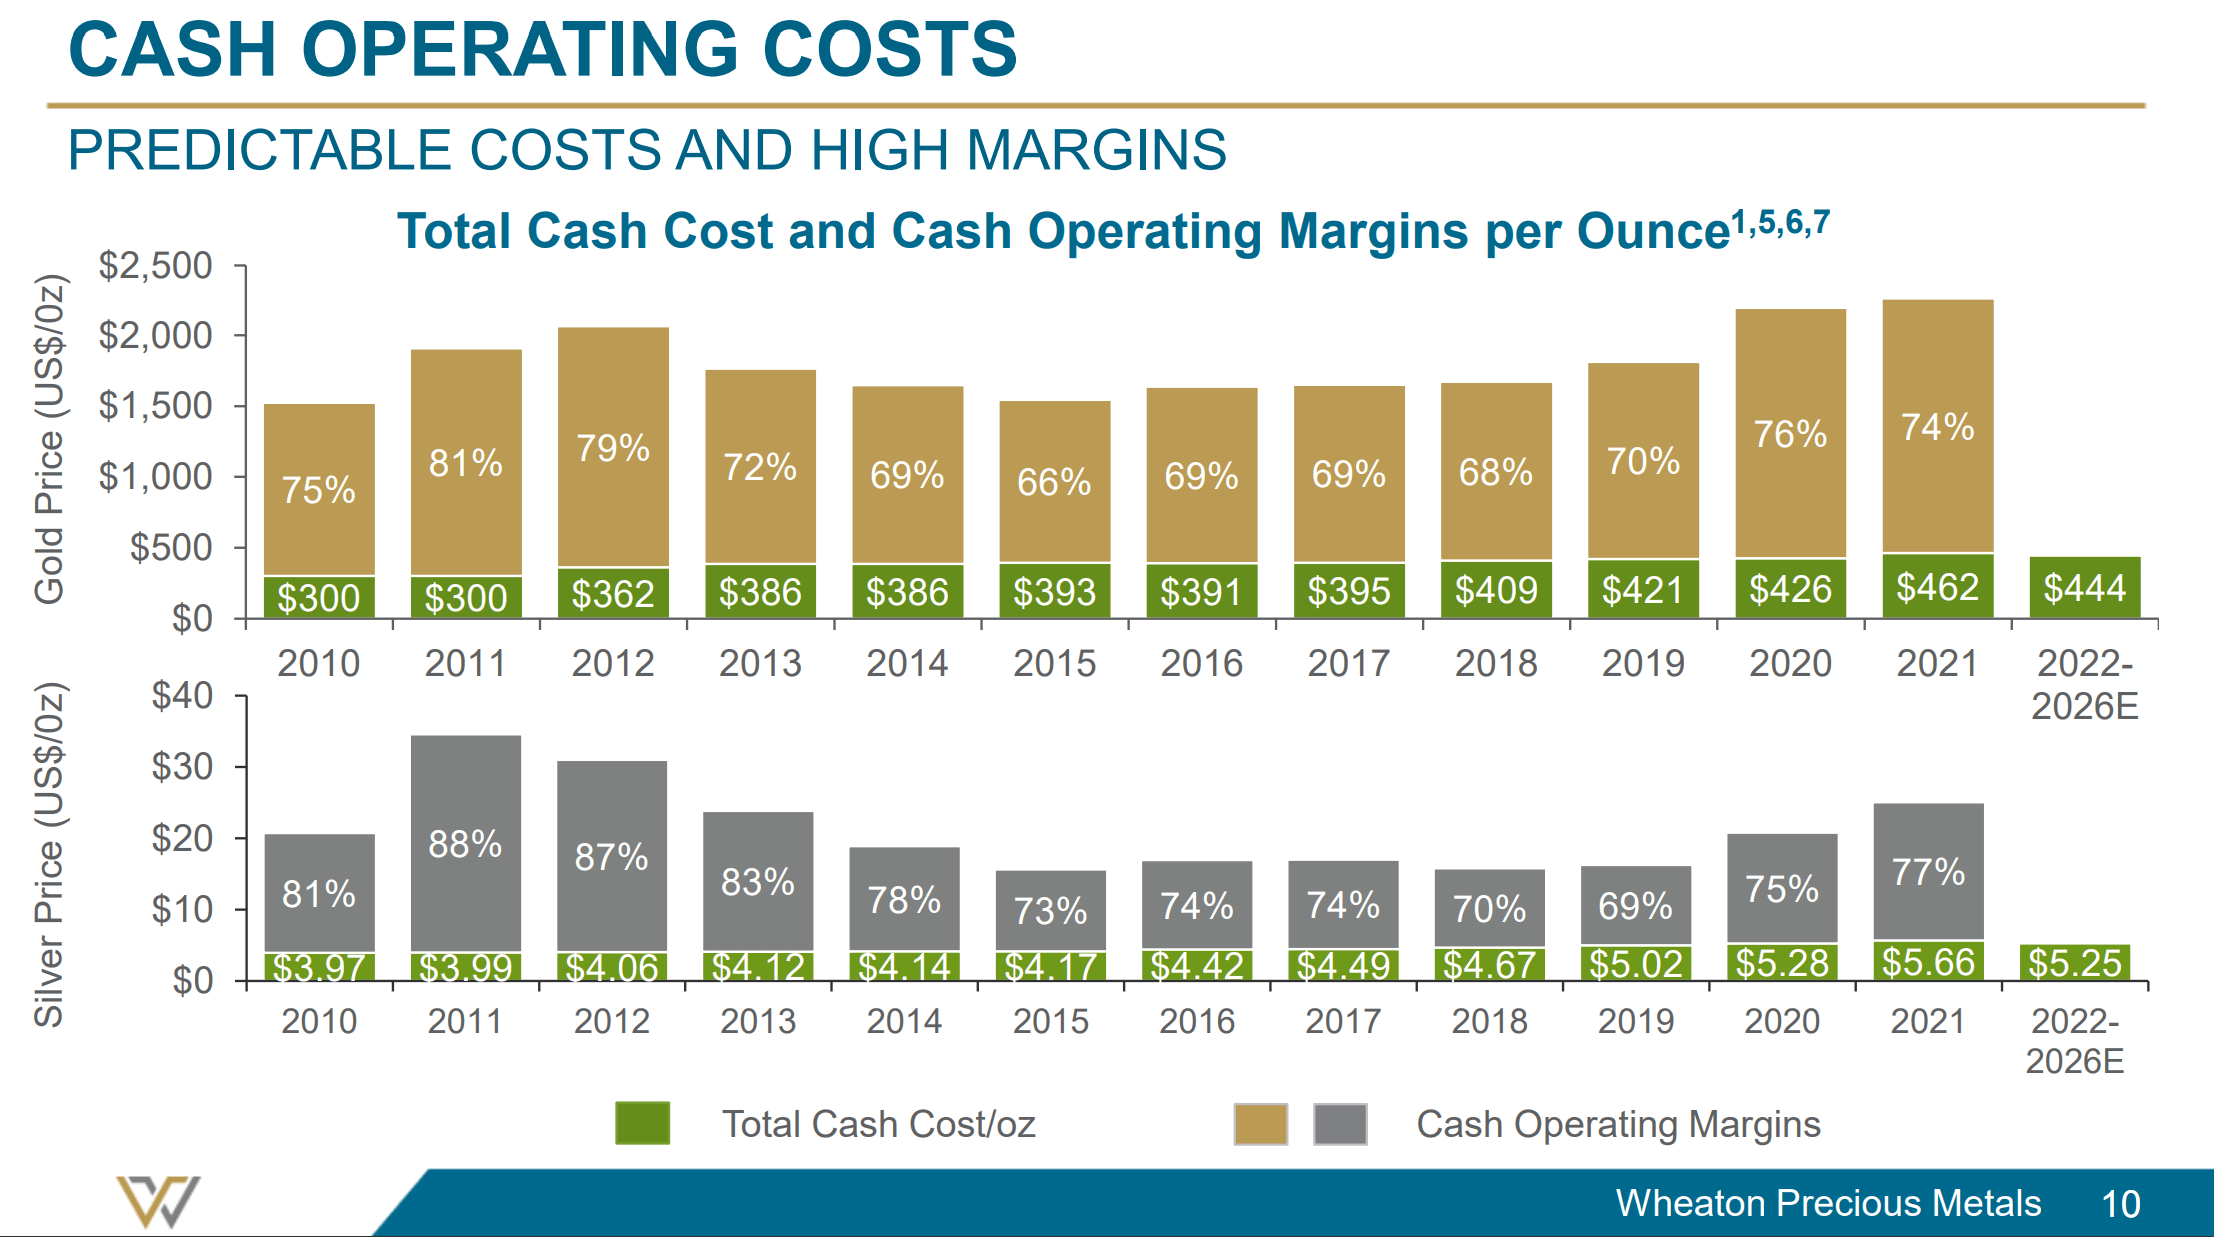
The difference in margin explains why over the long-term, Barrick has significantly underperformed Wheaton Precious Metals, despite the appointment of Mr. Bristow (Figure 9).
Figure 9 – GOLD underperformed WPM significantly (Author created with price chart from stockcharts.com)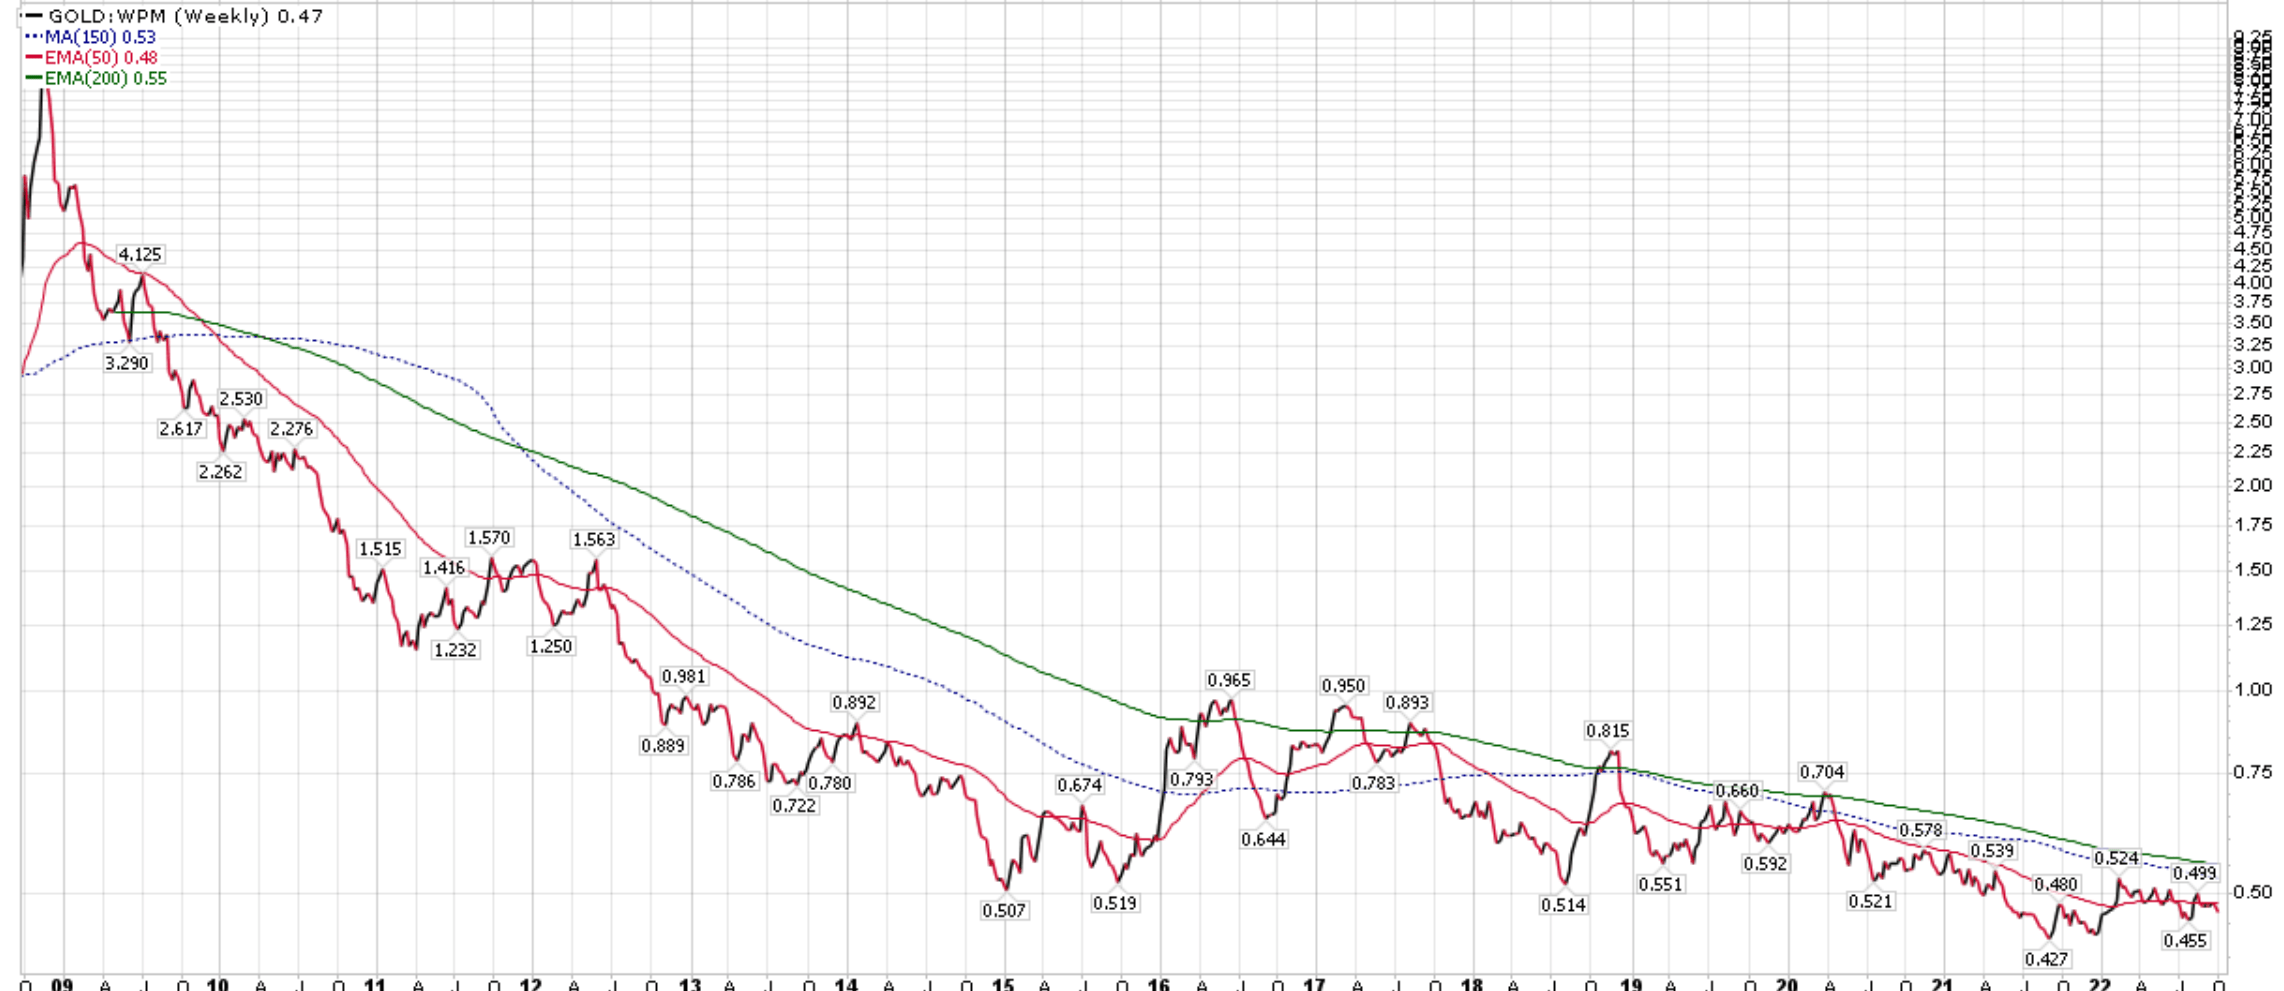
Barrick Trades At A Valuation Discount To Peers
In terms of valuation, Barrick trades at 15.6x Forward P/E multiple, a significant premium to the materials sector, which is currently trading at 10.0x Forward P/E. However, relative to other large cap gold producers such as Newmont and Agnico Eagle Mines Limited (AEM), it is trading at a discount.
Figure 10 – GOLD valuation to peers (Seeking Alpha)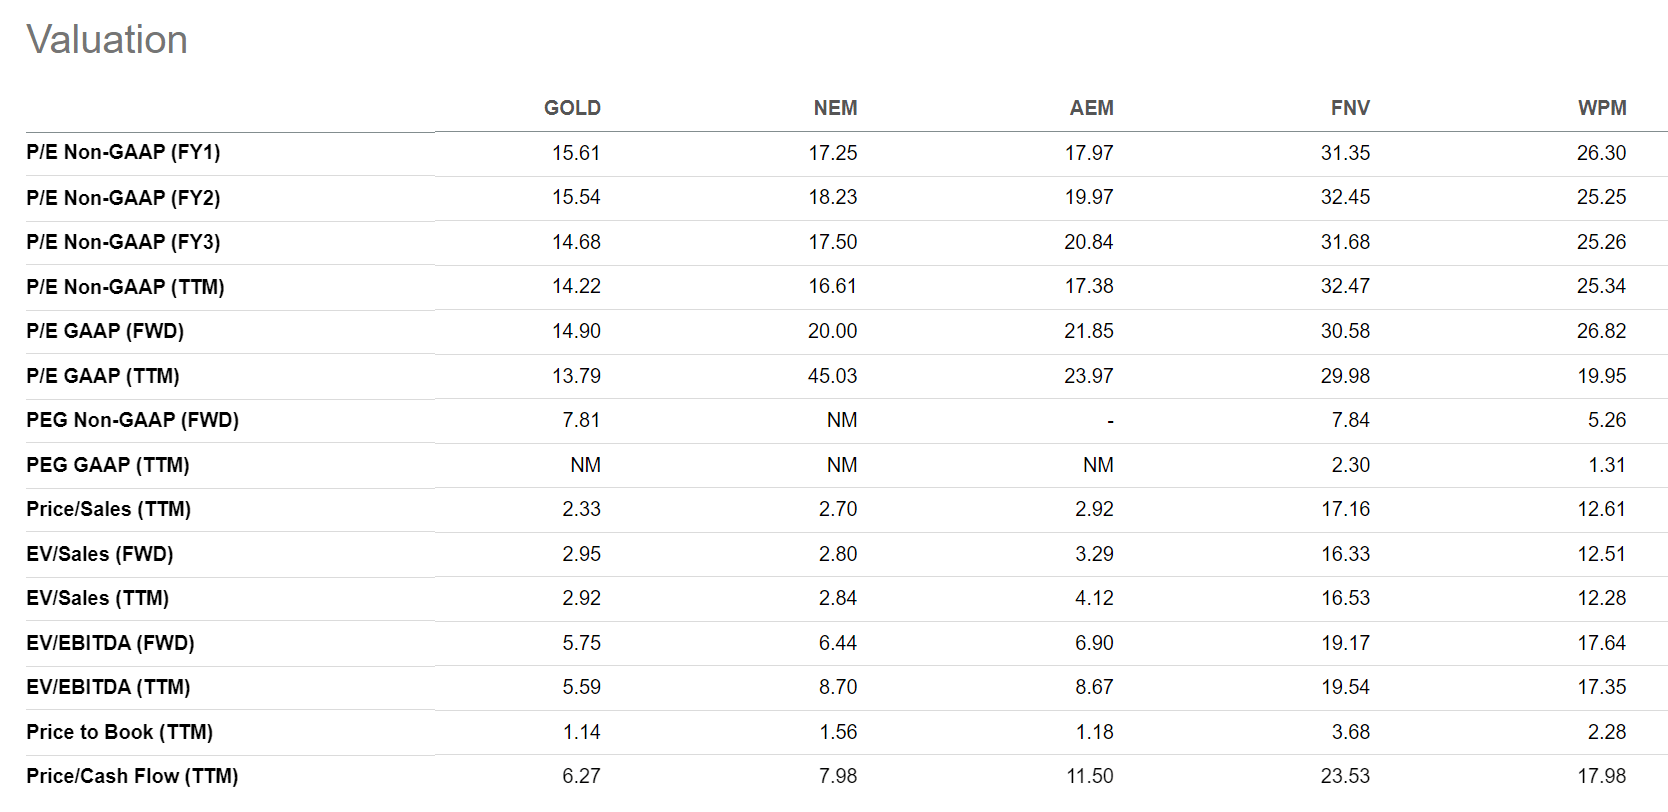
Risk
Due to Barrick’s large production base, it has significant leverage to gold prices. As shown in Figure 5, Barrick can generate over $20 billion in FCF at $2,000 / oz gold and $5.00 / lb copper. However, leverage works both ways, and Barrick’s financials could be susceptible on the downside to lower commodity prices as well. YTD, we have seen Barrick’s AISC margins halved, or decrease by roughly $400 / oz, from a ~$200 decrease in gold price and a ~$200 increase in costs. This has caused Barrick’s stock price to fall 14% YTD.
Currently, gold prices are suffering, down ~7% YTD, due to a strong US dollar and rising real interest rates. This decline in gold prices come despite soaring inflation. The old adage that gold is a good inflation hedge has not worked, at least in 2022.
Investors looking to time their entry into Barrick and other gold miners should look to the Federal Reserve for a signal. I believe gold and gold miners will outperform when the Federal Reserve is finished with their rate increases.
Conclusion
In summary, Barrick, with Mr. Bristow as CEO, has seen its relative performance stabilize. It has significant operating leverage to gold prices, with the company producing over 5 million oz of gold per year and capable of generating over $20 billion in FCF at $2,000 / oz gold price. For me personally, I prefer the arguably superior business model of royalty companies like WPM that is relatively immune to cost pressures that are currently impacting the gold miners.
Be the first to comment