Toronto-based Barrick Gold Corporation (NYSE:GOLD) reported preliminary Q2 sales on July 14, 2022, and is scheduled to report its 2Q22 earnings results next week (August 8 before market open).
Note: This article is an update of my article published on June 29, 2022. I have followed GOLD on Seeking Alpha since April 2015.
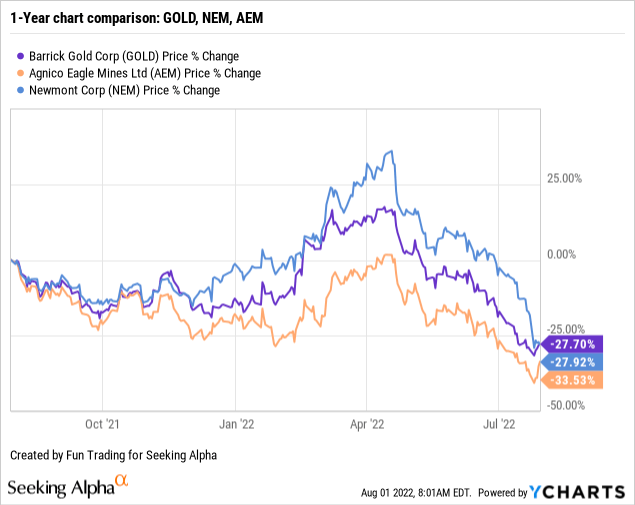
1 – Stock Performance
Barrick Gold is one of the three gold miners that I regard as my core long-term “gold miners,” together with Newmont (NEM) and Agnico Eagle (AEM).
We can see that Barrick and its peers have done poorly since June and are down about 30% on a one-year basis.
Barrick Gold is one of this segment’s best gold and copper miners. In short, my primary recommendation is to keep a long-term GOLD position and trade LIFO 40% to take advantage of the unavoidable periods of gold weaknesses we are experiencing now.
I must admit that the present weakness in the gold price is mind-boggling. Gold should be soaring with record inflation, but instead, it has been tumbling from $1,900+ per ounce to below $1,700 per ounce and now around $1,770 per ounce.
We can see that the gold price held quite well during this challenging period and is down only 2% compared to over 20% for silver or copper. However, generally, when the economy shows signs of distress and appears to be spiraling into recession, gold tends to surge as it did in 2020 with the threat of COVID-19. But, it is not.
As we speak, the market is experiencing two levels of decoupling, and I find both strange and probably unsustainable.
First, gold bullion – a traditional inflation hedge – is not responding this time. Analyst Adam Hamilton considers this gold’s bizarre decoupling from all precedent an extreme anomaly that will prove short-lived. This temporary aberration “has been driven by a parabolic US-dollar surge fueling unsustainable heavy gold-futures selling.”
This current raging inflation is literally unlike anything witnessed since the 1970s. And it sure should be after such radically-unprecedented money-supply growth by this profligate Fed. Yet gold is acting like the Fed never doubled the US dollars in circulation, like this latest inflation super-spike doesn’t even exist!
Second, the gold miners are not correlated to the gold price but more sensible to the overall market. Barrick Gold tumbled nearly 30%, whereas gold price dropped only 2%. However, this situation should correct as we inch closer to the recession.
Thus, I believe it is the best time to accumulate solid gold miners.
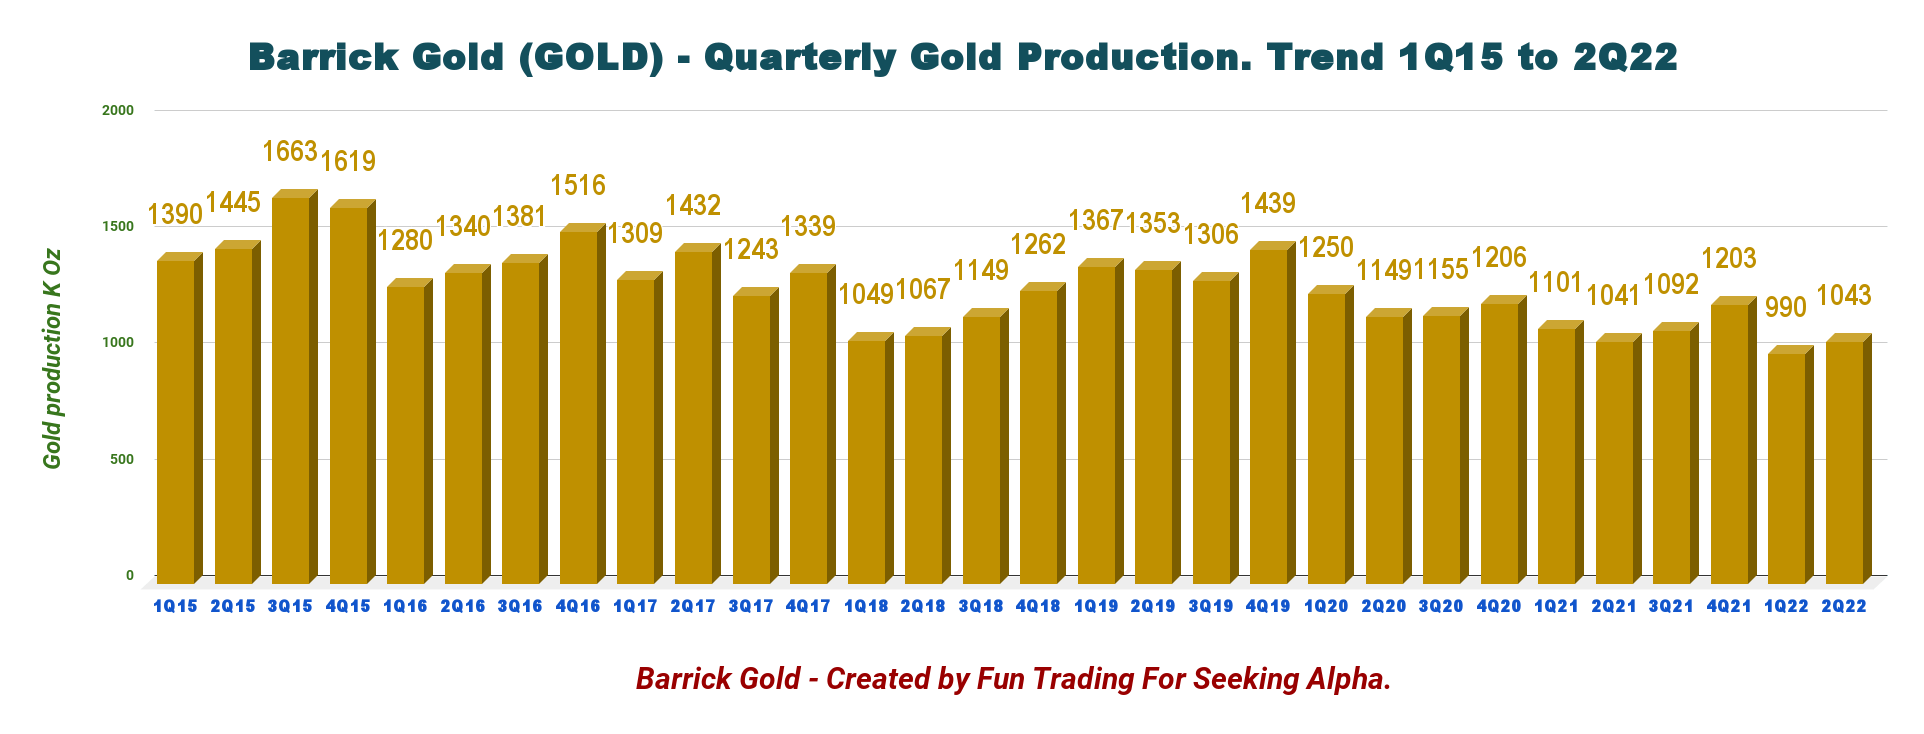
Part II – 2Q22 Gold Production and Commentary
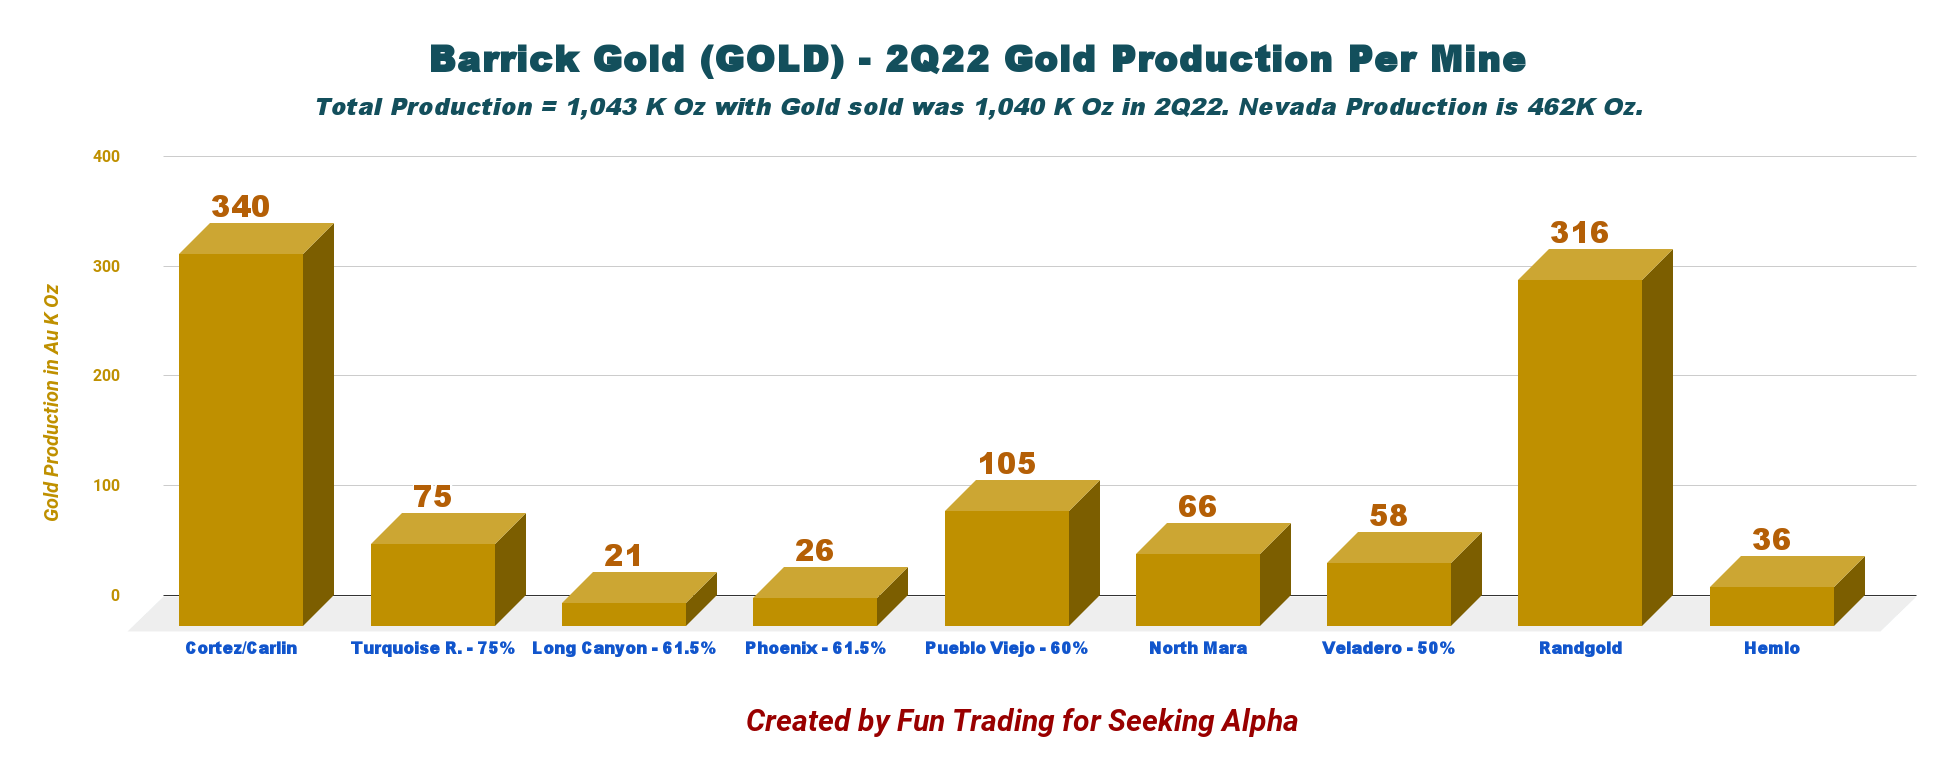
The company reported second quarter production for gold of 1,043K Au ounces (sold 1,040K Oz) and 120M Cu Lbs (sold 113M Cu Lbs).
The average price for gold in the second quarter was $1,871 per ounce, while the average copper price was $4.32 per pound. The company will indicate the AISC next week, but I expect AISC to stay around $1,150 per ounce due to inflationary pressure despite higher production sold.
1 – Gold production details and historical charts
Production this quarter was not particularly stellar, but it was better sequentially, as shown below:
GOLD Quarterly production history (Fun Trading)
Barrick’s gold production in 2022 is expected to increase through the year, and with the solid 2Q22 performance, the company remains on track to achieve 2022 gold and copper guidance.
Below is shown production per mine. JV Nevada represents five gold mines: Cortez, Carlin, Turquoise, Long Canyon, and Phoenix.
GOLD Quarterly gold production 2Q22 (Fun Trading)
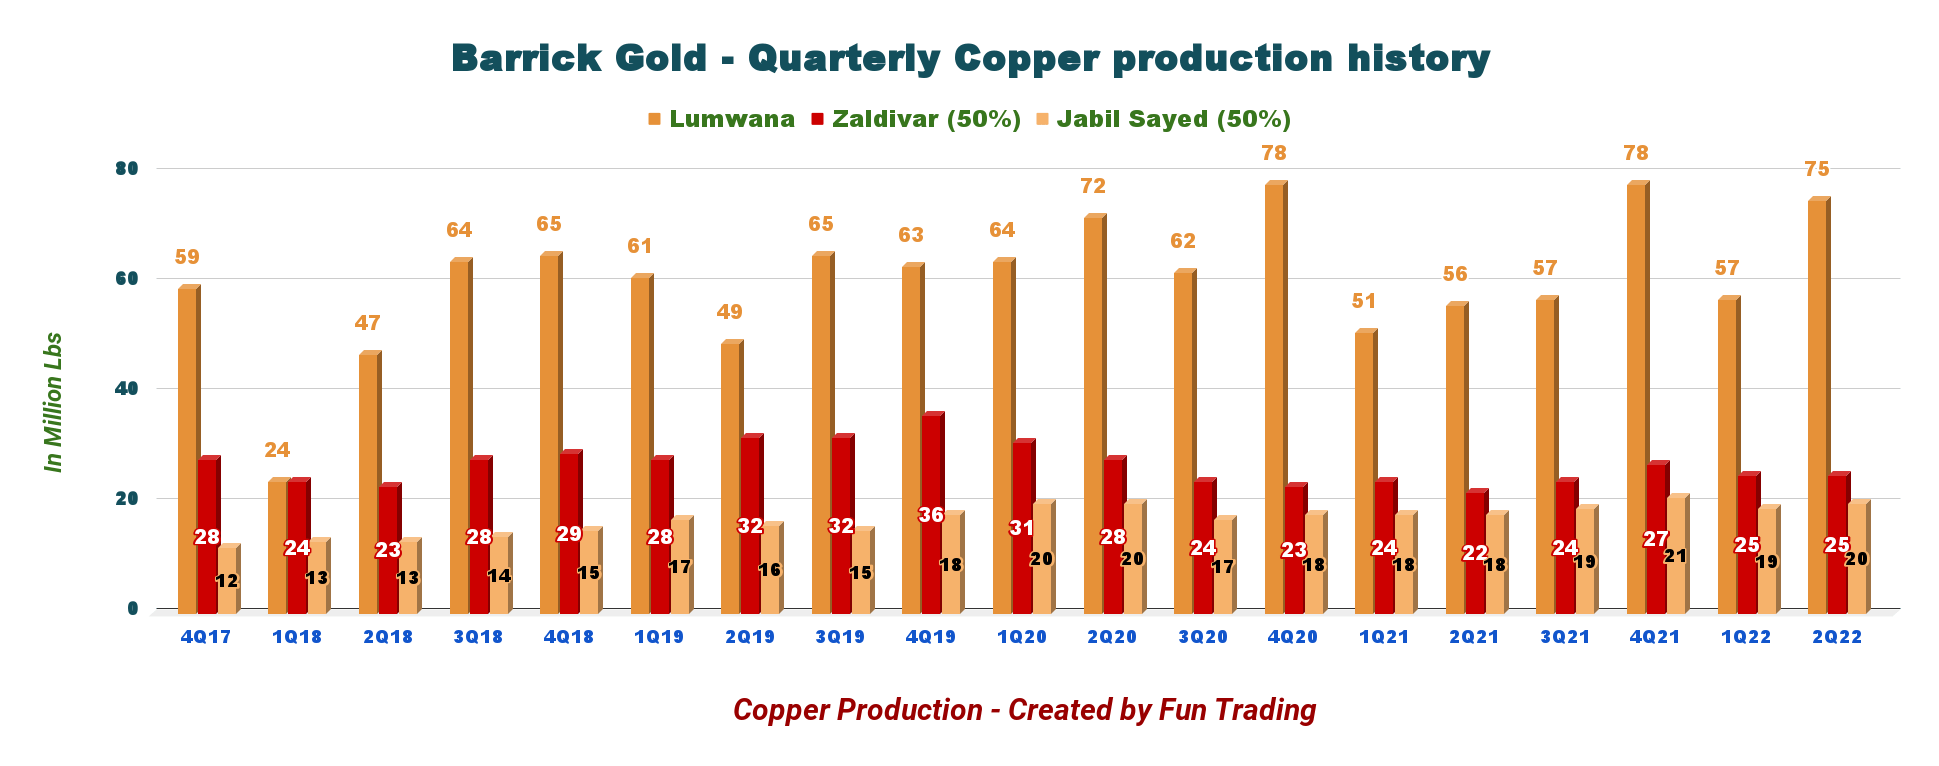
2 – Copper Production per mine and quarter ending the second quarter of 2022
GOLD Quarterly copper production per mine history (Fun Trading)
2Q22 copper production was 18.8% higher than in 1Q22 with 120 Mlbs and sold 113 Mlbs. In 2Q22, Barrick produced 120 Mlbs and sold 113 Mlbs. It was a good production quarter, but the copper price dropped significantly.
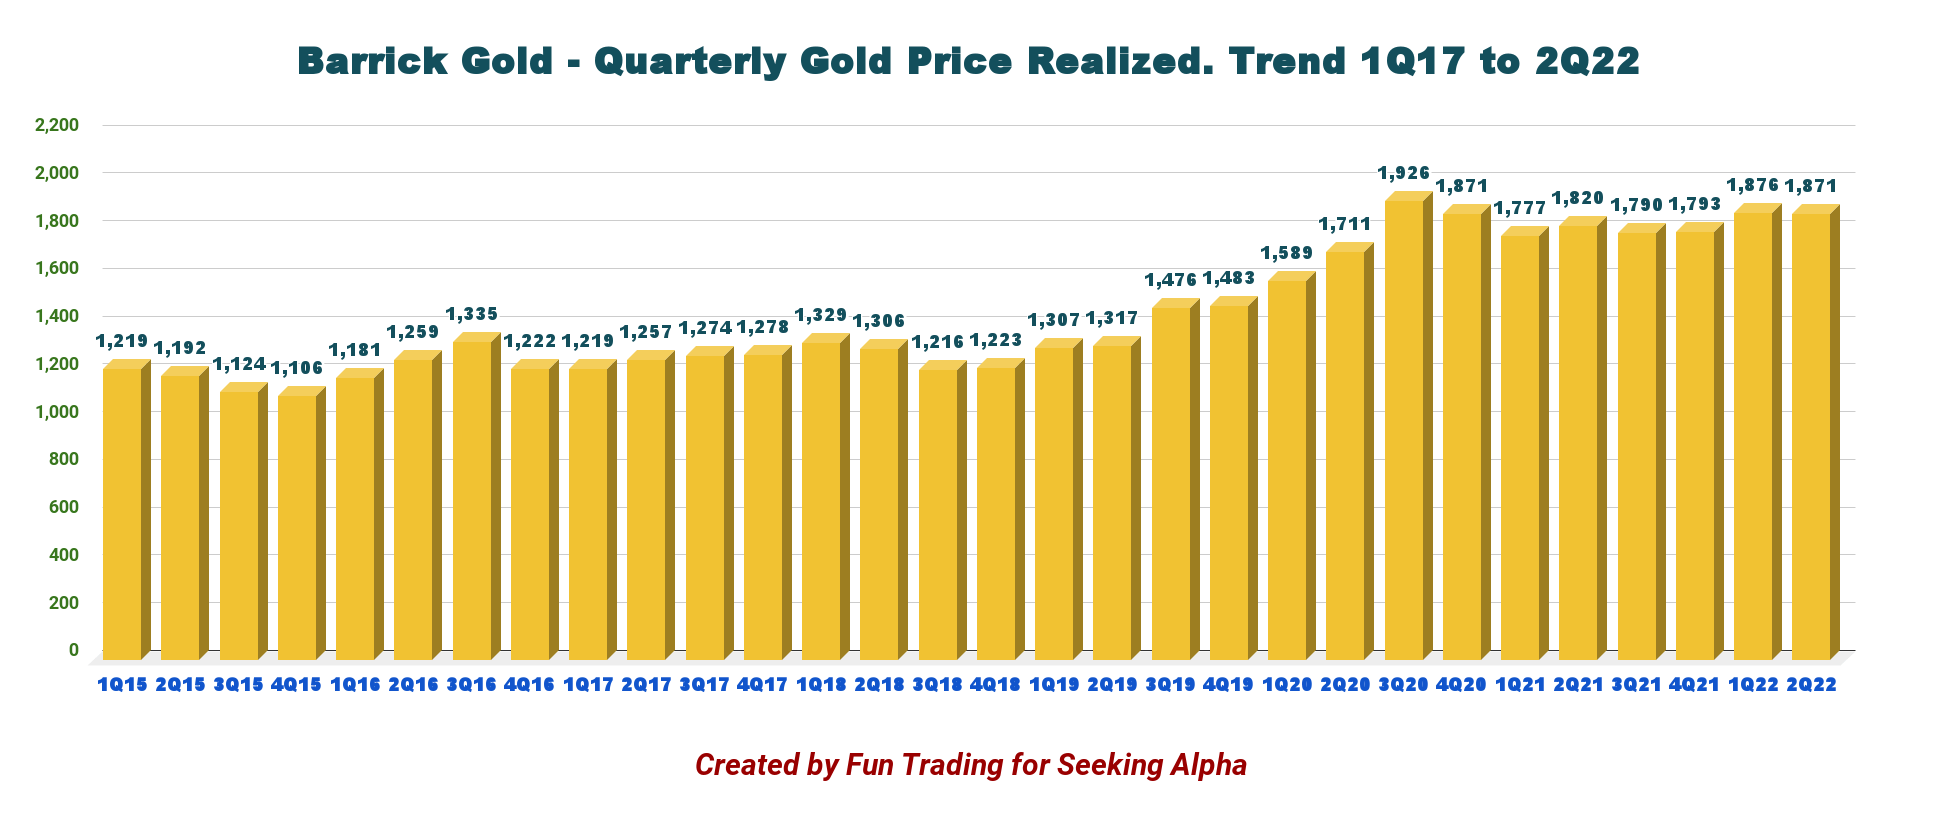
3 – Gold and Copper Prices realized
The average market price for gold in the first quarter was a solid $1,876 per ounce and $4.53 per pound for copper. Barrick enjoyed excellent prices this quarter. However, the copper price has dropped significantly.
3.1 – Gold price history
GOLD Quarterly gold price history (Fun Trading)
The gold price realized was $1,871 per ounce in 2Q22, nearly unchanged sequentially. However, the gold price weakened significantly with the market starting in April when the FED decided to be hawkish.
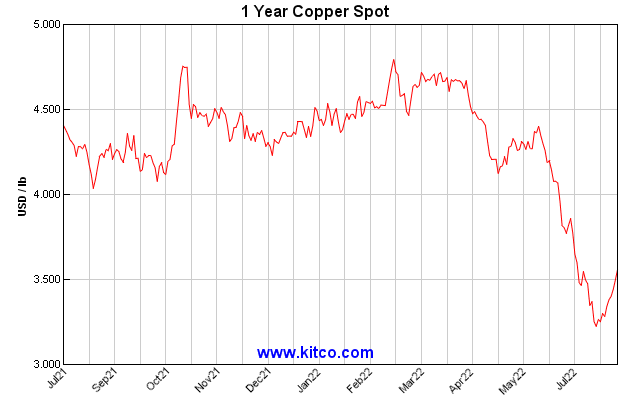
3.2 – Copper price realized will be lower this quarter
GOLD Quarterly Copper price history (Fun Trading)
Unfortunately, the copper price received by Barrick will be lower. The copper price in the second quarter of 2022 was 4.9% lower sequentially. The average market price for copper in 2Q22 was $4.32 per pound, but the closing price at the end of 2Q22 was $3.83 per pound. Thus, the copper realized for Barrick will be around $3.72 per pound based on what the company said below:
The Company’s second quarter realized copper price is expected to be 13-15% below the average second quarter market price for copper, primarily as a result of provisional pricing adjustments3 that reflect the decrease in the copper price near the end of Q2.
If we look at the one-year chart for copper, we can see how quickly and sharply the price of copper dropped since April when the FED indicated that it would hike interest aggressively to fight rampant inflation.
Since then, the FED has hiked two times 75-point, and the market believes that we are entering a recession that will affect base metals prices well into 2023.
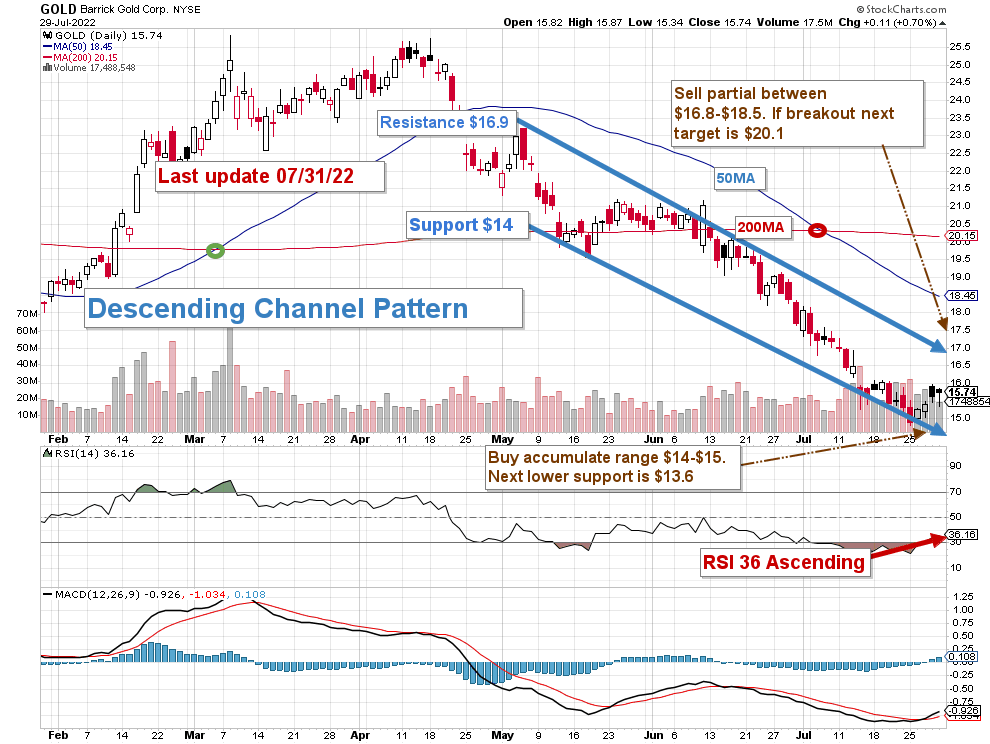
The overall strategy that I suggest in my marketplace, “The Gold And Oil Corner,” is to keep a core long-term position and use about 40% to trade LIFO (see note below) while waiting for a higher final price target for your core position between $29 and $30 and pocketing the dividend in the meantime.
The trading strategy is to sell ~30% between $16.8 and $18.5 (50MA) and another 10% above $20. I suggest waiting for a retracement between $14 and $15 to accumulate again with potential lower support at $13.6.
Watch gold price and the Fed mood like a hawk.
Note: The LIFO method is prohibited under International Financial Reporting Standards (IFRS), though it is permitted in the United States by Generally Accepted Accounting Principles (GAAP). Therefore, only US traders can apply this method. Those who cannot trade LIFO can use an alternative by setting two different accounts for the same stock, one for the long term and one for short-term trading.
Warning: The TA chart must be updated frequently to be relevant. It is what I am doing in my stock tracker. The chart above has a possible validity of about a week. Remember, the TA chart is a tool only to help you adopt the right strategy. It is not a way to foresee the future. No one and nothing can.
Author’s note:If you find value in this article and would like to encourage such continued efforts, please click the “Like” button below as a vote of support. Thanks.
Please note that foreign exchange and other leveraged trading involves significant risk of loss. It is not suitable for all investors and you should make sure you understand the risks involved, seeking independent advice if necessary.


Be the first to comment