

naphtalina/iStock via Getty Images
Modern financial theory has expectations as a cornerstone. The Federal Reserve has expectations as the keystone of its policy apparatus. However, expectations are ephemeral. They are extracted from surveys or derived from various financial metrics usually using indirect methodologies. There is always a risk that some technical complication gets in the way of an accurate assessment of expectations. Things like ‘liquidity premia’ might get in the way of deriving an expectation reading as is the case when using TIPS data to do this.
We all know how much ‘smarter’ it seems to describe a statistic or earnings report as ‘stronger than expected’ instead of saying ‘stronger than last month, or last quarter.’ That admission may raise the question of the difference between a forecast and an expectation. Forecasts seem to be more quickly derided than ‘expectations’ (of course the ‘forecast’ was wrong). Generally, expectations refer to the anticipation of a group of people or to a ‘market expectation.’ An individual might have a forecast and while that should not be different from his or her expectations; we would call that a forecast.
The preoccupation with expectations concerns how we anticipate markets will react to a number different from the one that is expected. But this will also depend on how other factors that rarely are discusses figure in…such as how firmly are expectations held? How broadly are they the same?
I said earlier Fed policy had expectations as its keystone. What that means is, if you pull the keystone out of an arch it collapses; similarly, if expectations are pulled out of the mix Fed policy collapses. When the Fed moved to target interest rates in 2012 Ben Bernanke noted that one purpose was to express to the market what the Fed’s target was because in doing that markets would act to reinforce the Fed achieving its policy goal. Fed policy remains a black box, in so far as the Fed is committed to no technique to achieve its target but it is committed to the target. Setting expectations on the achievement of that target is Fed policy. So what does it have when it misses?
Will expecting really make it so?
You may be aware (if you have a pulse) that there have been some massive Powerball jackpots for those who participate in that lottery in the US. I can assure you that I ‘expected to win.’ I expected as hard as a I could… and I still failed to win…why?
Expectations do not matter in the abstract. They matter in the real world and when they affect behavior. The act of ‘expecting’ does nothing. But if people expect and believe something will happen, they are more likely to become vested in that outcome. If that outcome does not occur people may have to change plans, take different actions. And such things may disrupt or change market pricing. This is the absolutely critical ingredient in forming expectations that many market participants, traders, investors, financial writers, portfolio managers and others, often get wrong. Not all expectations are created equal. They matter most when they are strongly held. Otherwise, they may not matter at all.
I was led to think about this after seeing some of the recent polling activity on the mid-term elections. These polls ‘informed us’ but if they informed us of an outcome we did not like, we always had the option to act differently than we may have told a pollster yesterday. Or we might get discouraged by the poll and that might cause the poll to become self-reinforcing. Sampling expectations is risky business. Yet everything in markets is geared to price to expectations that themselves are elusive, ephemeral, changeable, and yet all-important.
Jay Powell wants the Fed to get interest rates above the underlying inflation rate which he refuses to identify, but maintains should have some ‘forward-looking’ aspect. This clearly is because the CPI is rising at 7.8% the CPI core is at 6.3%. The Fed targets the PCE that is rising at a 6.2% annual rate (Core PCE 5.1%). The PCE numbers are lower than the CPI but the U of M inflation expectations numbers are lower still- the one year ahead median is at 5.1% the five year ahead mean expectation is 3.9% The five year median expectation is 3.0%. Obviously, anything forward-looking would mean the Fed could shoot for a lower Fed funds rate objective. But do we have any confidence in these measures?
Chart 1
U of Michigan Survey of expectations are in chaos
Timeseries plot of U of M CPI expectations cohorts (Haver Analytics, FAO Economics)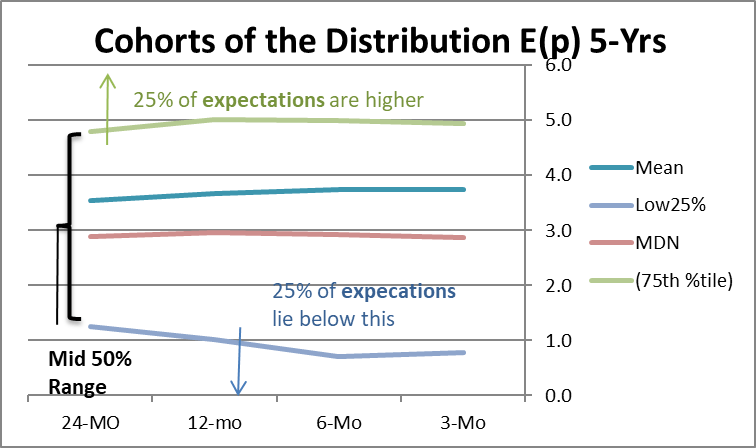
This graphic (chart 1) displays real data for the U of Michigan inflation expectations metric for the CPI. The mean expectations is above the median. The 3-month average of the mean is 3.8%, the median’s average is 2.9% and the gap between them is drifting to a wide divergence. The border that cuts off the top 25% of the distribution (of expectations) is at 5% over three- months. The three-month average of the borderline that separates the lower 25-percentile is at 0.8%. In November the gap between the top 25-percentile and the lower 25-percentile is 4.4 percentage points marking it as having a wider gap that this less than 0.5% of the time since 1990. That means the middle 50-percent of the distribution of inflation expectations is among the widest-ranging we have seen since 1990. This suggests to me that as a summary measure of what ‘people think’ the mean and median of the U of M survey may not be very powerful representational statistics. The Fed wants to make policy based off these low inflation expectations; we can always calculate a mean or a median, the question is whether they mean anything.
The gap between the mean and median was wider than its November value in August of this year but otherwise we must go back to August of 1996 to find a larger gap. At that time inflation expectations were set at 4.1%.
These calculations and observations suggest that the Fed is choosing metrics that will lower the target it wants to shoot for as a condition for calling monetary policy restrictive. These choices leave me with little confidence that the Fed is choosing its targets based on the science of economics. It seems based on a desire to keep from ‘spooking’ markets.
Chart 2
The raw data on mean expectations (Haver Analytics, FAO Economics)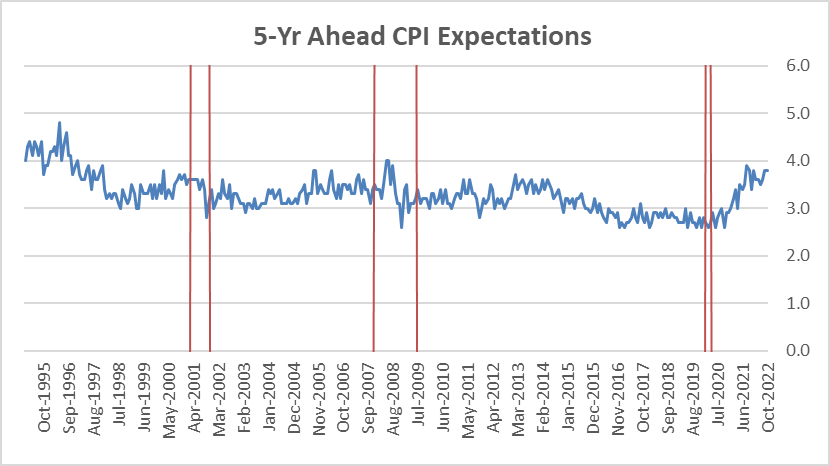
In chart 1 we saw that the five-year ahead mean rate for expectation in the U of M survey is above the expected median rate. Two things stand out in Chart 2: One is how tightly clustered expectations are and how little they move. The next is how much they have moved up since the end of the Covid recession. The Fed wants us to see these expectations that are crucial to its policy indicators as stamps of approval, yet they seem to barely move. Moreover, Chair Powell continues to talk of expectations being anchored but it does not look that way on this chart. Having anchored expectations is very important for Fed policy to be effective. The market needs to know the Fed’s inflation target and believe the Fed is both willing able to reach it. If expectations drift significantly away from 2% the Fed’s black-box policy is put under strain.
Chart 3
U of M inflation expectations data RANKED! (Haver Analytics, FAO Economics )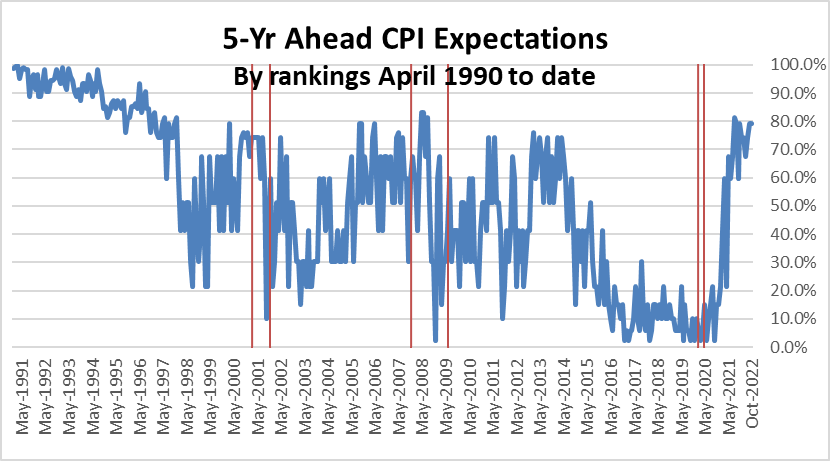
The chart above introduces a lot more variability to the same median inflation data by presenting the very same time series of expectations as percentile rankings over the period. What this chart suggests is that VERY SMALL CHANGES in expectations may in fact be very meaningful. This would contradict the conclusion of the chart above that expectations are stable and rarely move. But it would also suggest that expectations have more meaning in a relative sense than in an absolute sense. The rankings here paint a reasonable picture of expectations, generally rising ahead of recessions, falling after recessions, then usually rising as recoveries age. Here we see some very substantial changes in the ranking of expectations. These changes still have some ‘noise to them,’ but some real signaling value, too. The ranking of current expectations for 5-year ahead inflation have not been this high consistently since 1996. We also see the incredibly low run of inflation expectations from 2015 to early in the Covid recovery. You cannot look at his chart and think that inflation expectations are still anchored…you cannot.
Chart 4
ranked expectations VS ranked CPI (Haver Analytics, FAO Economics)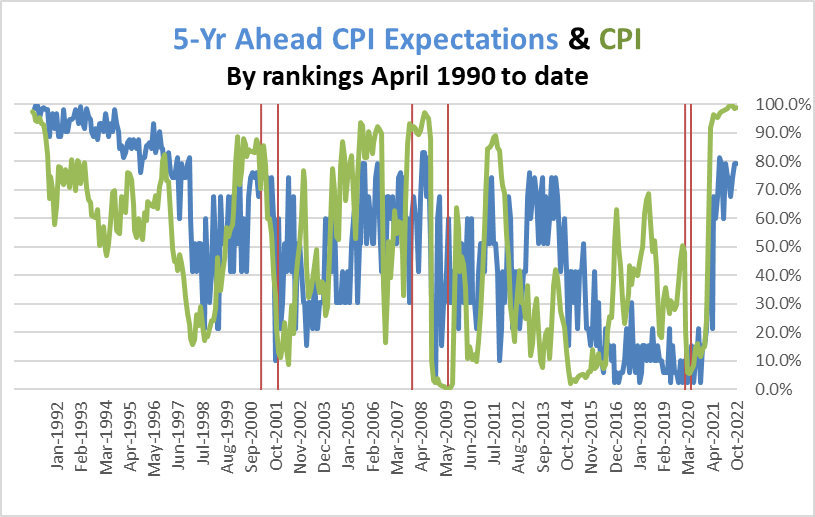
The chart above ranks the current year-over-year CPI against the same expectations ranking as in the chart above it. There are several salient things to learn from this chart. 1) that current inflation and five-year ahead inflation expectation rankings tend to move together, even though that does not seem completely sensible. The reason to look at 5-year ahead inflation expectations is to try to get an idea of what people are thinking in a time horizon sufficiently in the future to diminish the stresses and current events in the current economy that impact current inflation. 2) While there is some clear correlation between current and expected inflation there are also separations. For example… after 2016 the CPI flared on a number of occasions and yet inflation expectation rankings did not move. This clearly marks a period of consistent, low, and strongly held inflation expectations (Yeah Fed…or something else). Conversely, coming out of the high inflation period (not pictured) into 1992 to 2000 we see a much slower more consistent adherence of expectations rankings to the inflation ranking.
Chart 5
Ranked Inflation expectations Vs ranked oil prices (Haver Analytics, FAO Economics)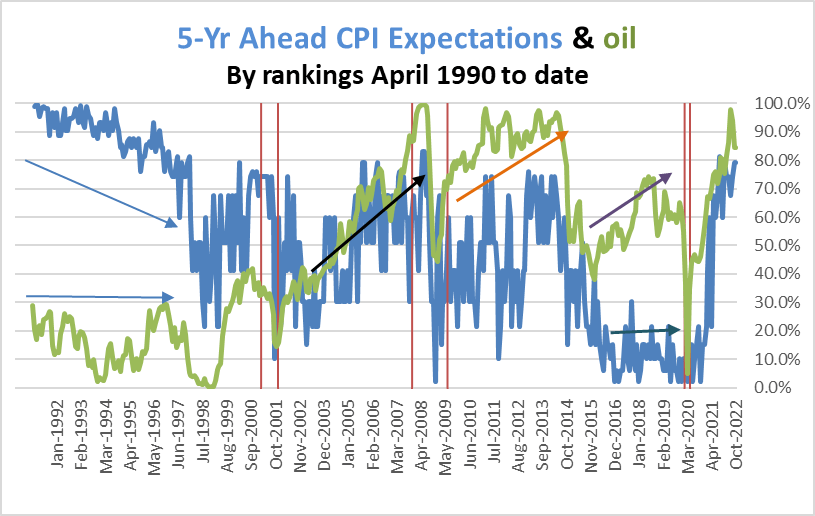
On this chart (chart 5) I show the ranking of the level of oil prices (WTI) with five year forward inflation expectation.
I have provided four sets of arrows to mark out some interesting periods on this chart. In watching this you can get an idea why looking at charts might be superior to using econometric methods since the things that markets are reacting to seem to vary and include threshold effects, that are either hard to model or hard to model ‘objectively.’ For example, oil prices (green series) were low from 1992 to 1988 then they plunged. The long period of oil prices staying low seems to have had an impact on inflation expectations- but note in chart 4 the CPI also was deflating. In 1998 to 2000. Expectations plunged and rose on the back of oil prices.
In the recovery from 2000 recession to 2007 (one black arrow) expectations followed oil prices as their rankings moved together led by oil inflation.
But after the Great Recession oil prices recovered (red arrow) and stayed high while the rankings of inflation expectations stayed at lower levels. When oil prices broke lower in 2015 expectations plummeted. And moved to their lowest values even after oil stabilized and saw its ranking rise (see purple arrows). This was a period of exceptional credibility on policy and a belief in continued low inflation. This is where we were before Covid stuck. The environment fooled the Fed into thinking it could be less vigilant. But we have paid a price for that. Inflation has been rising very rapidly in the post-Covid recession period as oil prices, also have seen their ranking rise. Inflation expectations’ rankings have surged.
Expectations matter but in what form?
The charts above are meant to convey what incredibly subtle things expectations are. They do seem to matter but their evolution is complex and maybe they are better understood for their relativity than for their absolute readings, which are limited. Plotted as a simple expectations series, expectations seem like they never really move and yet are noisy in a modest way (Chart 1).
Expectations, properly considered…
- Expectations… do seem to matter but their evolution is complex and maybe they are better understood for their relativity than for their absolute readings as we normally observe them… as the absolute readings are limited in scope and variability.
But convert those observations to rankings, and suddenly there is information in that seemingly tranquil series. And if you agree that this way of looking at expectations is useful, it suggests we are in a whole heap of trouble with the Fed losing its credibility and not taking the hard road to assured inflation destruction, but instead it is seeking the most modest road feasible.
Market dissonance?
It would be easy to blame the Fed for taking its eye off the ball and being at fault. I think that is a big part of the story. But another curious part of the story is that while market expectations are moving sizably higher ( I say sizable because I have not conducted any tests of statistical significance, and so not want to use the word ‘significantly’ and give the wrong impression ) those same market participants seem to be clambering for the Fed to do less and pivot sooner as though these inflation fears that seem embedded in the data are not there. Which is true?
This is one of the still confusing things about the economy. Interest rates are no longer as low as they were but they are still well below the most relevant inflation rates. Inflation is still extremely high. And while bond yields have moved up, they are still extremely low relative to both the fed funds rate (flat to inverted yield curve) and relative to 12-month trailing inflation.
In nominal terms with inflation so high and fed funds so low I would have expected higher longer term bond yields and an inverted yield curve. Yet, we have only one of these things and the yield curve has inverted with Fed funds still low relative to inflation- what does that signal? As you can see from the above charts and discussion and I am trying to reconcile market signals, market prices, and policy. And, right now, there is nothing that can reconcile the apparent disparities- the apparent disparities are real disparities. The only answer I have for these inconsistencies is that they are basically comparisons of end point conditions that do not tell us how we get to those conditions. And these can all be made much more consistent with each other on the assumption that we have a significant recession that is significant enough to reduce inflation and justify the low bond yields. Yet… the Fed continues to hold out the promise that this can be avoided. Is that true or is that the Fed trying to deflect political pressure? Since the Fed can’t say different things to different people, if its most important communication is to politicians telling them it is trying to avoid recession but then if it runs responsible monetary policy rates will move higher than Fed rhetoric suggests…. It worries me as an economist and market participant because Fed communications tell me the Fed is not focused on eradicating inflation. So, are we experiencing a Fed that feels it must speak to politicians or is this the Fed really telling markets this is what it can do what it thinks it can do? And if it is the latter isn’t there a lot of Pollyanna in that? Why would the Fed think it could do what has never before been done?
Accept ‘the relatively’ eliminate ‘the absolute’
One way out is my suggestion above that we use inflation expectations as a ranking instead of taking the point estimate from the survey to heart. If we do that, we are a lot more concerned about inflation expectations and we become detached from the view that inflation is anchored since it clearly is not. When forecasting inflation people may in fact have a hard time forecasting inflation five years ahead to be much different than what it has been. Interestingly 5-year ahead inflation expectations have 72% of their variance explained by the average inflation rate over the previous 5-years. That is remarkable. This measurement adds to the view (or it should) that the point value of expectations may not be as meaningful as the ranking of the current expectations. That ranking now is in its 81st percentile the CPI year-on-year gain is at its 98.7 percentile. It is not clear to me what the basis is for thinking inflation will migrate lower on its own – as the Fed assumes will happen even before interest rates become restrictive. Looking at the ranking of the absolute levels in the survey completely flips how one interprets inflation expectations- as high or modest…
Do expectations trump reality?
There is one last question, that might ‘square this circle’ of contradiction. If something were to occur that is unexpected, and if expectations were firmly held, does that make the event that occurs less believable? Is this a reasonable framework to understand our current predicament? Is this denial or ‘mean reversion?’ The spike in inflation was unexpected, must it be viewed as ‘unreal,’ not-lasting and, in some sense, untrue? That would imply – as the Fed forecasts- that inflation is bound to dissipate on its own since it is not real (the product of unexpected, transient factors). The Fed ‘may still need to raise rates,’ but the Fed need not be tight as it was under old rules (Chair Powell explicitly said the Fed need not get Fed funds above the 12-mo trailing rate of inflation). Is this right? Is it denial? Is the belief in mean-reversion, correct? I think the economy- the global economy has changed. Conditions in the US economy have changed. Markets themselves seem to disagree. It is important who is right! I can’t see the reason to cling to old expectations, given all the changes
Are expectations gifts from the gods?
Part of the problem with expectations is people want to put them on a pedestal, treat them as if they sprang full formed from the head of Zeus. But expectations are not like that, they are not ‘excessively special’ compared to other economic variables. Nor are they inviolable. It does not make sense to assume they are set in concrete. Ranking data on expectations suggest they are (or can be) quite pliable. No one can explain expectations very well; we really do not know how they are formed. This makes it harder (for me) to get behind them and think they will drive us to the future. That ability must be limited. Expectations can and do change…Why are expectations for inflation in such denial about where inflation is now, given that: 1) it is so high in the US, 2) so high globally, 3) driven by oil prices at time that the OPEC-plus cartel looks strong, 4) at a time that green policies are worsening the energy shortage and 5) when drought is adding further pressure on farm prices, as 6) war in Ukraine and 7) Russian sanctions take fertilizer off world markets? And 8) the US labor market is much tighter than it was pre-Covid. What is it that makes sense to hold the same low inflation expectations we had before Covid struck unless we posit extreme efforts by central banks to hike rates amid all these new conditions? I don’t ‘get it’ and so that is my warning. Beware of being led by expectations and about how you interpret expectations.
Be the first to comment