

ayala_studio/iStock via Getty Images
I have been bullish on Barrick Gold (NYSE:GOLD) over the last few years, anticipating gold prices will eventually rebound robustly to new all-time highs above US$2,100 an ounce. The bad news is neither company shares nor gold prices have been able to get moving, beyond temporary swings higher than lower again.
My last article in October here explained many of the reasons to expect Barrick’s extremely low valuation to support a price advance when gold decides to rise appreciably. The dividend yield story is excellent (at 2.6%, almost double the Wall Street median average rate), cash flow is strong, the balance sheet is as healthy as ever, and the company owns an enviable blue-chip lineup of mines around the world.
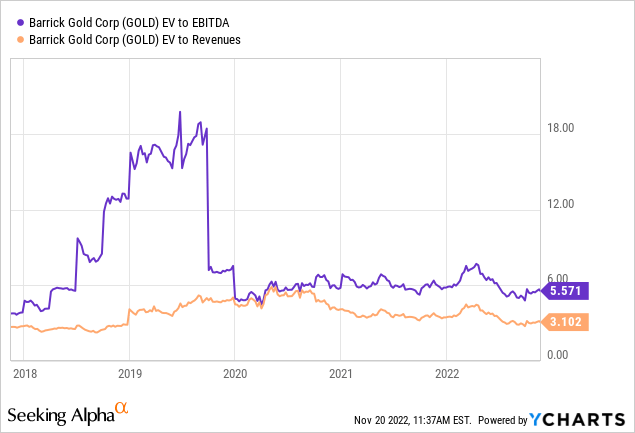
Below are graphs of solid profitability on sales vs. 5-year averages. Additionally, EV to EBITDA and revenue stats are trading nearer the low end of recent trading history.
YCharts – Barrick Gold, Gross and Final Profit Margins, 5 Years YCharts – Barrick Gold, EV to Trailing EBITDA & Revenues, 5 Years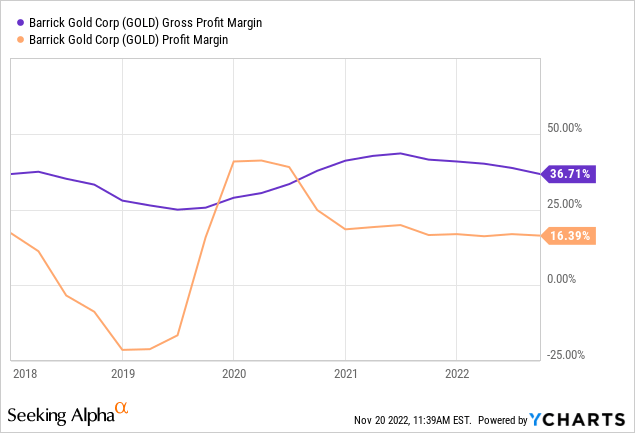
What I have been waiting for to complete the bullish argument is a rebound in momentum and price. And, it appears precious metal investments together have all been undergoing a turn higher since August (including gold, silver, platinum). The technical trading picture for Barrick specifically has been improving nicely in October and November. That is the focus of this article. Bullish momentum is getting harder to deny, and the current trading picture setup is typical of major bottoms in price for shares since the 1980s.
Rising Technical Momentum
First, U.S. dollar-denominated gold bullion prices have broken out of a down-trending line drawn from the March peak as Russia invaded Ukraine (green line below). Action over the last several weeks is typical of the first wave of buying off an important price bottom. Common reactions by market participants, short covering and confusion on why prices are advancing appear.
StockCharts.com – Nearby Gold Futures, Daily Price and Volume Changes wtih Author Reference Point, 18 Months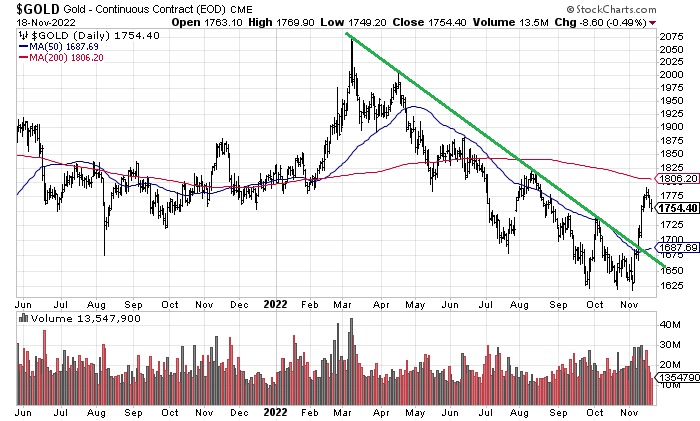
The positioning of futures traders is the most bullish for a turnaround in sentiment and price since early 2019 (circled in green below). The Commitments of Traders (COT) report shows retail traders and hedge funds have limited long exposure, while commercials (miners, refiners, brokers) are only slightly net short. In other words, plenty of new buying interest and short covering by speculators and traders could swing price higher at any moment. For sure, we are a distance away from the futures market positioning witnessed during past major gold price tops.
Tradingster.com – Gold Futuers COT, Since 2017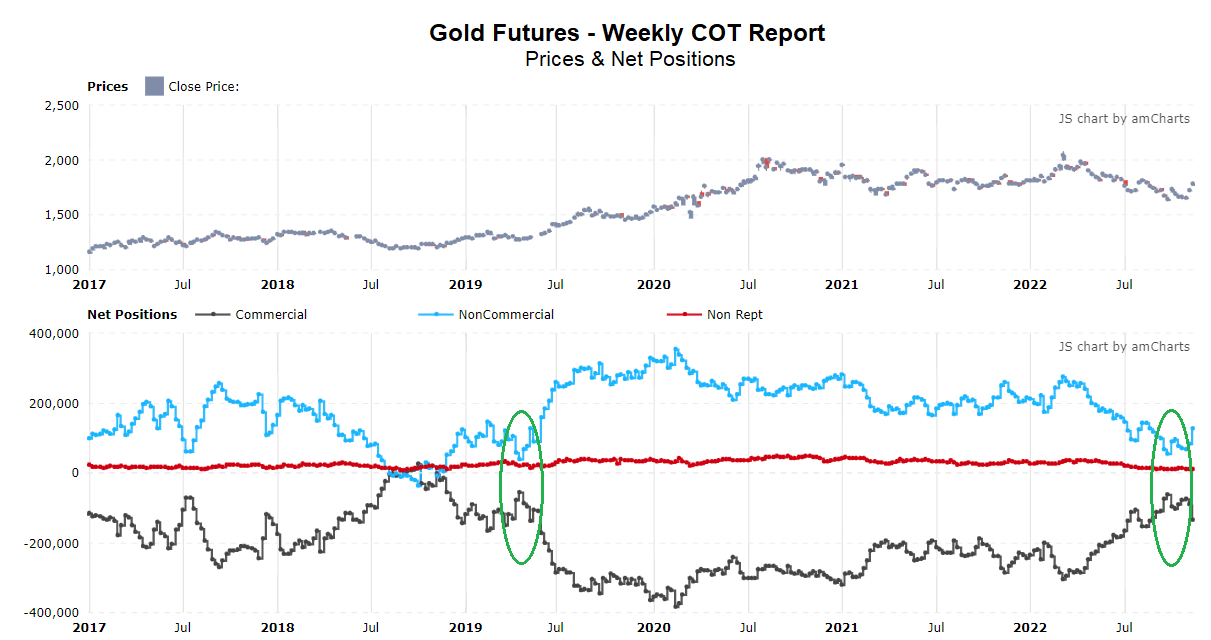
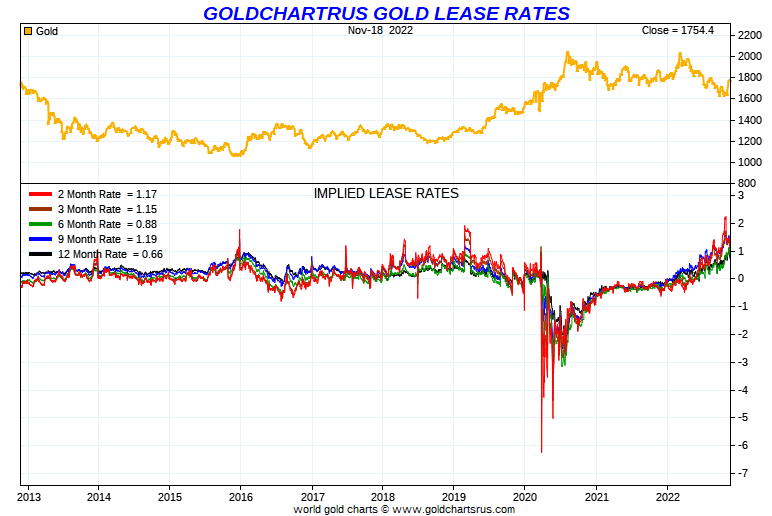
Gold market tightness is also seen in the 10-year high for implied lease rates, pictured below. Historically, when 2-month rates jump dramatically, a strong gold rally begins rather quickly. So, with my long-term “relative valuation” of gold vs. basic money supply increases, debt levels, and other asset class pricing (which I track and have discussed in previous gold articles) above $2,800 an ounce today, I think there exists plenty of upside when Wall Street decides it wants to own gold again.
Goldchartsrus.com – Gold Lease Rates, 2 Years Goldchartsrus.com – Gold Lease Rates, 10 Years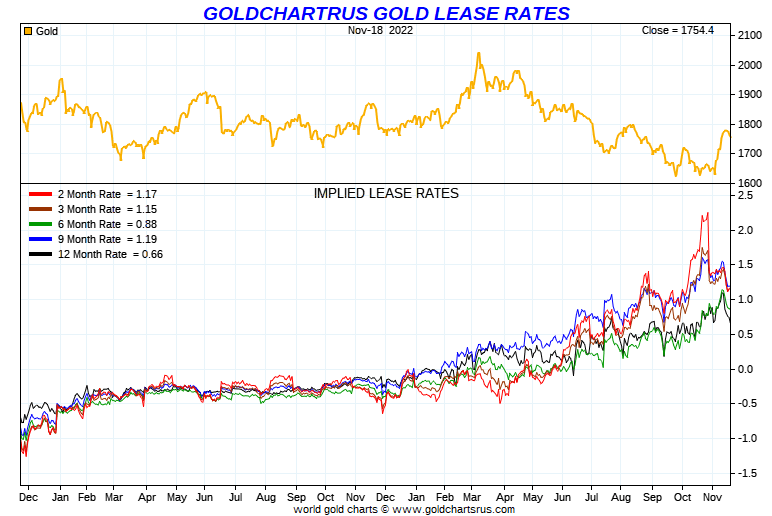
Barrick Gold Chart
For Barrick Gold specifically, the chart pattern is even more bullish than spot gold. Bottoming action in price since July is present, and price has recaptured its 50-day moving average. A break out above (the green trendline) $17 would be the next step to confirm a material bull move has begun.
More positive news, the 14-day Average Directional Index is quite low right now, indicating a nice “volatility” balance between buying and selling interest over three weeks. Early 2022 saw a similarly low ADX (circled in blue), which was almost immediately followed by a +40% price gain over three months.
In addition, two of my favorite momentum constructs, the Negative Volume Index and On Balance Volume readings did not dip lower in early November and confirm the lowest Barrick quote since March 2020. This divergence in action is a huge technical plus. Daily NVI bottomed in June (circled in red) and OBV reversed in September (circled in green).
StockCharts.com – Barrick Gold, Daily Price and Volume Changes wtih Author Reference Points, 18 Months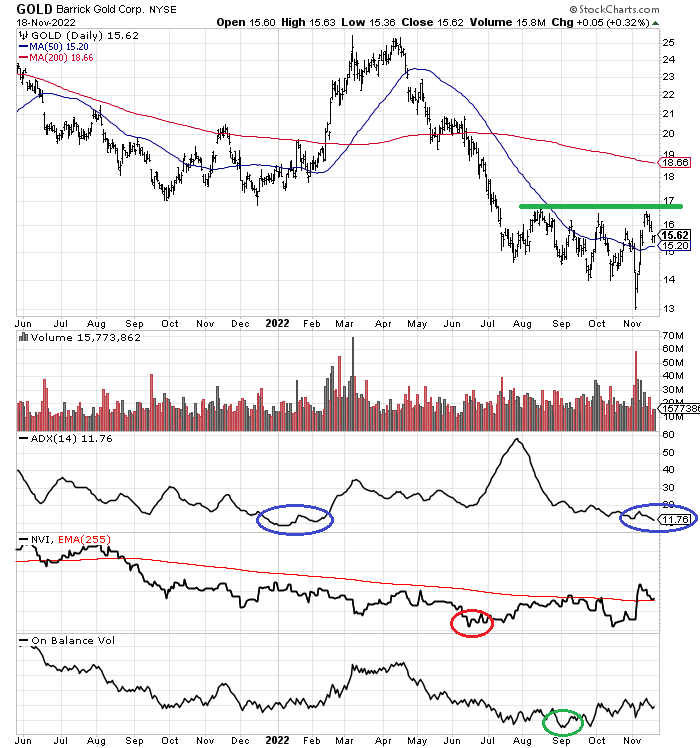
Final Thoughts
Barrick’s investment setup looks quite positive in the middle of November. Over coming weeks, I will become quite bullish on a break of the $17 price level on a closing basis. I sold my latest short-term trading position last week, locking in a solid gain on purchases since the end of August. Once $17 is crossed, I plan to repurchase a long position.
Such could happen quickly on any geopolitical event in the world, or hints by Federal Reserve governors that a slowing macroeconomic expansion is the newest worry. Falling inflation rates may already mean the rate hiking cycle is almost finished. My long-term gold bull argument is centered on the resumption of wild money printing in 2023 to combat a weakening economy and recession. Forecasting a price above $3,000 an ounce in 12-24 months is more than possible. Under this price regime, Barrick could trade north of $30 a share, to as high as $40. Where else can you find what I’d consider legitimate total return upside above +100% under a timespan less than 2 years?
The downside risk is primarily dependent on gold prices. If my expectation of higher gold prices in 2023 proves wrong, Barrick will drift lower in price. However, an undervaluation position today on various fundamental metrics should blunt the odds of huge losses for buyers in the $16-$17 area.
Thanks for reading. Please consider this article a first step in your due diligence process. Consulting with a registered and experienced investment advisor is recommended before making any trade.
Be the first to comment