

stevecoleimages/E+ via Getty Images
by Levi at StockWaves; produced with Avi Gilburt
There is a compelling case to take Gold to $2428 or higher in the months to come. How do we arrive at that target? For much more in-depth analysis, I would suggest you carefully read Avi Gilburt’s recent article discussing what would propel the metal to those heights (see here).
If this target proves true, then our task is to identify miners that can effectively leverage that price to their and our advantage. We track dozens of miners, favoring both silver and gold. Here we present one of those options in Barrick Gold (NYSE:GOLD).
We Have Tailwinds
Here are some recent comments from Lyn Alden regarding the fundamentals for Gold and miners:
“I expect gold to consolidate a bit in the intermediate-term, but am rather bullish on it in the years ahead.
After a huge run-up throughout the 2000s decade, the gold market became overvalued and euphoric during 2011/2012, along with gold miners who had over-invested in new production. The 2010s decade then experienced disinflation and positive real yields, while the gold market stagnated.
I view the 2020s to be a story of global diversification and negative real yields. Due to high debt levels, US Treasury yields will likely spend the majority of their time below the prevailing inflation rate, and global central banks have been gradually moving away from US Treasuries and towards gold as a neutral settlement and savings asset, with properties that make it resistant to confiscation and able to keep up with inflation over time.
Miners should do well along with gold in the 2020s decade. Their future returns will very much depend on gold price appreciation, and overall, I like the risk/reward ratio of owning gold and other precious metals more than owning the miners. However, miners do have a lot of long-term potential at these levels.
Looking at Barrick (GOLD) for example, their price/earnings ratio doesn’t seem particularly compelling at first glance:
FastGraphs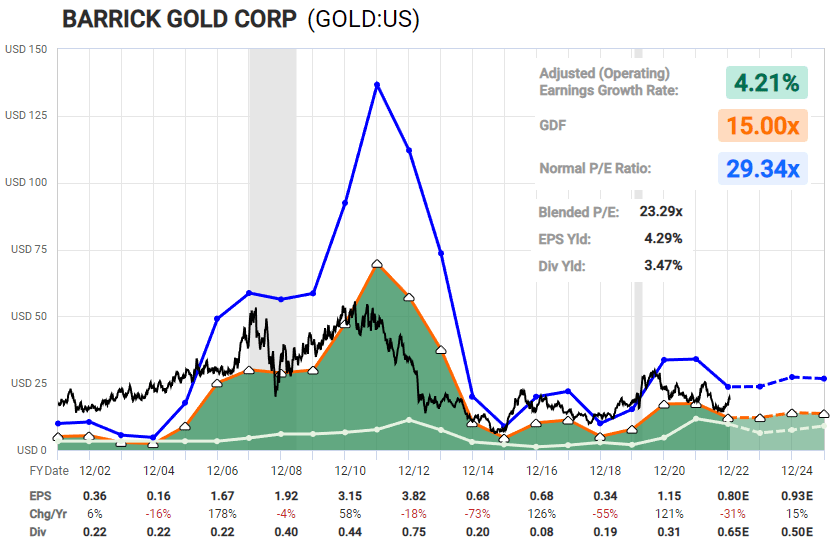
However, the company has spent the last several years paying down a ton of debt, and now they have no net debt:
YCharts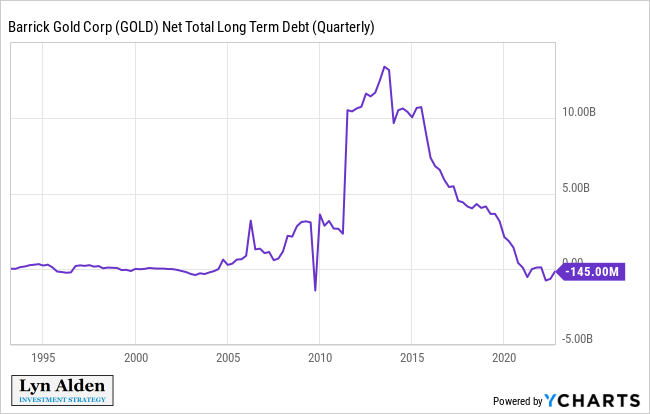
As a result, the ratio of enterprise value to revenue is below its historical average:
YCharts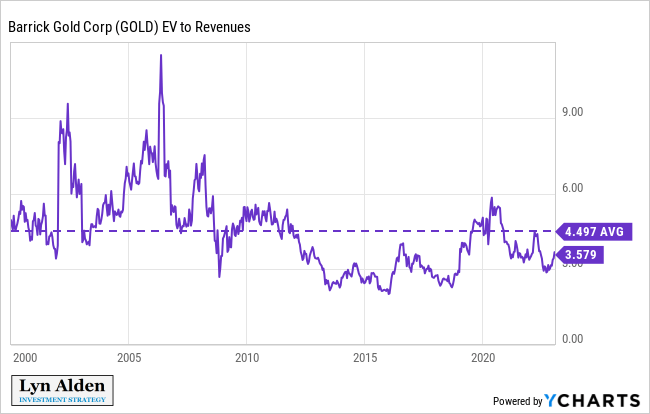
The Technical View
We typically will see the technicals turn before the fundamentals. What’s more, the technicals will likely signal when a top is near as the fundamentals appear to look their strongest. How can we use Elliott Wave theory along with our proven Fibonacci Pinball overlay to project a high-probability path for Barrick Gold?
StockWaves / MotiveWave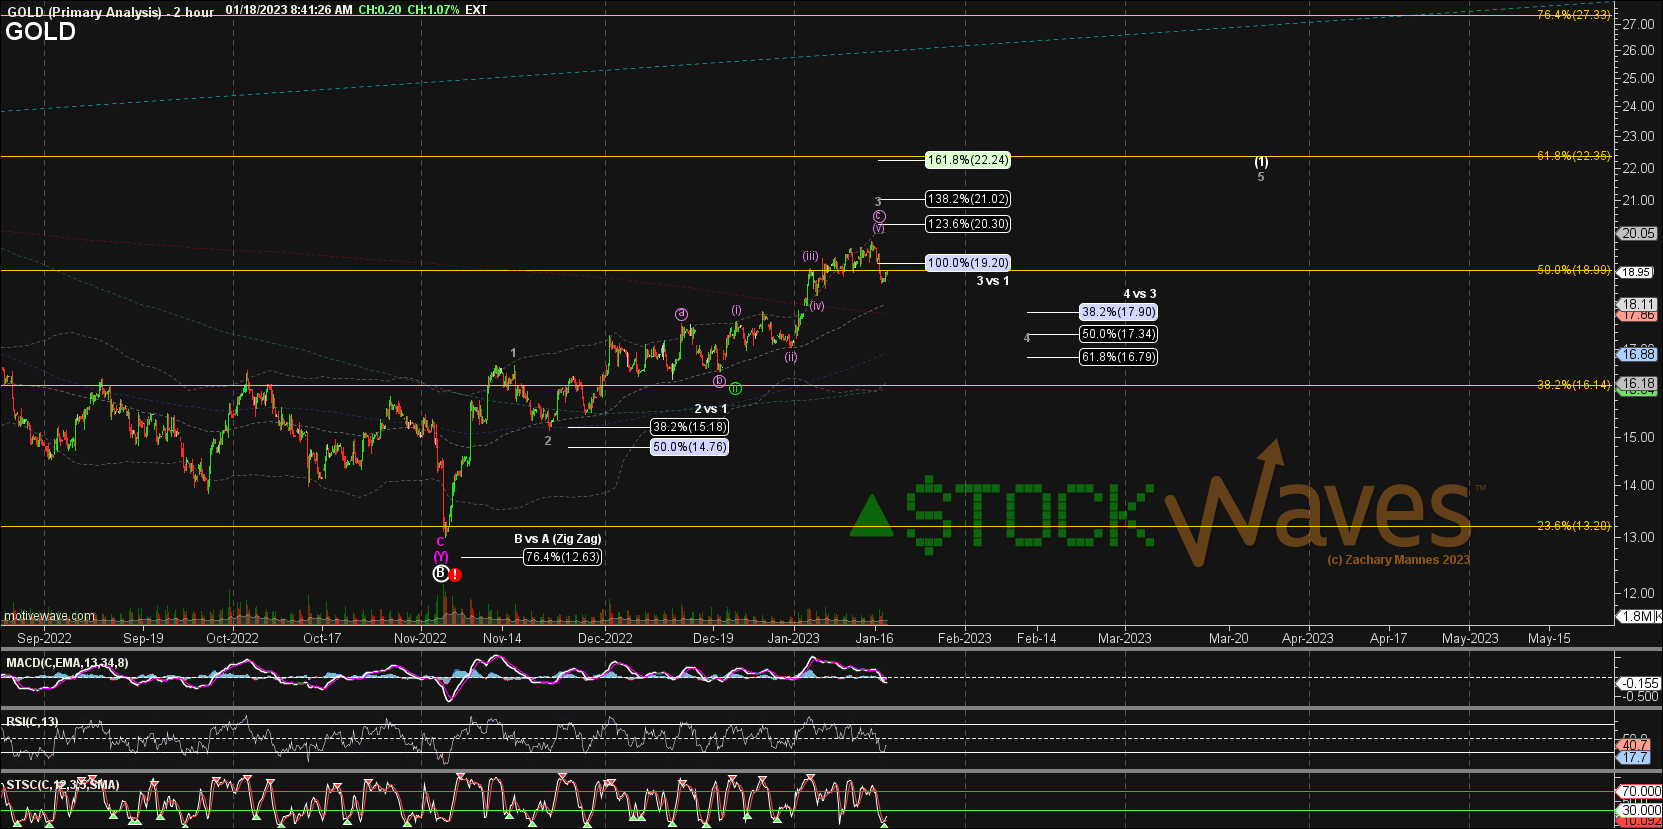
You will note on this chart that we are counting the low struck at $13.01 in Barrick Gold at the beginning of November 2022 as a Primary ‘B’ wave low. What does that mean? In the most basic of terms, just as the alphabet tells us, a Primary ‘C’ wave should now unfold. This tells us that the next rally segment should be a five wave structure.
If we count the initial rally up and corrective pullback during the month of November as waves 1 and 2 of the first larger wave [1], you can find where we currently are on the path to what is likely much higher levels over the next several months.
Supposing wave [1] fills out as anticipated to the $22 level, a corrective pullback could be to the high-teens or even shallow to $20. What this means in the big picture though is that once the [1]-[2] completes, it would point to near all-time highs or higher in Barrick Gold.
Risks
Where might this scenario be wrong? If we see Barrick Gold break back below the November low of $13, then something else is playing out. Also, of course, sentiment, which is the main driver of price in the markets, can shift back to neutral or even negative in the metals. We closely monitor these structure and what the markets are telling us. Then, we adapt accordingly.
Remember, markets are non-linear (which means that cycles don’t always work), fluid (always in motion) and dynamic in their structure. It is this dynamism that requires us to maintain an open mind and always be left to possibilities along the path.
Why Elliott Wave? There’s Got To Be Another Way…
Simply, because it works. There is a caveat to that statement, of course. It works when correctly applied. Years ago, Avi Gilburt observed specific movements within the structure of price in the markets. Through much in-depth study and further observation and practical use, Fibonacci Pinball was developed. This is a system that removes much of the subjective possibilities that are available to the user of Elliott Wave theory. It has greatly increased our accuracy over the years.
For the proof that is in the pudding, simply review some of these key pivotal moments over the last 10+ years that ElliottWaveTrader.net has been publicly providing technical analysis to the readership here at Seeking Alpha and of course, on our own site:
► July of 2011: Called for rally in DXY from 73 with target of 103.53 while the Fed was pumping QE into the market and everyone was expecting a dollar crash. Market rallied initially to a target of 103.82 (within 29 cents of our long term target) before a multi-year pullback, as we expected.
► September 2015: Rolled out the EWT Mining Stock service, and started suggesting buys on stocks like Barrick Gold (at $7) and Newmont Mining (at $15).
► December 2015: Called for a major bottom in gold the night we struck the bottom, despite the market turning extremely bearish at the time and expecting a break down below $1,000.
► December 2015: Called for a market top in the 2100SPX region, to be followed by a pullback towards 1800, and followed by a “global melt-up” to at least 2600SPX “no matter who gets elected” in 2016. Market bottomed at 1810, and began a strong rally to 2872.
► November 2018: Called for a bottom in TLT in the 112/113 region, with the expectation of a larger rally to follow. TLT bottomed at 111.90, and rallied to 179.70, despite the Fed still strongly raising rates at the time it bottomed.
► December 2019: Called for a 30% correction to begin by the first quarter of 2020. We began the Covid Crash in February of 2020.
► March 2020: Called for a major market bottom at 2200SPX, with an expectation of a rally to at least 4000SPX. Market bottomed within 8 points of our target.
► April 2022: Suggested to cash in most of NEM position (bought in 2015 between $15-$17) in the $84/85 region. NEM topped at 86.37, and proceeded to drop 57% immediately thereafter.
Why Does This Work So Well?
It has to do with the nature of markets. What truly moves markets is sentiment. This sentiment manifests itself in the structure of price. These structures repeat on all time frames from the minuscule to the macro and are therefore predictable.
As well, Elliott Wave theory, when correctly applied, is the only method that we know of that provides context to current market action. It tells us when to be more aggressive with positions and when to back off or even not be involved at all. And, even with that, when being aggressive, we have key levels that must hold as the structure unfolds and this helps us to protect profits once garnered.
I would like to take this opportunity to remind you that we provide our perspective by ranking probabilistic market movements based upon the structure of the market price action. And if we maintain a certain primary perspective as to how the market will move next, and the market breaks that pattern, it clearly tells us that we were wrong in our initial assessment. But here’s the most important part of the analysis: We also provide you with an alternative perspective at the same time we provide you with our primary expectation, and let you know when to adopt that alternative perspective before it happens.
There are many ways to analyze and track stocks and the market they form. Some are more consistent than others. For us, this method has proved the most reliable and keeps us on the right side of the trade much more often than not. Nothing is perfect in this world, but for those looking to open their eyes to a new universe of trading and investing, why not consider studying this further? It may just be one of the most illuminating projects you undertake.
Be the first to comment