

akinbostanci
So far, 2022 has been one of the toughest years for equity investors in the last few decades. The three most popular U.S. equity indexes – the S&P 500 Index, the Nasdaq Composite Index, and the Dow Jones Industrial Average Index – ended the third quarter firmly into bear territory.
The indexes hit low points in mid-June but recovered some of the losses over the following eight weeks, as if they took a summer break. The downward trend resumed in the middle of August and accelerated in the second half of September, erasing all summer gains and then some. As of 9/30/2022, the S&P 500 Index was 25.2% below its all-time high.
Challenging Times Often Present Exceptional Opportunities
While equity bear markets are not uncommon, there has been some extraordinary behavior during the current bear market. In the first nine months of 2022, the S&P 500 Index recorded 106 negative trading sessions – over 56% of all trading days. This is unusual – not just relative to the past few years, but also relative to long-term history. The long-term average of negative trading days in a year has been 46%.
There were only two other calendar years since 1928 when the S&P 500 Index negative trading days occurred more than 56% of the time. The bars colored in orange denote the calendar years with negative returns for the S&P 500 Index. According to the data, years with a high number of negative trading days and negative returns were typically followed by years with positive returns for the index.
The S&P 500 Index Has Experienced an Unusually High Number of Down Days in 2022
S&P 500 Index – % Trading Days with Negative Return 01/03/1928 – 9/30/2022 (Sources: FactSet, Baron Capital.)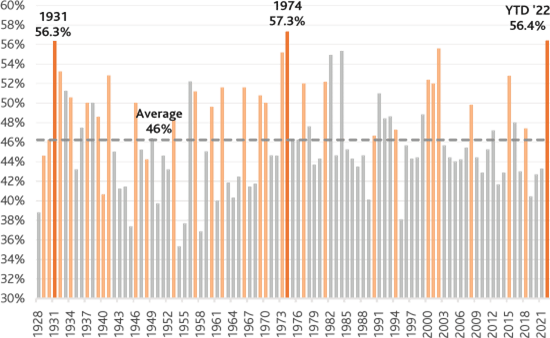
| Note: Calendar years colored in orange indicate negative calendar year return for the index. Years colored in grey indicate positive calendar year return. Past performance is not indicative of future results. The index is unmanaged. Index performance is not Fund performance; one cannot invest directly into an index. |
Stocks have been mostly trading lower this year, but what is most interesting is that almost all stocks have been selling off. The chart on the top right shows that as of 9/30/22, 86% of the companies in the S&P 500 Index were trading lower than at the start of the year, and a staggering 95% of companies traded lower between 8/31/22 and 9/30/22. The story is similar for other major U.S. and international equity indexes.
The second chart below shows that the median stock decline year-to-date was 23.8% for the companies in the S&P 500 Index, and in September alone it was 9.2%. Smaller-cap growth, technology, and international stocks performed even worse over both periods.
Most Stocks Have Traded Down Significantly YTD and in September
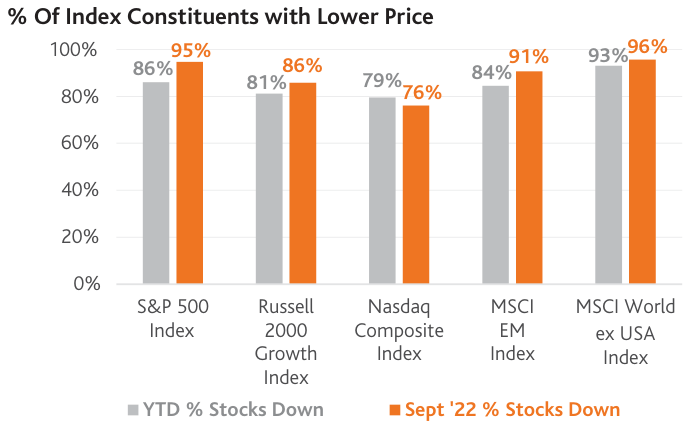 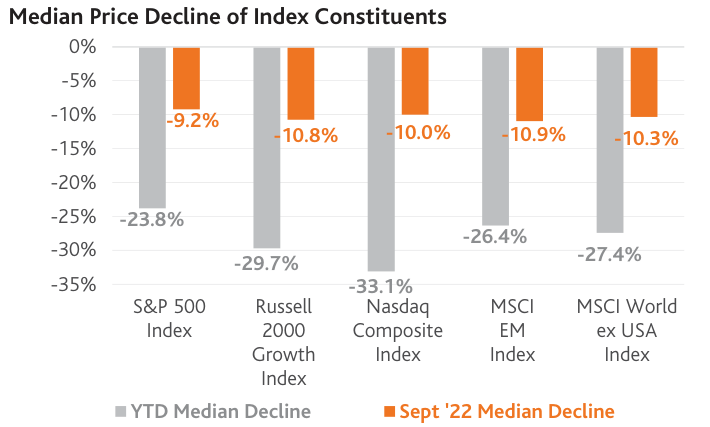 Sources: FactSet, Baron Capital. |
| Past performance is not indicative of future results. The indexes are unmanaged. Index performance is not Fund performance; one cannot invest directly into an index. |
There are two basic ways to think about this data. The pessimistic view would be that something bad is happening or is about to happen to businesses. The higher uncertainty around inflation levels, the Fed’s aggressiveness in raising rates, and the increasing possibility of a recession have given plenty of reasons to worry about what comes next. Gloomy reports and TV commentators predicting a lasting global crisis have caused additional pessimism. In times like these, it is easy, and perhaps natural, to be pessimistic.
The less flashy yet optimistic takeaway from the above data would be that the market is presenting a rare buying opportunity. When stocks are trading at a discount versus their historical valuations, there should be good deals to be had.
Baron’s view falls in between. We do not know what comes next for the economy and the stock market, nor do we try to predict, but we recognize that economic conditions have been deteriorating. At the same time, we have been finding attractively priced businesses with strong fundamentals and growth prospects. During the 40-year history of Baron Capital, we have been through similarly (or more) challenging environments. Ron describes these as “once-in-a-generation buying opportunities,” since they occur rarely and can be highly rewarding to long-term investors.
Finding pockets of opportunity amid high volatility is not a trivial task. Passive investment vehicles, like index-based ETFs, are not designed to do this – they can only provide average market returns. Skilled active managers with a multi-year time horizon, on the other hand, can use their knowledge and experience to identify the businesses that are in stronger fundamental shape and well positioned to take advantage of long-term growth opportunities.
In times of uncertainty, many investors turn to historical data to identify similar past periods and infer what may happen next. There are valuable lessons that investors can learn from history, but how to time markets certainly is not one of them. Over short periods of time, the market can be highly volatile, making it unpredictable. When stock prices are rising or falling, no one knows how long this may last or how significantly prices may change. Over the long term, the market has offered at least one consistent outcome – it has gone up, periodically reaching new all-time highs, as the chart below shows.
The S&P 500 Index Has Been on an Upward Trend Over the Long Term
S&P 500 Index – Long-Term Performance (bear market periods highlighted) 1/3/1928 – 9/30/2022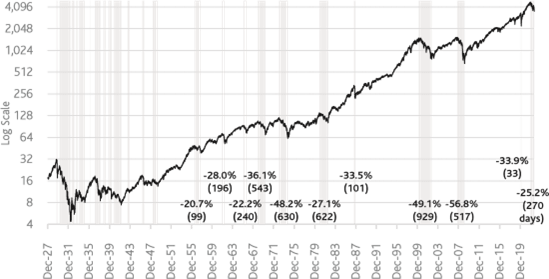
Prior to the 2022 bear market, there had been 21 other bear markets (since 1928), only six of which occurred over the past 50 years. The market has been in a bull phase most of the time – 77% of the time since 1928, and 83% of the time over the past 50 years. Bear markets have become less frequent compared to the first half of the 20th century, but this has not made them more predictable. The chart reveals no apparent pattern or indicator that may help avoid a down market or time the best entry point.
The table below shows the duration and magnitude of each bear market the S&P 500 Index experienced since 1928. On average, bear markets have lasted about a year (median – eight months) and the index has declined 37% (median – 33.5%). However, because the duration and strength of individual bear markets have varied significantly from the mean and median values, we don’t think that these statistics can be a useful guide for the duration and magnitude of the current bear market.
Historical Bear Markets Have Varied Significantly in Length and Magnitude
S&P 500 Index – Historical Bear Markets (1/3/1928 – 9/30/2022)
|
|
|
Chart and table data sources: FactSet, Baron Capital. Note: Bear markets are measured as a decrease of 20% or more after a peak from an increase of 20% or higher (vice-versa for bull markets). Past performance is not indicative of future results. The index is unmanaged. Index performance is not Fund performance; one cannot invest directly into an index. |
On the other hand, the table shows that the S&P 500 Index tends to increase quickly and materially after it hits bottom. This poses great risk to those who attempt to time the low points – not being invested in the first weeks during the recovery could be costly. For example, after the Financial Crisis bear market ended in March 2009, the S&P 500 Index gained 26.6% in the first month and an additional 33.1% over the subsequent 11 months.
A closer look at the individual bear markets and their concurrent economic environments doesn’t seem to offer much additional insight for predicting what lies ahead. Each period has been characterized by a unique combination of circumstances which makes it difficult to draw comparisons. The charts below show how each of the past eight bear markets for the S&P 500 Index unfolded, overlapped with recession periods, inflation, unemployment, and Fed Funds Rate levels at the time. There are several observations we believe are worth pointing out:
- There was a recession during most, but not all, bear markets (six out of eight).
- In all six recessionary periods, bear markets always began prior to the start of the recession.
- In five of the six recessionary periods, bear markets ended prior to the end of the recession.
- Out of all eight bear markets, only the 1973-74 and 1980-82 periods were characterized by high inflation levels, similar to today’s. However, in 1973-74 inflation was high and rising, while in 1980-82 it was high and declining. In addition, in both periods the Fed Funds Rate was very high, more than double what it is today.
Historical Bear Markets Have Occurred During Various Economic Conditions
S&P 500 Index – Historical Bear Market Details
S&P 500 Index – Historical Bear Market Details (Sources: FactSet, The National Bureau of Economic Research, U.S. Bureau of Labor Statistics, Board of Governors of the Federal Reserve System (US), Baron Capital. )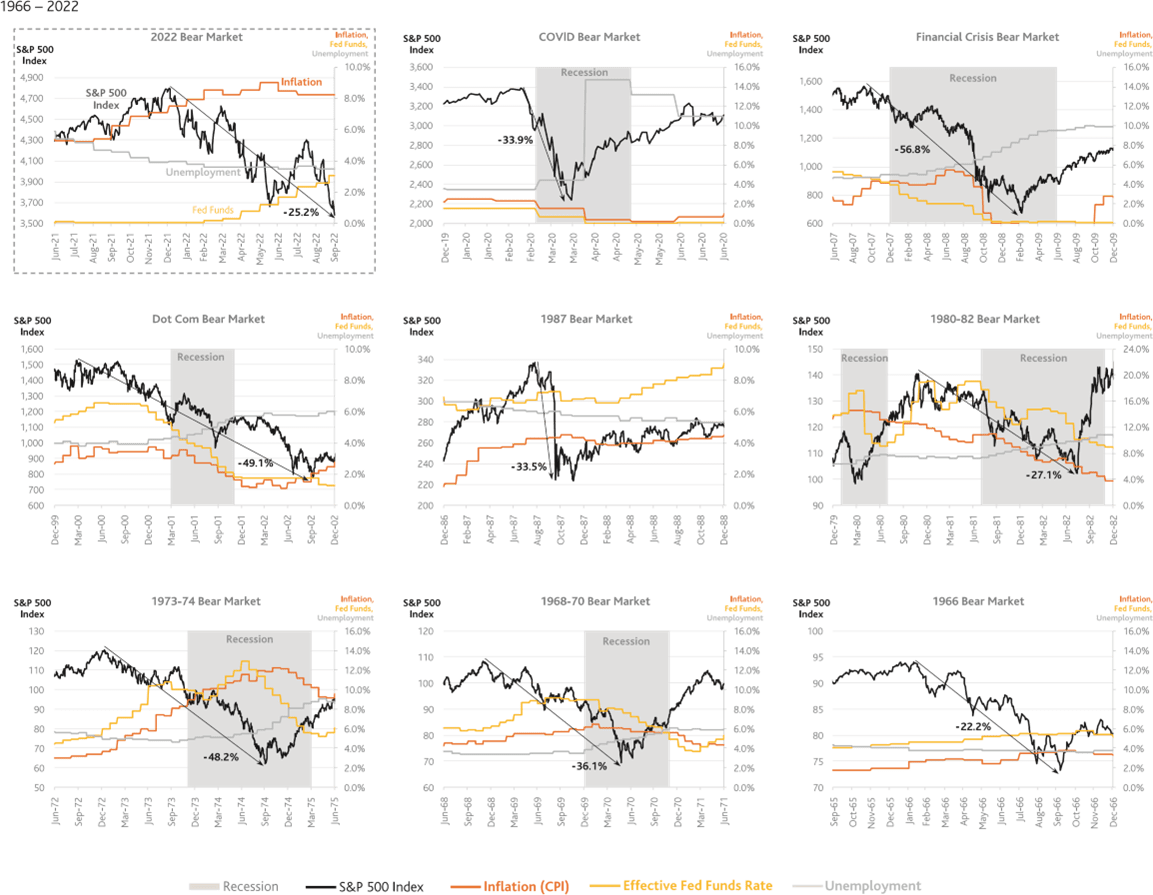
|
Past performance is not indicative of future results. The index is unmanaged. Index performance is not Fund performance; one cannot invest directly into an index. |
Over the past few months, a number of analysts and commentators have drawn analogies between today’s economic environment and that of the 1970s. Yet, the early and mid-1970s were characterized by a series of sequential tumultuous events which don’t have much in common to the drivers of the current bear market.
The gold standard was abandoned in 1971, resulting in a weaker dollar (today the USD is at its strongest in decades); there were country-wide wage and price freezes (1971 and 1973); a war broke out in the Middle East (1973); and OPEC imposed an oil embargo (1973), resulting in four times higher prices at a time when the U.S. was a heavy net importer of oil.
And then there was the war in Vietnam, both the end (1973-75) and its aftermath, and the Watergate scandal (1972-74), followed by President Nixon’s resignation (1974). And yet, toward the end of 1974, without fanfare or any signal, stocks started climbing back up, giving the start to a six-year bull market.
It is too early to tell whether we are currently in a recessionary bear market. We are not economists, but we see positive economic data which does not suggest that the economy is contracting: the unemployment rate has remained low and steady, and real consumer spending and industrial activity have increased.
While real GDP growth has been negative in the past two quarters (but positive in nominal terms), personal consumption, the largest GDP component (accounting for about two-thirds), grew in both periods. Although any of these indicators can change quickly from one month to the next, the current data does not seem to indicate that the U.S. is in recession.
A recent survey[1]by KPMG among 1,325 global CEOs also revealed encouraging sentiment, albeit with caution. While 86% of CEOs believe there will be a recession over the next year, “58% feel it will be mild and short and 76% have plans in place to deal with it.” Furthermore, the survey shows that the confidence in global economic growth over the next three years has increased from 60% in February to 71% in August.
In addition, company fundamentals are not currently at typical recessionary levels. According to S&P 500 Index data compiled by FactSet, as of 9/30/2022 revenue and earnings growth expectations for Q3 and Q4 remain positive[2], despite recent downward revisions. While all this data is reassuring, we put little importance on it, since our focus is the long term rather than the next few months.
The combination of solid earnings projections and lower stock prices has resulted in significant multiple compression. As of 9/30/22, the next 12 months price-to-earnings (“P/E”) ratio for the S&P 500 Index, a widely used valuation metric, stood at 15.2 times, more than two multiple points below its 25-year average, as the first chart on the right shows.
Growth company valuations have also seen steep declines relative to long-term averages. Valuations of small-cap growth companies compressed even more significantly, over one standard deviation below the historical average, to a level comparable to the trough of the Financial Crisis, as the second chart on the right shows.
Company Valuations Have Declined Below Long-Term Averages
Next 12 Months P/E Ratios (9/30/1997 – 9/30/2022)
Company Valuations Have Declined Below Long-Term Averages (Sources: FactSet Market Aggregates, The Bank of New York Mellon Corporation using I/B/E/S 1 Year Forecast EPS.)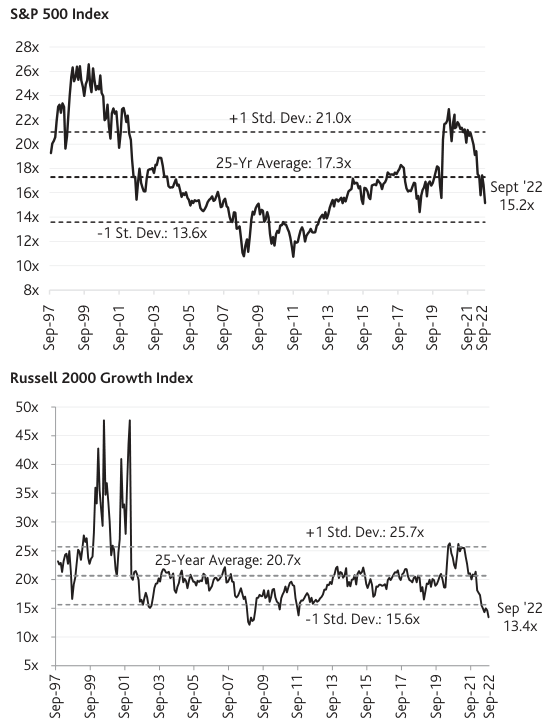
| Past performance is not indicative of future results. The indexes are unmanaged. Index performance is not Fund performance; one cannot invest directly into an index. |
Time In the Market > Timing the Market
Trying to time the market is a futile effort. But each bear market is unique, and we remain steadfast, following our long-term investment strategy. Patience and emotional control may be difficult for investors during bear markets but, in the past, they have paid off handsomely. Each market recovery emerges in its own time, and we do not think this time will be different.
Waiting for an attractive entry point may be entertaining, but it is hardly a wise choice when it comes to professional money management. For one, it is impossible to consistently pick the bottoms without an incredible amount of luck. And two, the longer the investment time horizon, the lower the significance of the entry point. The longer an investment is held, the more its value is driven by compound interest – the strongest force in investing.
Rather than waiting on the sidelines and timing the lows, investors can spread their purchases over time – an investment strategy known as cost averaging. With cost averaging, an investment would be less affected by the market level at any particular point in time, mitigating some of the downside risk.
Cost averaging can add meaningful value during the worst times in the market. The Financial Crisis period is one such example. As the chart on the left below shows, during this time the S&P 500 Index lost over half of its value from peak to trough, the biggest decline since the Great Depression.
In September 2008, about a year after the beginning of the bear market, the index was down about 25% – similar to what it has lost so far in 2022. At that point, an investor entering the market with a lump sum would have faced a material decline before stock prices began recovering. However, if the investor had spread his investment evenly over six or 12 months, he would have seen a much better portfolio performance.
The chart on the right shows that if a hypothetical $10,000 investment in a passive index fund mirroring the S&P 500 Index had been spread over a year (equal amounts invested at each month-end, per the dots on the left chart), it would have grown to nearly $14,000 (excluding dividends) by the end of the period, a 29% higher result compared to investing the entire amount on the first day.
Cost Averaging Can Be an Advantageous Investment Strategy During Down Markets
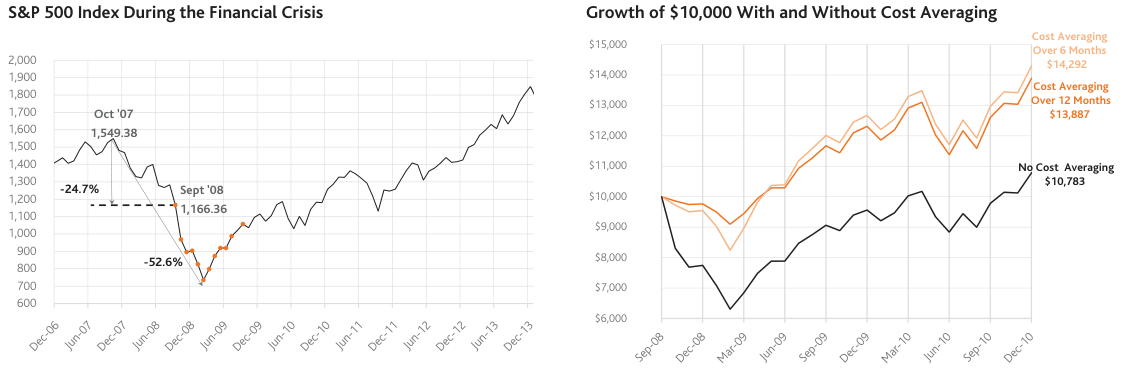
|
Sources: FactSet, Baron Capital. Past performance is not indicative of future results. The index is unmanaged. Index performance is not Fund performance; one cannot invest directly into an index. |
Price is Important, But Fundamentals Are Paramount
Of course, price levels and valuations are important and should be diligently considered before making an investment. Our research team maintains detailed valuation assessments for each investment in our portfolios, and for the companies on our radar. We weigh these against the intrinsic value, long-term growth prospects, management quality, and the durable competitive advantages of each business, among other factors. When we see our stock picks trading at an attractive price, typically we will take advantage of the opportunity.
Yet, our buying decisions are not driven by price alone, and we do not try to time stocks. Our purchases are typically distributed over time, and Baron’s portfolio managers will initiate a purchase only when they have conviction that a company is well positioned to grow at a high rate over a number of years. Growth, however, rarely occurs evenly over time. Higher-growth businesses, in particular, tend to reinvest heavily during their early growth stages in lieu of short-term profitability, which is often overlooked by investors with short investment time horizons.
Our long-term investment time horizon, on the other hand, allows us to buy stocks that may stagnate in the short term. Sometimes stocks may not move higher for months and even years after our purchase; and, on occasions, they may even decline. But we have often seen our stock picks reward us with exceptional returns later, more than compensating for their initial lag. Over the long term, duration of growth and margin of safety are much more important to us than entry price.
Our objective remains building attractively valued quality portfolios with significant long-term appreciation potential. While we hope that over time the market will recognize the qualities and value of our stock picks, we expect that, over shorter periods of time, the quality and potential of some of our investments may be overlooked by other investors.
Over the past year, many of our higher growth investments suffered significant price declines, which has impacted the performance of our Funds. In our view, much of the declines have been driven by deteriorating investor sentiment rather than fundamental weakening of the businesses. In fact, a number of companies we have invested in are seeing improving business metrics. Yet, their stock prices have continued falling to levels we believe are significantly below intrinsic value.
Three of our mutual funds – Baron Discovery Fund, Baron Opportunity Fund, and Baron Global Advantage Fund – have seen particularly steep declines in the stock prices of their holdings, and, accordingly, their net asset values (“NAVs”). As the charts below show, after a significant run-up, the Funds’ NAVs declined to pre-COVID levels, erasing all accumulated gains during the past two to three years.
Net Asset Values of Select Baron Funds
Net Asset Values of Select Baron Funds (Sources: FactSet, Baron Capital.)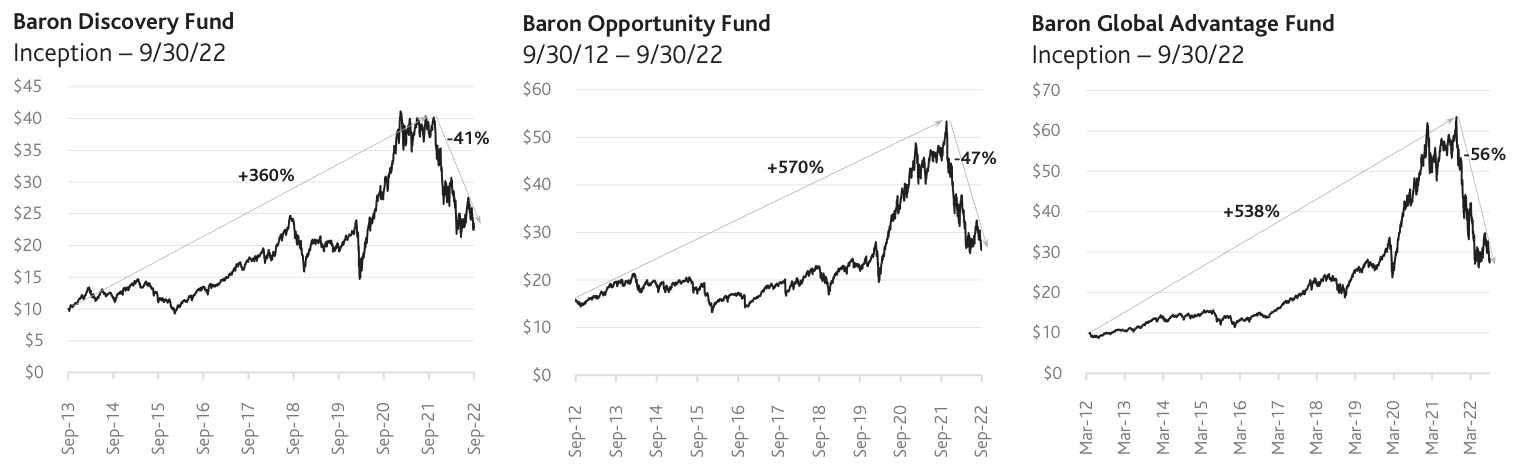
|
Past performance is not indicative of future results. The index is unmanaged. Index performance is not Fund performance; one cannot invest directly into an index. The performance in the charts above is for the Institutional Share Class of each Fund. As of 9/30/2022, for the Institutional Share Class, Baron Discovery Fund’s 1-year, 5-year, and since inception (9/30/2013) annualized returns are (37.29)%, 8.28%, and 11.68%, respectively. Annual expense ratio for the Institutional Share Class as of September 30, 2021, was 1.05%. As of 9/30/2022, for the Institutional Share Class, Baron Opportunity Fund’s 1-, 5-, and 10-year annualized returns are (38.23)%, 15.54%, and 13.52%, respectively. Annual expense ratio for the Institutional Share Class as of September 30, 2021, was 1.05%. As of 9/30/2022, for the Institutional Share Class, Baron Global Advantage Fund’s 1-, 5-, and 10-year annualized returns are (48.65)%, 8.19%, and 11.06%, respectively. Annual expense ratio for the Institutional Share Class as of December 31, 2021, was 0.90%. |
One common characteristic of these Funds is that they tend to invest in higher-growth companies and have significant exposures to technology stocks. Technology stocks were among the biggest beneficiaries of the COVID crisis, but this year they have been among the most punished.
In our view, the pandemic permanently accelerated technology adoption and digitization across all industries, expanding the growth prospects and opportunities for the majority of the technology-driven companies held by the three Funds. Two-and-a-half years after the onset of the pandemic, these prospects are even stronger; yet, they have been fully discounted by the stock market after this year’s drop in prices.
As the table on the next page shows, the Street-estimated earnings per share of each of the three Funds are currently projected to grow at a faster rate than their pre-pandemic estimates and their five-year average levels, projected revenue growth remains very strong, gross margins are high and have expanded, debt levels have remained low, and valuations have become more attractive.
In short, the portfolios’ fundamentals have mostly improved, on an absolute and relative basis, but they are trading at pre-pandemic prices. Our view is that the Street estimates in the table are understating the long-term growth prospects that our research team is estimating, which would make the Funds even more attractively priced at the current NAV prices.
The Baron Funds Offer Solid Growth at Attractive Prices
Select Fundamental Metrics of Baron Discovery Fund, Baron Opportunity Fund, and Baron Global Advantage Fund as of 9/30/22
Select Fundamental Metrics of Baron Discovery Fund, Baron Opportunity Fund, and Baron Global Advantage Fund (Sources: FactSet, Baron Capital.)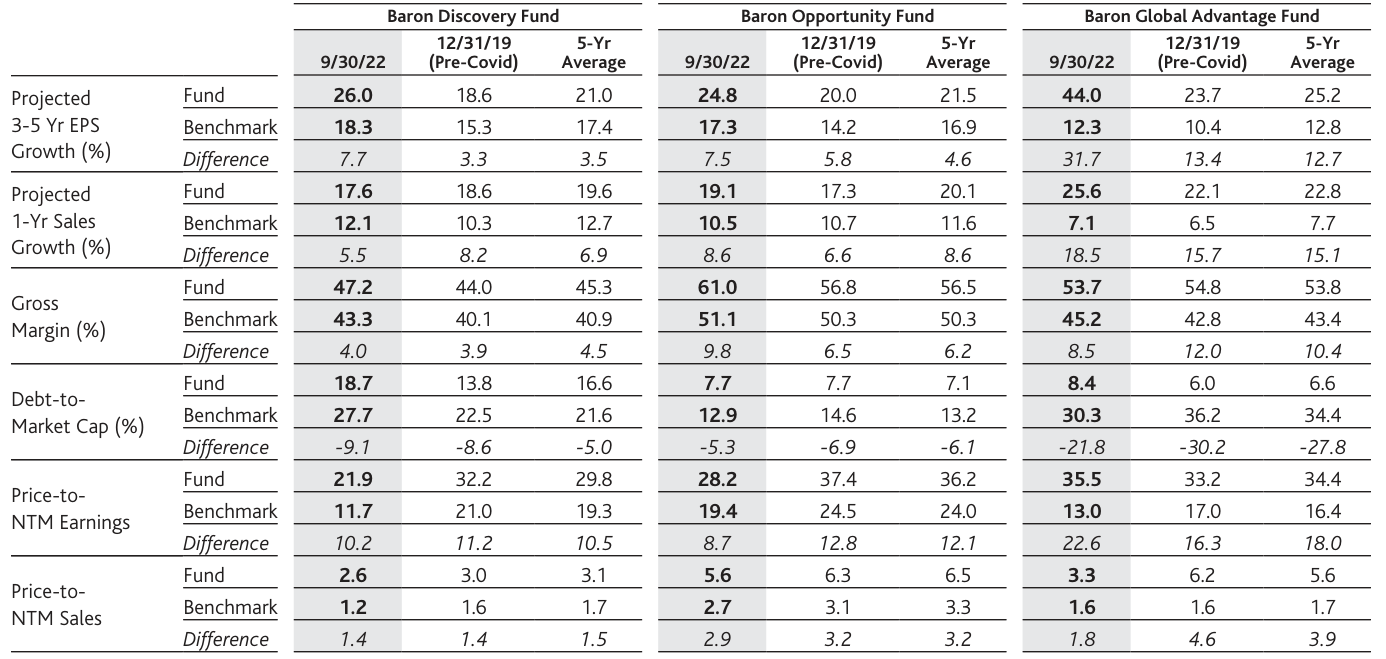
|
Notes: The primary benchmark of Baron Discovery Fund is the Russell 2000 Growth Index, the primary benchmark of Baron Opportunity Fund is the Russell 3000 Growth Index, and the primary benchmark of Baron Global Advantage Fund is the MSCI ACWI Index. NTM stands for next twelve months. Past performance is not indicative of future results. |
Despite the excessive market turbulence, Baron Discovery Fund, Baron Opportunity Fund, and Baron Global Advantage continue to be managed in the same way as always and to closely adhere to Baron’s long-term investment philosophy and principles. If anything has changed this year, it is the quality of the portfolios, which has improved.
We cannot provide any guarantees, but we strongly believe that the three Funds are well positioned to gain significantly once the market rebounds, offsetting the lackluster performance accumulated during the past year and generating above-average long-term returns for shareholders, just as they have done over the past five years and longer periods.
Over the past five years, Baron Discovery Fund, Baron Opportunity Fund, and Baron Global Advantage generated annualized excess returns versus their primary benchmarks of 4.68%, 3.97%, and 3.75%, respectively;* positive alpha; and their returns ranked highly among peers.
Navigating through market uncertainty and volatility is never straightforward or enjoyable. It requires great discipline to stay the course and confidence that there will be brighter days following the storms. If you are investing for the long term, keep in mind that markets move in cycles and there is no way to predict the downturns. In our view, the best strategy to follow is to focus on the big picture, stay invested, and take advantage of opportunities when they arise.
Sincerely,
Linda S. Martinson, Chairman, President, and COO
Footnotes[1] KPMG 2022 CEO Outlook, October 2022. [2] For Q3 ’22, S&P 500 Index companies are expected to report earnings growth of 2.9% and revenue growth of 8.7%. For Q4 ’22, the earnings and revenue growth projections are 4.0% and 6.2%, respectively. Source: FactSet Earnings Insight from 9/30/22. *As of 9/30/2022, 1-, 5-, and 10-year annualized returns of the Russell 2000 Growth Index are (29.27)%, 3.60%, and 8.81%, respectively; for the Russell 3000 Growth Index: (23.01)%, 11.57%, and 13.36%, respectively; and for the MSCI ACWI Index: (20.66)%, 4.44%, and 7.28%, respectively.
|
|
Investors should consider the investment objectives, risks, and charges and expenses of the investment carefully before investing. The prospectus and summary prospectuses contain this and other information about the Funds. You may obtain them from the Funds’ distributor, Baron Capital, Inc., by calling 1-800-99BARON or visiting www.BaronFunds.com. Please read them carefully before investing. The performance data quoted represents past performance. Past performance is no guarantee of future results. The investment return and principal value of an investment will fluctuate; an investor’s shares, when redeemed, may be worth more or less than their original cost. The Adviser reimburses certain Baron Fund expenses pursuant to a contract expiring on August 29, 2033, unless renewed for another 11-year term and the Fund’s transfer agency expenses may be reduced by expense offsets from an unaffiliated transfer agent, without which performance would have been lower. Current performance may be lower or higher than the performance data quoted. For performance information current to the most recent month end, visit www.BaronFunds.com or call 1-800-99BARON. Performance for the Institutional Shares prior to 5/29/2009 is based on the performance of the Retail Shares, which have a distribution fee. The Institutional Shares do not have a distribution fee. If the annual returns for the Institutional Shares prior to 5/29/2009 did not reflect this fee, the returns would be higher. Baron Discovery Fund’s 3- and 5-year and Baron Opportunity Fund’s 3-, 5- and 10-year historical performance were impacted by gains from IPOs and there is no guarantee that these results can be repeated or that the Funds’ level of participation in IPOs will be the same in the future. Risks: Growth stocks can react differently to issuer, political, market and economic developments than the market as a whole. Non-U.S. investments may involve additional risks to those inherent in U.S. investments, including exchange-rate fluctuations, political or economic instability, the imposition of exchange controls, expropriation, limited disclosure and illiquid markets, resulting in greater share price volatility. Securities of small and medium-sized companies may be thinly traded and more difficult to sell. Companies propelled by innovation, including technology advances and new business models, may present the risk of rapid change and product obsolescence, and their success may be difficult to predict for the long term. Ranking information provided is calculated for the Retail Share Class and is as of 9/30/2022. The number of share classes in each category may vary depending on the date that Baron downloaded information from Morningstar Direct. Morningstar calculates its category average performance and rankings using its Fractional Weighting methodology. Morningstar rankings are based on total returns and do not include sales charges. Total returns account for management, administrative, and 12b-1 fees and other costs automatically deducted from fund assets. The Morningstar Small Growth Category consisted of 617 and 535 share classes for the 1- and 5-year time periods. Morningstar ranked Baron Discovery Fund in the 82nd, 29th, and 5th percentiles for the 1-, 5-year, and since inception periods, respectively. The Fund launched 9/30/2013, and the category consisted of 426 share classes. The Morningstar Large Growth Category consisted of 1,252, 1,060, and 790 share classes for the 1-, 5-, and 10-year periods. Morningstar ranked Baron Opportunity Fund in the 91st, 1st, 13th, and 6th percentiles for the 1-, 5-, 10-year, and since inception periods, respectively. The Fund launched 2/29/2000, and the category consisted of 263 share classes. The Morningstar Global Large-Stock Growth Category consisted of 367, 272, 179, and 162 share classes for the 1-, 5-, 10-year, and since inception (4/30/2012) periods. Morningstar ranked Baron Global Advantage Fund in the 96th, 10th, 9th, and 10th percentiles, respectively. The discussion of market trends is not intended as advice to any person regarding the advisability of investing in any particular security. The views expressed in this document reflect those of the respective writer. Some of our comments are based on management expectations and are considered “forward-looking statements.” Actual future results, however, may prove to be different from our expectations. Our views are a reflection of our best judgment at the time and are subject to change at any time based on market and other conditions and Baron has no obligation to update them. The S&P 500 Index measures the performance of 500 widely held large-cap U.S. companies. The Nasdaq Composite Index is the market capitalization- weighted index of approximately 3,000 common equities listed on the Nasdaq stock exchange. Dow Jones Industrial Average is a price-weighted measure of 30 U.S. blue-chip companies. It covers all industries with the exception of Transportation and Utilities. The total return version of the index is calculated with gross dividends reinvested. The Russell 2000® Growth Index measures the performance of small-sized U.S. companies that are classified as growth. The Russell 3000® Growth Index measures the performance of the broad growth segment of the U.S. equity universe comprised of the largest 3000 U.S. companies representing approximately 98% of the investable U.S. equity market. All rights in the FTSE Russell Index (the “Index”) vest in the relevant LSE Group company which owns the Index. Russell® is a trade mark of the relevant LSE Group company and is used by any other LSE Group company under license. Neither LSE Group nor its licensors accept any liability for any errors or omissions in the indexes or data and no party may rely on any indexes or data contained in this communication. The MSCI EM (Emerging Markets) Index is designed to measure equity market performance of large and mid-cap securities across 24 Emerging Markets countries. The MSCI World ex USA Index is designed to measure large and mid cap representation across 22 of 23 Developed Markets (DM) countries excluding the United States. The MSCI ACWI Index measures the equity market performance of large and midcap securities across developed and emerging markets, including the United States. MSCI is the source and owner of the trademarks, service marks and copyrights related to the MSCI Indexes. The indexes and the Funds include reinvestment of dividends, net of withholding taxes, which positively impact the performance results. The indexes are unmanaged. Index performance is not Fund performance; one cannot invest directly into an index. Price/Earnings Ratio (next 12-months): is a valuation ratio of a company’s current share price compared to its mean forecasted 4 quarter sum earnings per share over the next twelve months. If a company’s EPS estimate is negative, it is excluded from the portfolio-level calculation. Standard Deviation (Std. Dev) measures the degree to which a fund’s performance has varied from its average performance over a particular time period. The greater the standard deviation, the greater a fund’s volatility (RISK). BAMCO, Inc. is an investment adviser registered with the U.S. Securities and Exchange Commission (SEC). Baron Capital, Inc. is a broker-dealer registered with the SEC and member of the Financial Industry Regulatory Authority, Inc. (FINRA). |
Original Post Published on September 30, 2022
Editor’s Note: The summary bullets for this article were chosen by Seeking Alpha editors.
Be the first to comment