

artran/iStock Editorial via Getty Images
I last wrote you about Bank of America (NYSE:BAC) stock a year ago in an article entitled, Bank Of America: A Look Behind The Headline Numbers.
This article is an update and re-assessment.
In July 2021, I considered BoA shares to be a HOLD due to valuation concerns and several soft fundamentals. The long-term thesis remained intact.
Since that article was published, the stock has fallen over 15 percent. BAC is down about 35 percent from its January 2022 peak. Shares now sits in the BUY zone I suggested last July. Personally, as outlined in my investment plan, I distributed BAC shares when the stock topped out at $45 and $50; then repurchased these shares at approximately $32.
Bank of America Long-Term Investment Thesis
-
Bank of America is a well-managed, well-capitalized, and shareholder-friendly financial institution.
-
The stock represents an investment in the overall growth and well-being of the United States economy.
-
Management focuses the bank upon responsible growth: seeking to grow slightly faster than GDP and aims for positive Operating Leverage. Positive Operating Leverage is defined as delta percentage revenue less delta percentage non-interest expense resulting in a positive number.
Reading Past The Headlines
Good investors read past the headlines. If everyone knows / expects good (or bad) news, it’s probably baked into the bid already.
For example, since the Fed began raising rates, buy-side analysts have been crowing about banks enjoying an improvement in Net Investment Income. It’s true. As rates rise, NII should improve. In late 2021 and early this year, many bank stocks rose when the Fed indicated it would raise interest rates.
However, a Fed that’s raising rates to stem inflation also includes a dose of recession fears. Typically, Fed tightening marks the end of the expansion phase of the economic business cycle and the beginning of a flat / contraction phase. Historically, banking stocks do not do well under these circumstances. Earnings, valuation multiples, or both may shrink.
The cycle appears no different.
As an investor, I seek to identify several non-headline metrics that may offer clues as to the direction of the business. In my July 2021 article, I highlighted
-
Loan volume
-
Net interest spread
-
Non-interest expense
-
Pre-tax, pre-provision income (PTPP)
-
Operating leverage
Let’s check up on the most recent results. Afterwards, we will look at BAC stock valuation.
Loan Volume
As of the end of 1Q2022, loans continued to show improvement, returning to pre-pandemic levels. Residential mortgages recovered, too.
Bank of America loan trends (Bank of America investor website)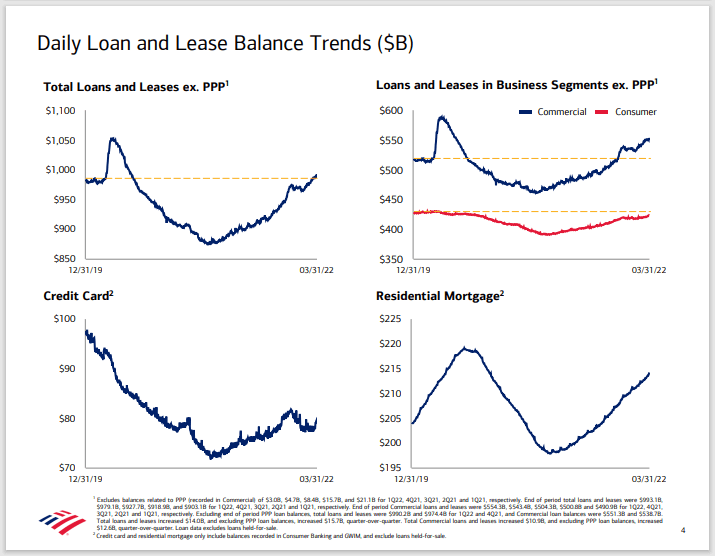
But what about the looming Fed-induced recession? Should not that cripple the lending business?
Fortunately, BoA management offered commentary on the subject during two recent investment conferences. At the June 13, 2022 Morgan Stanley U.S. Financials conference, CFO Alastair Borthwick had this to say:
So, across the board right now, we’re seeing reasonable good loans growth. We’ve talked about the fact that we feel like this will be an above average year for loans growth. Normally, we think about GDP plus because we feel like we should be able to take a little bit of market share each year. This year, obviously, GDP is a little higher. … we should see high single digits growth in loans. We’re still on track for that. We feel pretty good about this quarter, so it’s a good loans growth environment.
Commercial has been very strong, [and] continues to be that way.
These appear to be reasonably clear and positive remarks.
Net Interest Spread
A year ago, I pointed out BAC net interest spread (or net interest yield) had been drifting down. That’s changed.
Bank of America net interest trends (Bank of America investor website)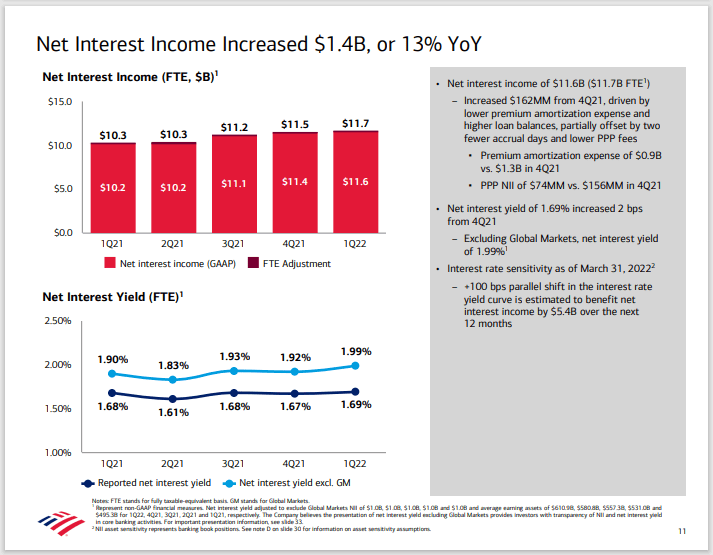
The spread bottomed about a year ago.
The current rate environment indicates significant incremental improvement.
Returning to the June 13, 2022 Morgan Stanley Financials conference:
Analyst
Okay. So, what you’re saying is Q-on-Q net interest income up 650-plus [million dollars] in 2Q and in 3Q at this stage you’re expecting an even higher step-up Q-on-Q?
CFO Alastair Borthwick
Yes.
And previously on June 1, 2022 at the Bernstein Strategic Decisions Conference, CEO Brian Moynihan offered these comments during an exchange with an analyst:
Analyst
And just to kind of level set on the net interest income expectations you had talked about, for the second quarter had been up at least 650 million — from first quarter to second. Any change in that outlook?
CEO Brian Moynihan
Still feel good about that. So up 650 first quarter to second quarter per quarter, and that’ll produce almost 2 billion in lift from second quarter last year to the second quarter this year…
And again, the rate effect is just coming through.
Indeed, Bank of America is more rate-sensitive than some peers. This bodes well for the future. While the concept that higher Fed rates are good for banks was baked into stock prices months ago, BoA investors received recent confirmation and solid forecasts from the CEO and CFO.
Non Interest Expense
Non-interest expense management has been one of my few recent disappointments with BoA. In 2021, management missed guidance on this item, despite revising guidance at midyear. One can make the old “yeah-but” arguments for certain expenses; however, in most cases management should be in front of most exceptional items.
Putting that aside, here’s what CEO Brian Moynihan offered for 2022 at the Bernstein conference:
And that means we’ve been able to bring the cost structure company [in] round numbers … to as low as 53 billion on a core operating basis. It’s back up now just because of inflation and market levels and compensation, but we think it will be flat this year to last year meaning 2022 to 2021.
Total 2021 non-interest expense was $59.7 billion. It’s midyear 2022, so his statement is pretty clear.
However, given the current inflationary environment, keeping expenses flat would be an achievement. How can the bank do it? Well, the CEO offered some remarks about that’s too.
Analyst
So just back to expenses. If you’re able to hold expenses, flattish this year versus ’21, that’s quite an impressive achievement given the inflationary environment. So maybe just talk about the mechanics of how you’re holding expenses flat, while also making these investments, how you doing both of those?
Brian Moynihan
It really comes down to what we’ve been doing over the last five years to continue to drive the digitization of franchise. So it compounds on itself…
Indeed, Bank of America has been spending ~$3.5 billion a year on digitization and cyber security. Perhaps now it’s payoff time? I’m optimistic.
If 2022 non-interest expenses are ~flat, I project Bank of America’s Efficiency Ratio (non-interest expense divided by total revenue) could finish the year at 63 percent. This would be an excellent performance. The bank’s Efficiency Ratio in 2021 and 2020 was 67 percent and 64 percent, respectively.
Pre-Tax Pre-Provision Income
Another metric I follow is PTPP income. The figure strips out some of the noise in a financial institution’s earnings. It also discounts share repurchases.
Back in 2Q2021, I noted PTPP income had fallen to $6.4 billion; rivaling the 2020 pandemic low. Since then, it’s recovered.
Bank of America financial highlights (Bank of America investor website)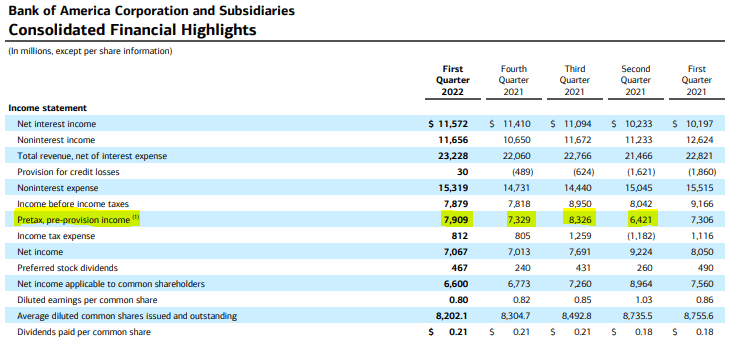
I expect continued PTPP income stability in 2022.
Operating Leverage
A combination of several of the preceding factors help to comprise Operating Leverage. I believe it’s a valid metric to gauge broad, overall performance.
Prior to the pandemic, management used to highlight positive Operating Leverage each quarter. However, after pandemic-driven economic dislocation sidetracked O.L. for several quarters, I made the following observation in my 2021 article:
3Q 2019 was the last time management published the [Operating Leverage] chart. After 18 consecutive quarters of positive operating leverage, the string was broken. The metric went negative in 3Q 2019 and hasn’t gone green since then. Management stopped publishing it.
Looking back through past earnings reports, full-year operating leverage went negative in 2019 through 2021.
More recently, times have changed. Despite remaining negative for FY 2021, operating leverage turned green in the second half of the year. The trend continued in 1Q2022, and I expect these results to be extended as the year progresses. Holding down expenses will be a key factor.
A Note to Readers!
The foregoing handful of metrics reflect what I believe are relevant to help get behind the headline numbers. These may augment understanding banks in general, and Bank of America in particular. The selected metrics are not meant to be exhaustive, comprehensive, or exclusive. Nonetheless, I believe these represent a good starting point for current or prospective BAC investors to do their own due diligence work.
Fair Value Estimates
I contend good stock investing requires two essential components: 1) understanding the fundamentals and 2) performing a Fair Value Estimate exercise to determine if the stock is cheap or dear. I believe generating consistent alpha requires investors to uncover great businesses…then wait patiently until Mr. Market offers to sell the stock at a significant discount.
Last year, BAC did not appear cheap despite several soft fundamentals. At the time, my Fair Value Estimate was about $40 a share.
For most stocks, my FVEs look out about a year to 18 months and are based upon various valuation metrics for different sectors, industries, and companies.
I tend to discount analysts offering out year price forecasts. With the exception of a few stalwart stocks, the Street has a relatively unreliable record when attempting to project earnings and cash flows more than two years out. I prefer to update my Fair Value Estimates quarterly using fresh information.
As outlined in my July 2021 article, I typically distribute shares when I believe a stock becomes overvalued; then accumulate shares when trading sufficiently below my FVE. Before accumulating a stock, I like to seek ~20 percent margin of safety.
Off my $40 FVE, Bank of America stock recently fell to the $31 to $32 mark, so it was time for me to do some buying.
A Refreshed BAC Fair Value
Given the benefit of another year of earnings and 2022 forecasts, my current BAC stock FVE is $45.
I arrived at this figure by concurring with the current 2022 Street consensus EPS estimates and applying the seven-year, trimmed average 13.8x multiple. The following FAST Graph illustrates the concept.
BAC stock 7-year FAST graph (FASTGraphs.com)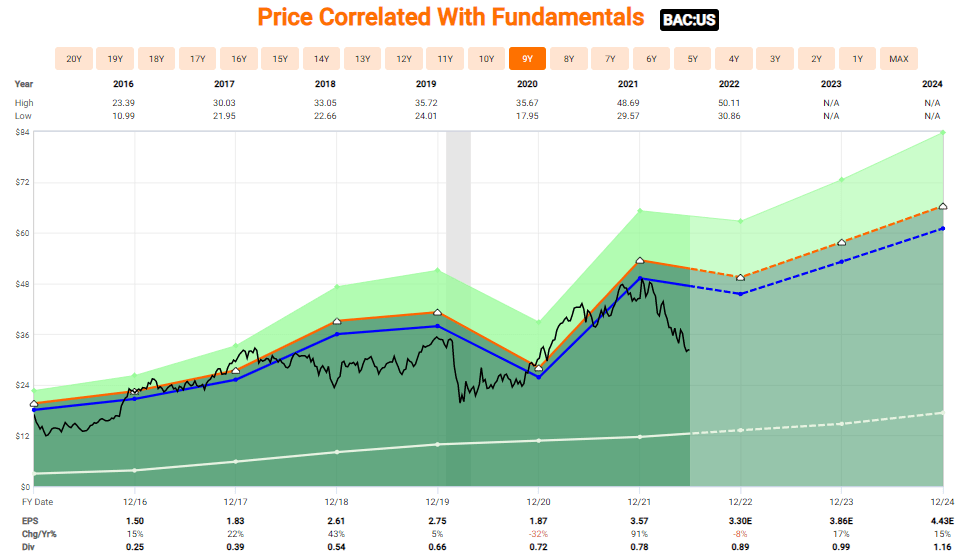
My FVE may be tempered by considering the most recent book value and applying a 1.25x multiplier. The 1.25x multiplier is the average Bank of America post-Great Recession P/B multiple. The arithmetic indicates a $37 stock. However, I’d like to see the 2Q results before considering revisions.
In addition, my FVE bias is tracking higher given the Street tends to look out to 2023 after midyear earnings. Current BoA EPS estimates call for a 2023 earnings rebound.
I also use another bank stock valuation methodology utilizing rates, beta, TBV, and ROTCE that indicates BAC stock is worth ~$40.
Investors should be cheered by the recent dividend and stock repurchase communications.
Return of Capital News
In a recent announcement, Bank of America plans to increase its quarterly common stock dividend by $0.01 to $0.22 per share. That’s about a 5 percent bump. In October 2021, BAC had renewed its $25B common stock purchase plan with $17B remaining as of March 31, 2022. In the first quarter of this year, average diluted shares outstanding fell by 6.2 percent versus the year before.
Bank of America passed the Fed’s annual stress test.
Conclusion
About a year ago, BAC appeared to be trading near Fair Value while exhibiting a several soft fundamentals. The backdrop suggested it was not the best time to initiate or grow a position. It appeared better to sell into stretched valuations.
Currently, despite nagging recession fears, I am more positive on the long-term prognosis for the shares. This is in large measure due to the stock having fallen significantly below my FVE.
Bank of America’s stock price revolves around a 13.5x to 14x P/E ratio. A recent bid indicates just a 9x multiple. This provides a margin of safety even if 2023 EPS eases in conjunction with a garden-variety recession. Meanwhile, for the time being, certain key fundamentals have stabilized or trended positive since last year. It is also worth noting that Mr. Market tends to look out 9 months to a year.
Risks to the thesis and FVE include management execution risk, the economy falling into a deep recession, and / or a corresponding severe bear market. At this juncture, I believe a garden-variety recession is possible but find systemic financial collapse (ala 2008-09) unlikely. Many stocks, including BAC, are already trading in bear territory and are mired in low valuations.
Thank you for reading and I hope to write you again soon. I look forward to your comments.
Please do your own careful due diligence before making any investment decision. This article is not a recommendation to buy or sell any stock. Good luck with all your 2022 investments.
Be the first to comment