

Nadya So
Note: This article focuses primarily on the beverage packaging segments of Ball Corporation.
Background
Since the beginning of the year, Ball Corporation’s (NYSE:BALL) stock price has declined significantly.
Seeking Alpha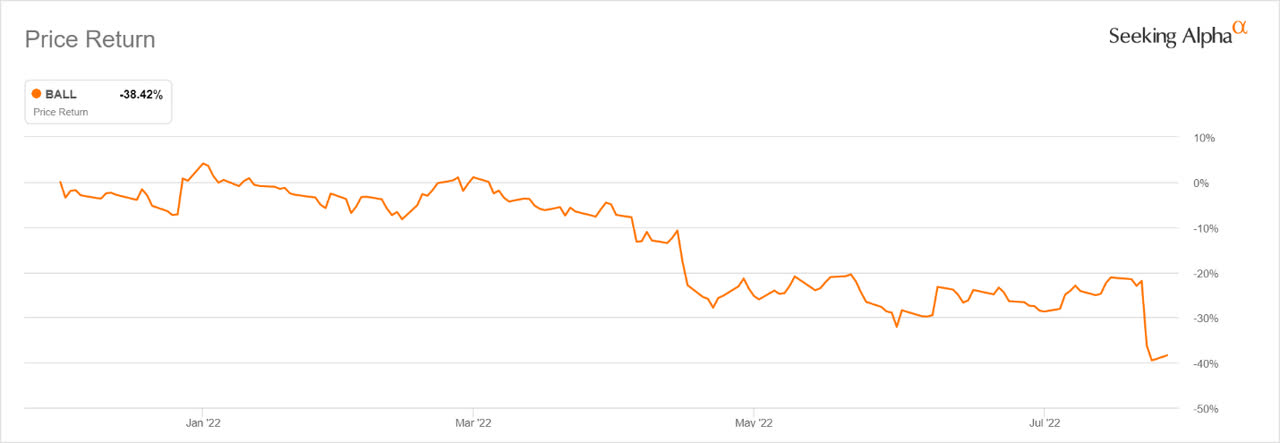
As a result of this drop, the enterprise value is near 3-year lows.
Seeking Alpha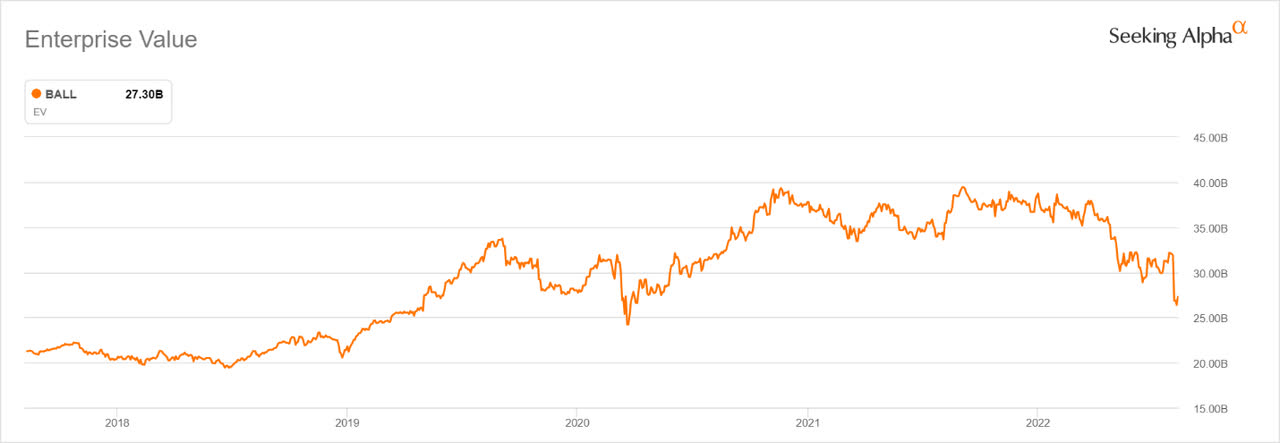
In the 2022 Q2 earnings press release, Ball reported a loss of $174M primarily due to a $435M impairment charge from its Russia operations. During the earnings call, the company also indicated that price increases, particularly in domestic and craft beer, were impacting the number of cans sold and announced that it was closing two US facilities and delaying the construction of another. Lastly, one of their customers in South America defaulted on a contract and operating earnings decreased 33% in that segment.
Thesis
Clearly, a number of negative factors are affecting the company in the short term. However, the stock declined 18.6% after earnings were released and then another 4.9% after analyst downgrades. This implies diminished long-term growth and profitability. Certainly, there is a risk of industry overcapacity and margin compression over the next year or two. However, the latest earnings announcement does not seem to negate the long-term trends that are driving increased production, revenue, and profitability.
Since 2016, overall beverage can production has increased in each of Ball’s major geographic markets. Ball has increased production in each market as well. In North America and Europe, Ball’s market share increased from 2016 until 2018 and then decreased slightly. In South America, Ball’s share has declined from 60% to ~50% since 2016. In summary, both Ball and the industry have grown steadily over the past five years.
Ball Corporation 2016-2021 10K and Poppertech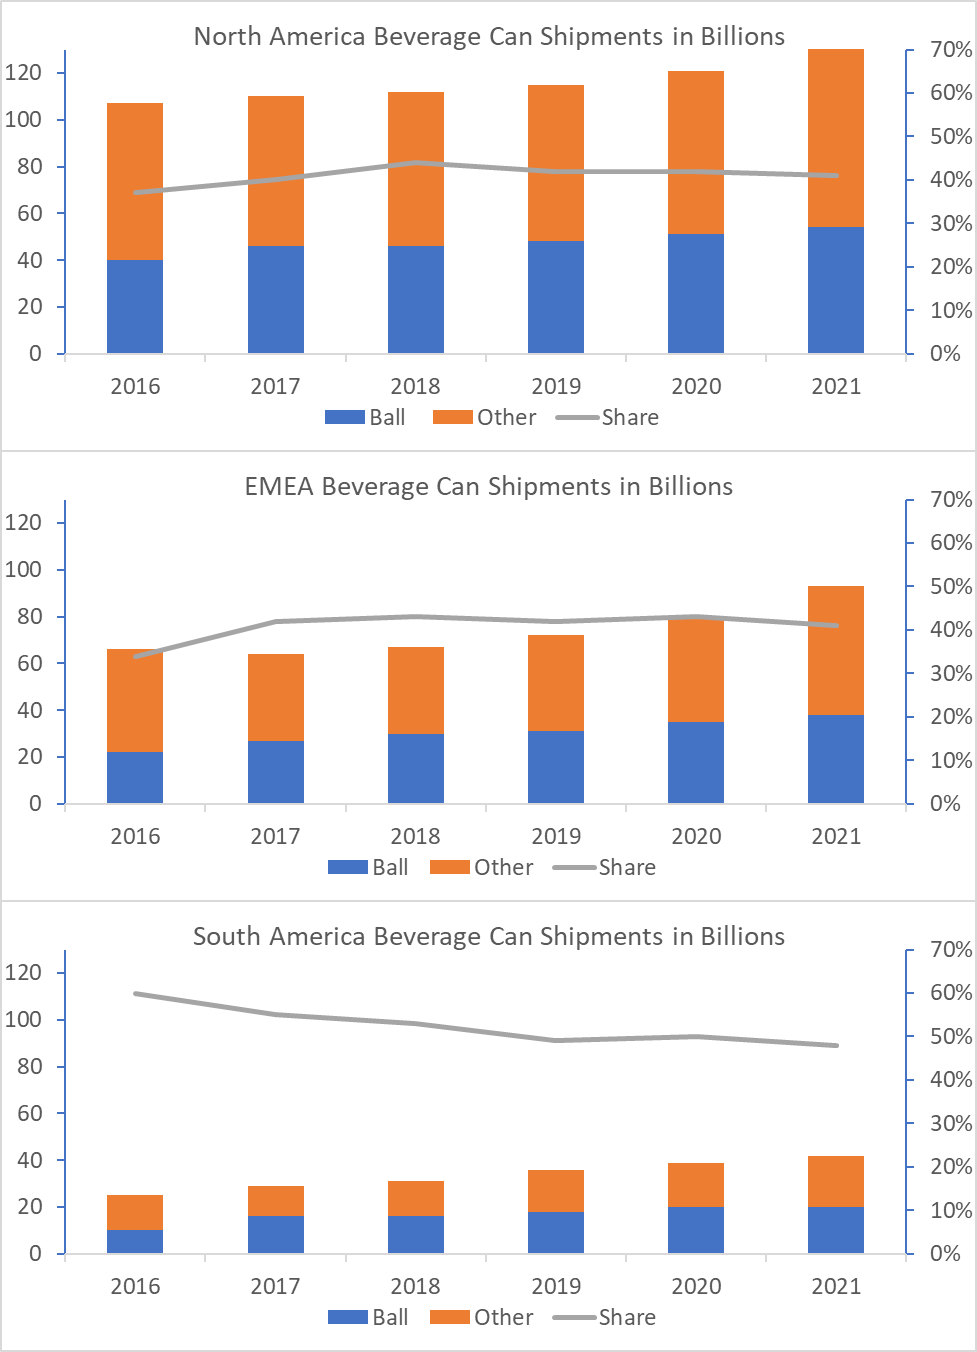
According to the book “Rust: the longest war” (Waldman, J. (2015). Rust: The longest war.), aluminum beverage can production is complex and sophisticated. For example, the machining tolerances on cutting the opening are on the order of 1 millionth of an inch. Beer, soda, and energy drinks have different chemistries and may require specific can liners for each product. In addition, the scale is massive: Ball produced over 100 billion cans last year.
In past decades, Ball’s customers were primarily large, multinational corporations such as US beer and soda companies whose cans were standardized. However, growth in such product categories as energy drinks, craft beer, and cocktails has diversified the customer base towards smaller companies. In addition, both energy drinks and craft beer have trended towards larger size cans with differentiating graphics.
At least three different ESG considerations affect aluminum can production: the decline of single-use plastics; a shift from glass bottles; and consumer preferences for can liners that do not contain BPA. The first two trends favor Ball; whereas, the last does not. According to the Ball website, the company does not intentionally use liners with BPA. However, they do not guarantee that the liners are BPA-free, and a quick google search displays multiple results of environmental organizations who criticize their products as a result.
Due to market and ESG trends, Ball specialty can volumes increased from 30% of global volumes in 2016 to 50% in 2021.
Ball Corporation 2015-2021 10K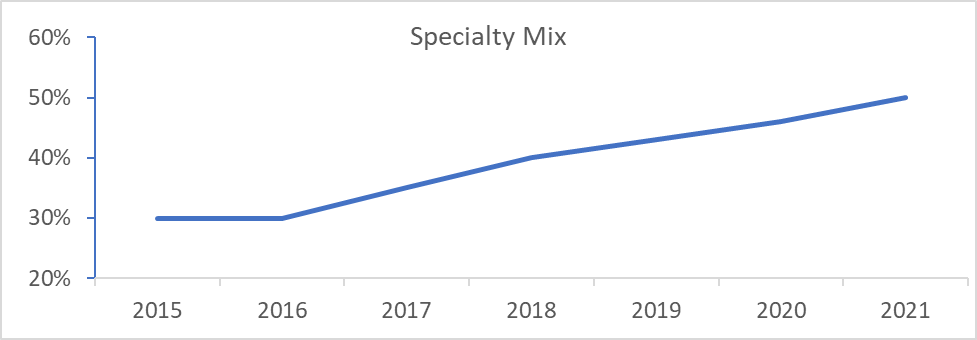
Key Inputs
The inputs to the valuation are: a base case, earnings growth, and multiple expansion. These parameters are estimated for five different scenarios: Minimum (0th percentile), Worst Case (10th percentile), Most Likely, Best Case (90th percentile), and Maximum (100th percentile). Historical data, current data, management estimates, and best guesses underlie the following assumptions:
Base Case
Projected cash returned to shareholders of $1 billion in 2021 divided by current market capitalization of $18.69B resulting in a return of 5.3%.
Earnings Growth
- Minimum: Last twelve months net income $750M, or 25% decrease from base case
- Worst Case: 2021 net income of $878M, or 12% decrease
- Most Likely: No change relative to base case
- Best Case: Lower end of management’s projected long-term growth rate: 10%
- Maximum: Upper end of management’s projected long-term growth rate: 15%
Multiple Expansion
- Minimum: P/E of 15, or 40% contraction
- Worst Case: 5-year low of 20, or 20% contraction
- Most Likely: Current P/E of 25
- Best Case: Last six months high of ~30, or 20% expansion
- Maximum: Near 2022 highs of 40, or 60% expansion
Seeking Alpha and Poppertech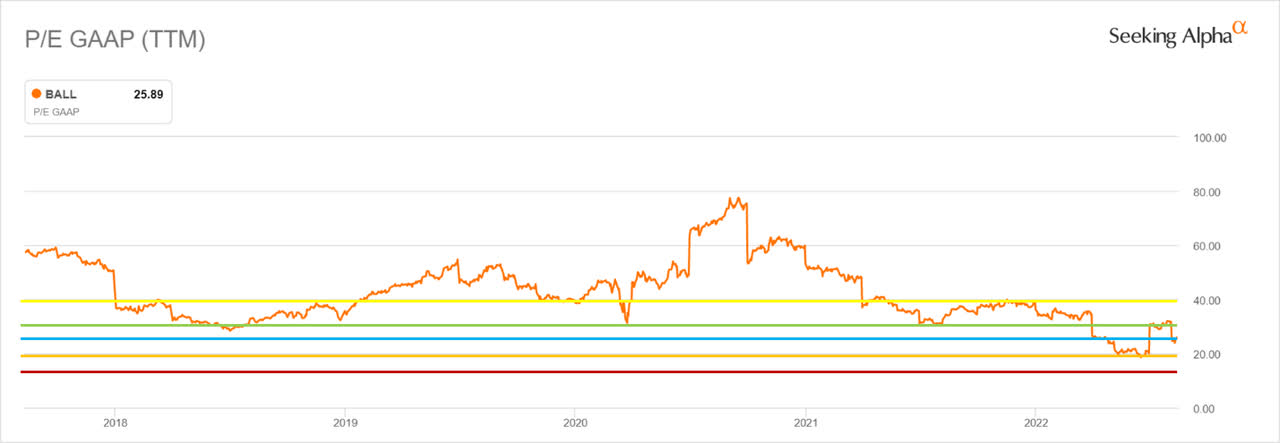
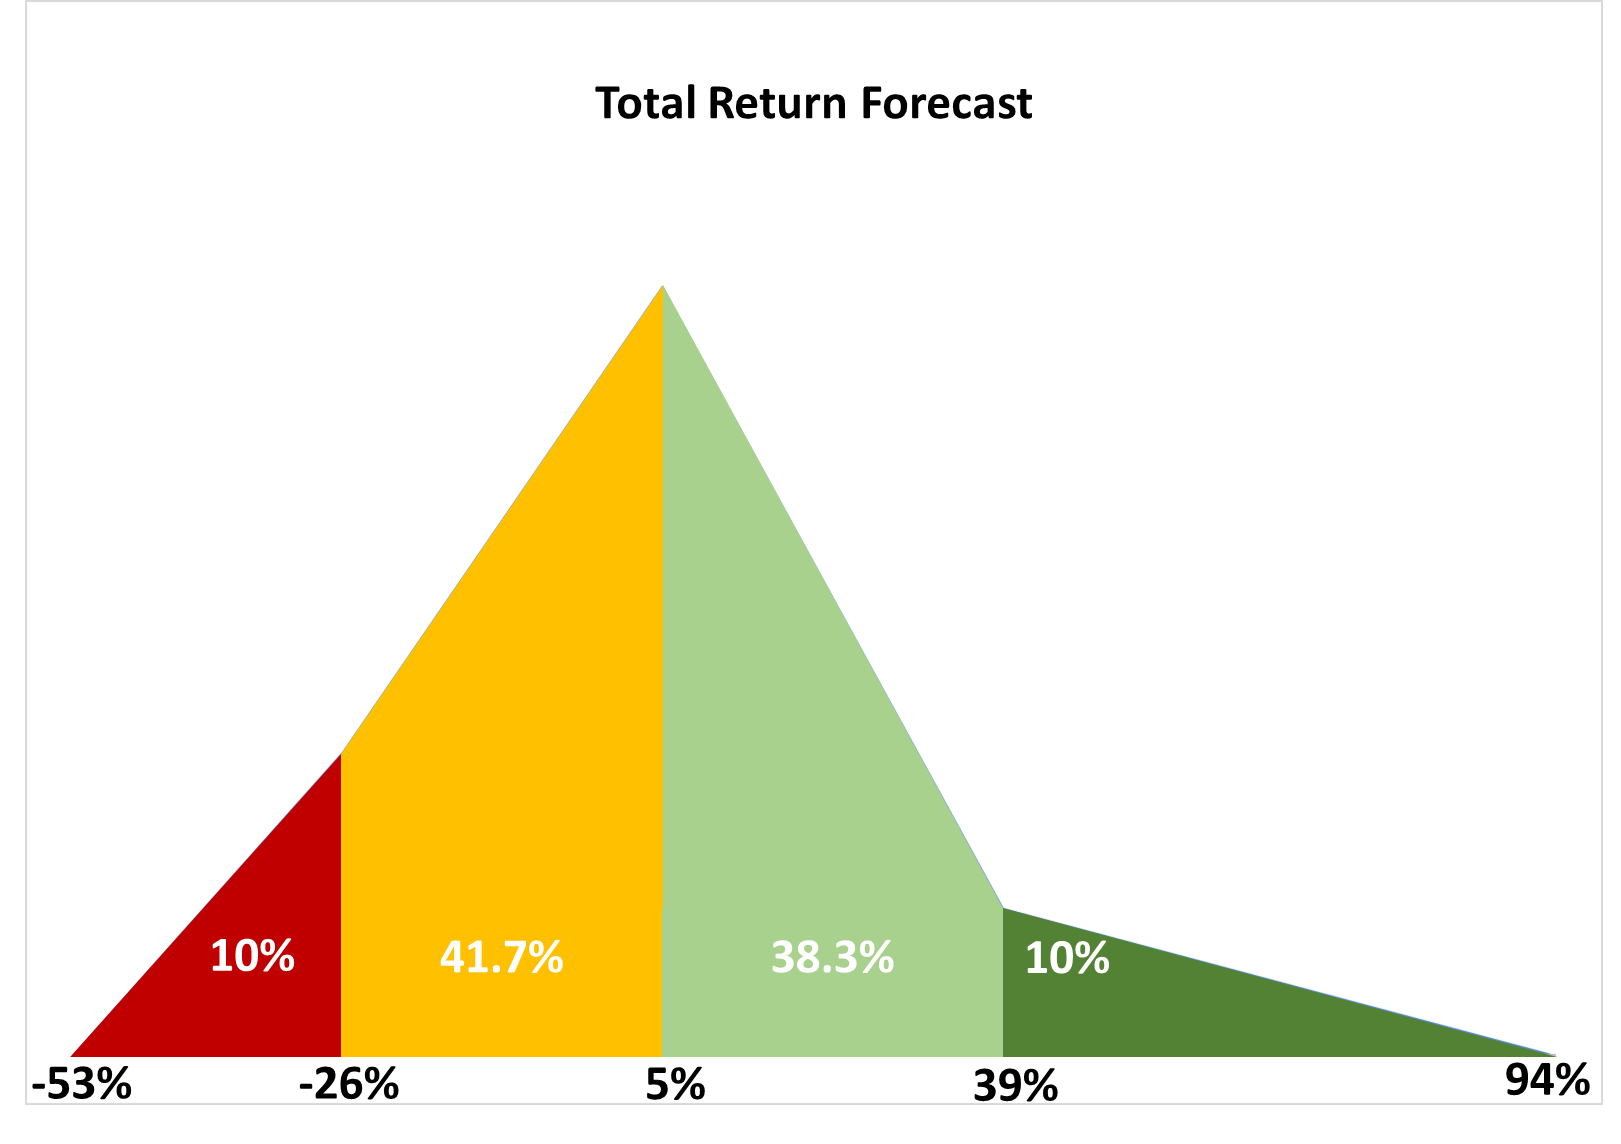
The combination of the three sets of inputs yields the following scenarios for forecast 1-year total return:
Poppertech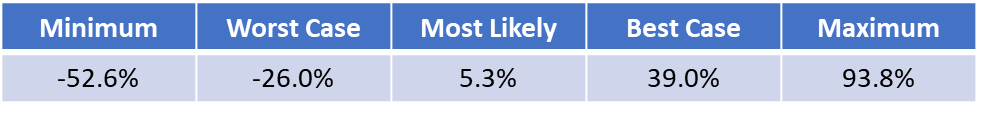
Forecast
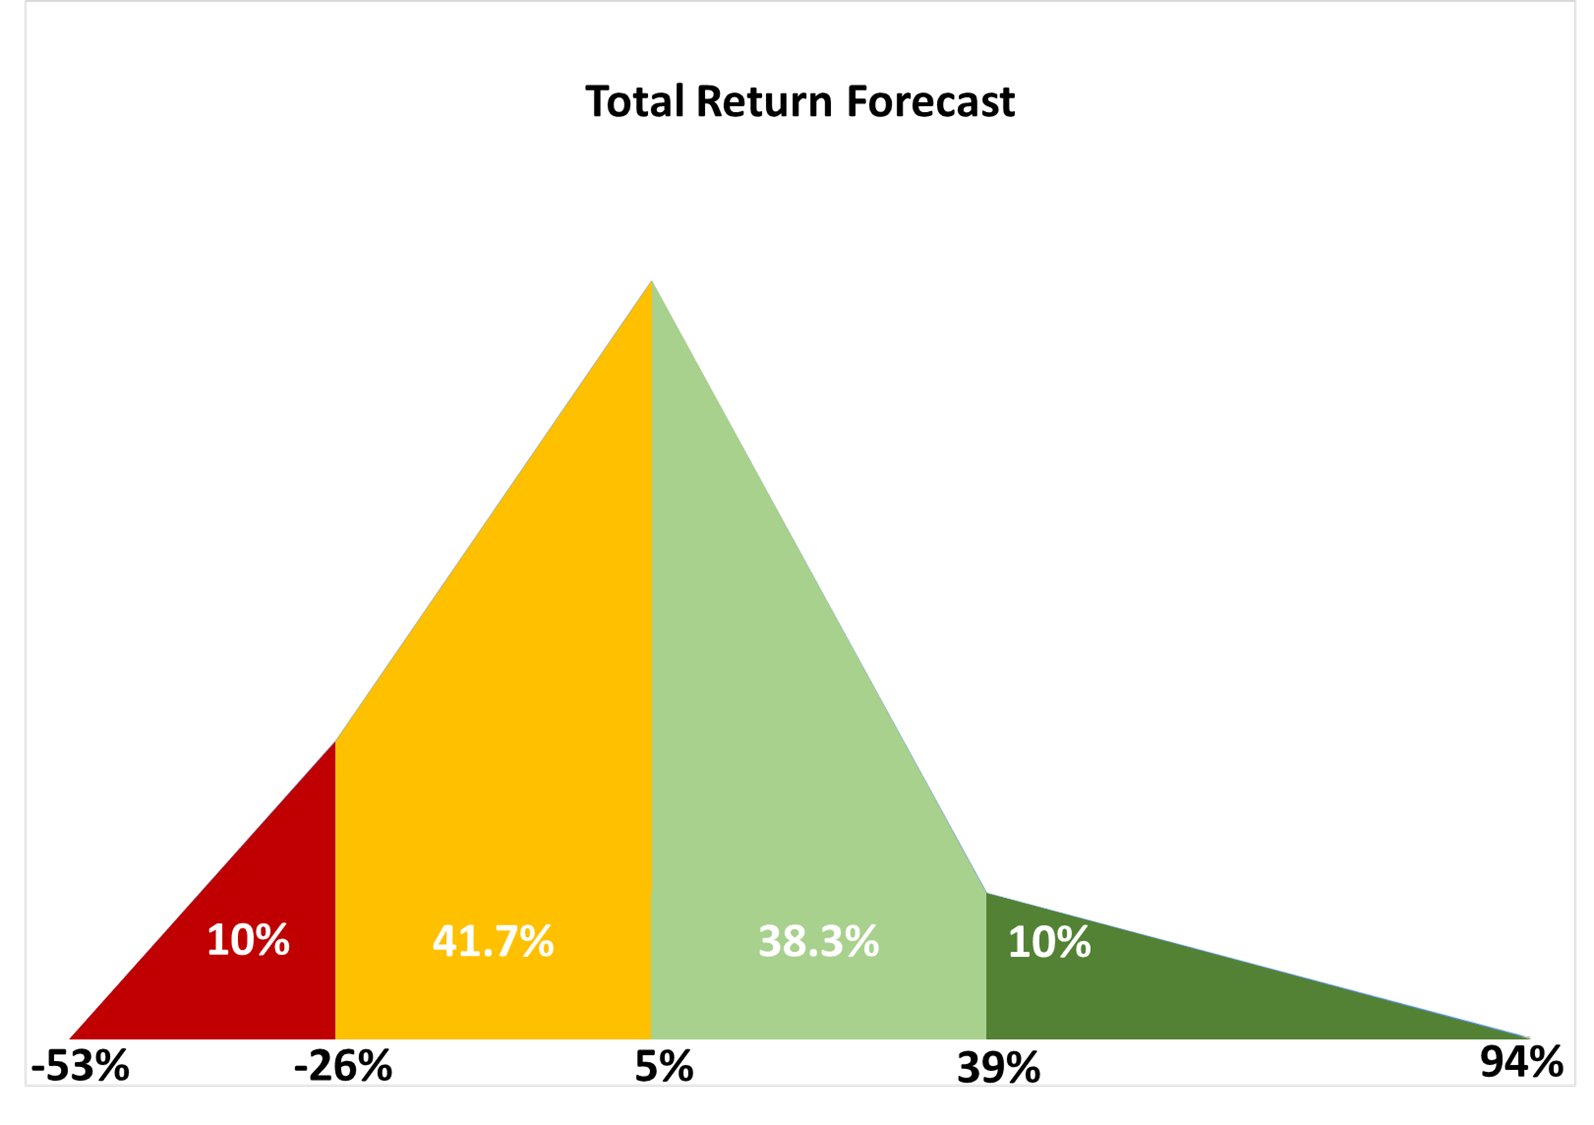
To create the forecast, the above scenarios are input into software that creates the graph below and associated statistics. The black values underneath the graph indicate the total return values as shown in the previous table of scenarios. The white percentage values overlaid on the graph correspond to the proportion of the total area under the curve within each colored region. This is the forecast probability of the total return falling within the associated range. For example, the light green region represents a 38.3% chance that total return is between 5% and 39% over the next year.
Based on the above forecast, the software performs a Monte Carlo analysis to calculate expected return and risk. The resulting statistics are shown below.
Poppertech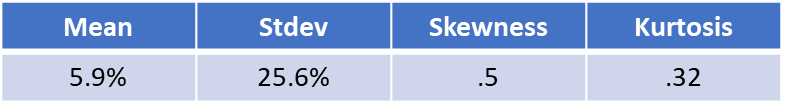
The expected return based on the above analysis is 5.9% and is ~3% higher than my expectations for the S&P 500. Forecast volatility of 25.6% is also higher than my expectations for the S&P 500. However, it is lower than 30%+ implied volatility of near-the-money, long-term BALL options. I suspect this volatility will decrease slightly as the stock price settles after the large recent decline. As might be expected from the short, left tail and the long, right tail in the graph, the forecast is positively skewed. Excess kurtosis is slightly positive and indicates about the same probability of extreme events as a normal distribution with the same mean and standard deviation.
Strategy
Although I expect BALL to outperform the market over the long term, the expected return of 5.9% is low relative to the risk, particularly over the next year or two. As a result, my rating is a Buy, but it is very close to a Hold. To mitigate the overall risk of my portfolio, I adjusted the position size to be 75% of a typical holding. If the maximum scenario occurs over the next year without a material change in the long-term prospects, then I would likely sell a least 50% of my position. On the other hand, if the minimum scenario were to occur, I anticipate doubling the size of my position.
Be the first to comment