

E_Cotner/iStock via Getty Images
Introduction
Baker Hughes (NASDAQ:BKR) and Halliburton (HAL) trade-off the 2nd and 3rd place finishes behind number 1 ranked Schlumberger (SLB) in the OFS sector. At present in terms of market capitalization, BKR is slightly ahead of HAL. I have generally recommended in the OFS space you should own SLB and HAL. Part of the reason for preferring HAL was its exposure to the North American fracking recovery. BKR sold off its fracking subsidiary – BJ Hughes – in a proposed merger with Halliburton in 2016. The merger fell apart thanks to the Justice Department inveighing against it, but what was done was done. BJ Hughes is now in the dustbin of history as well. A 100-year old name put to rest.
Baker Hughes price chart (Seeking Alpha)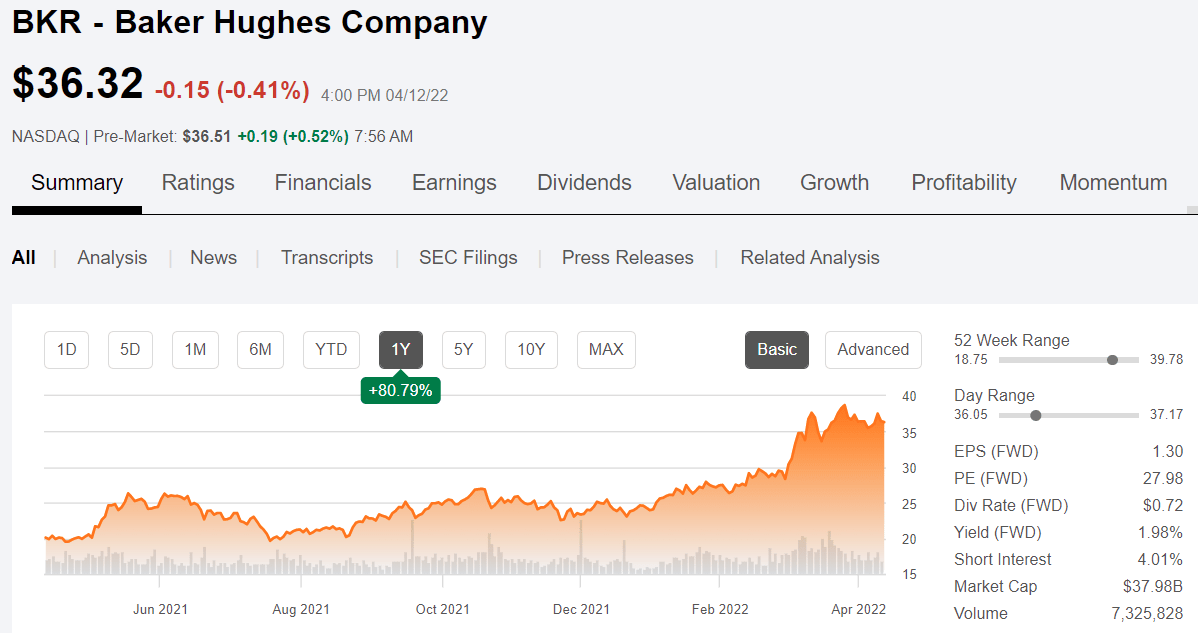
Both companies have recently returned to multi-year highs on the strength of rally in oil and gas. On a forward earnings multiple basis, BKR is 20% more expensive than HAL, so why should we consider them now?
The answer lies in BKR’s exposure to the burgeoning LNG trade and the multiple LNG FIDs expected to be funded around the world in the next few years. This isn’t new news. I have covered this aspect of the company in prior articles. What’s different now is the sharp focus of the energy market on LNG as a result of rising prices of gas internationally, and concerns about supply for the winter of 22/23.
Baker LNG page (Baker Hughes)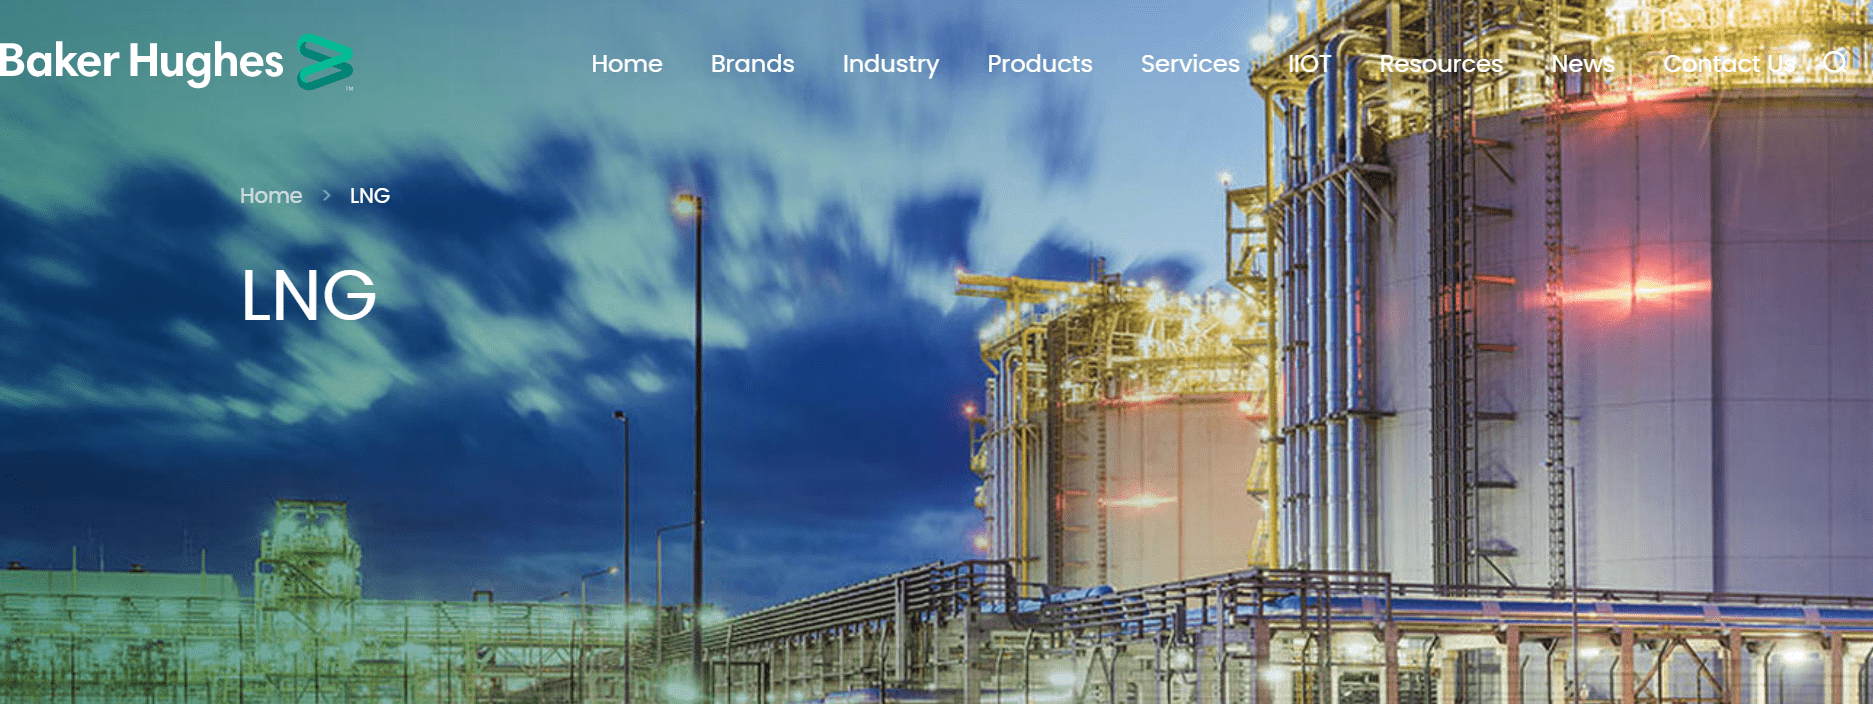
In this article, we will focus on what this LNG buildout might mean for BKR going forward.
The LNG thesis for BKR
The Shell LNG Outlook notes a gap between demand and supply beginning in the early 2020s and widening toward 2040 for as much as a one-third deficit to demand. (Follow link for graph). This is a profound gap between consumer demand and the industry’s ability to supply. A divergence now just getting underway and on an apparent very steep upward angle of attack wider. Baker Hughes’ product offerings fit very nicely into this gap and are a differentiator with the other two large service providers.
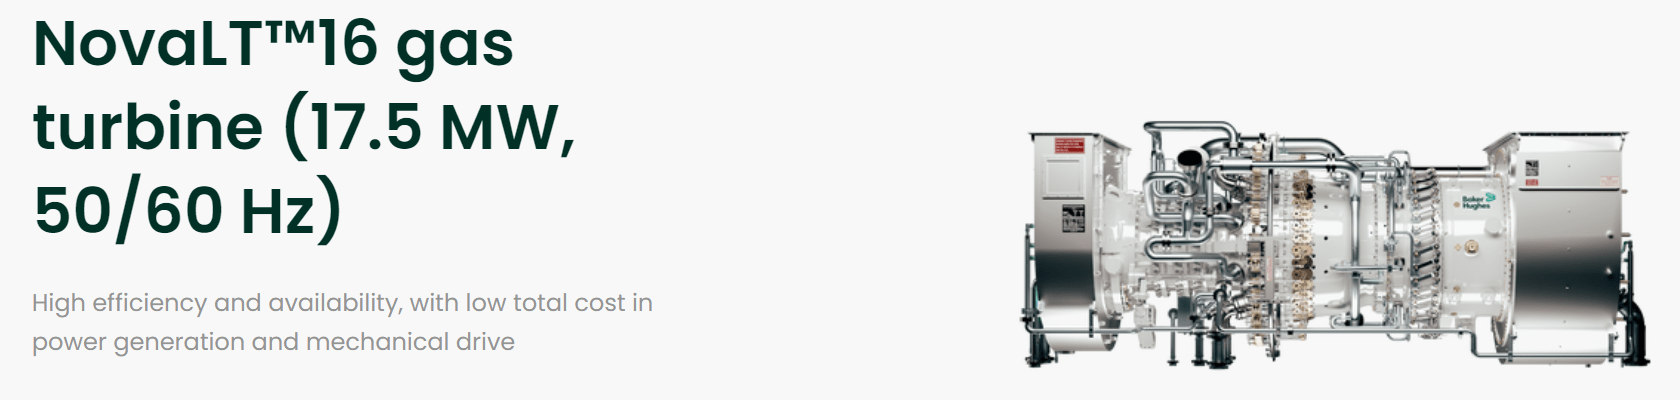
Basically, LNG plants are a story about compression, piping and storage. Baker is really good at two of these things, from the LM 9000 ultra high tech jet engines that resulted from the GE merger in 2018 to the internally developed NovaLT gas engines used on gas pipelines and frack pumps.
Baker Hughes LM9000 (Baker Hughes) BKR NovaLT gas engine (Baker Hughes)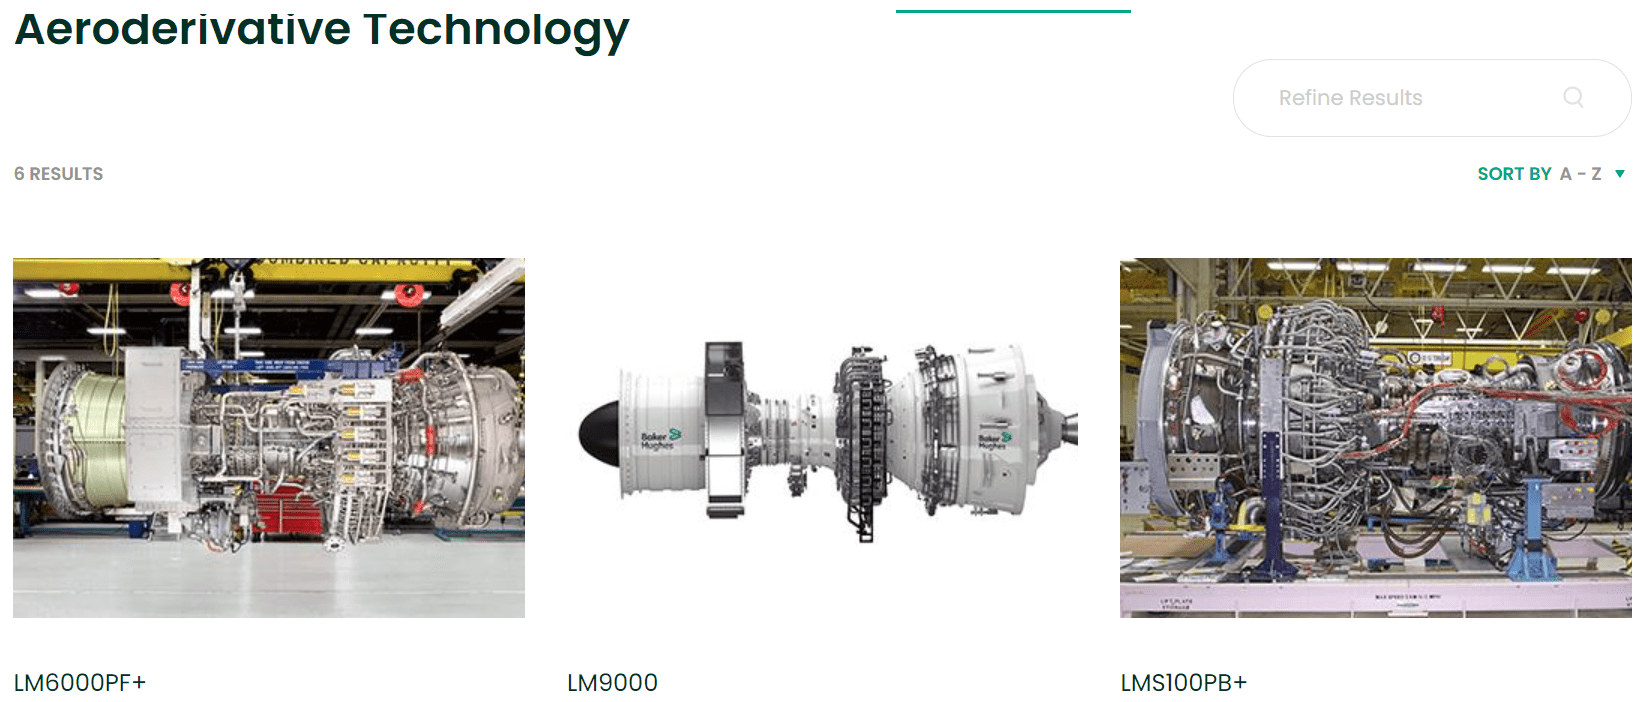
These products live within the Turbo-Process Solutions-TPS segment of the company, the scope of which is detailed below. TPS had a great quarter in Q-4, 2021, and CEO Simonelli was very optimistic about the expansion of the LNG growth cycle –
LNG activity played an important role in helping TPS book almost $7.7 billion in orders in 2021, which was just below the record levels achieved in 2019. Perhaps more importantly, we believe that the step-up in LNG order activity provides a solid indication that a new LNG cycle is beginning to take shape.
BKR TPS PSO (Baker Hughes)
So that is our growth thesis for BKR. Put aside the fact they have strong, but third place offerings in the broader upstream oil patch and the digital AI, the catalyst for Baker is LNG.
Why might LNG propel BKR earnings in the remainder of this decade
FIDs for new LNG plateaued in 2020 and there was some doubt early in the year about the strength of the gas market continuing to drive growth in this sector. It’s a little hard to remember now, but two years ago gas was under $2.00 mcf, and everything gas was at multi-year lows.
Those fears have been pretty well washed away as cracks continue to appear in the bets the world has made on so-called renewable energy. In the world in which we live today countries are bidding against each other for cargoes of LNG.
Reuters graph on Euro gas storage (Reuters)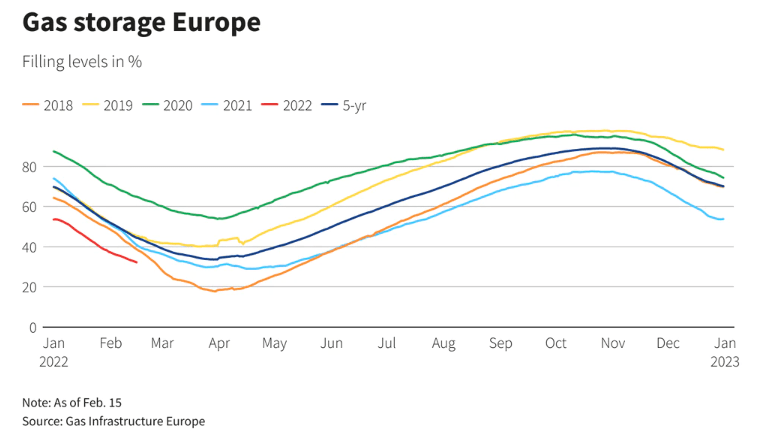
A British fantasy writer once penned an evocative line that pretty well sums up the predicament the Europeans have found themselves in at present. Sir Terry Pratchett is quoted by energy writer Irina Slav thusly –
“It takes a special kind of genius to devise an elaborate though simple trap, build it and then get caught in it, which is exactly what Europe did.”
Simonelli comments further on what he sees ahead in gas and LNG markets in the coming years-
We also expect continued momentum in the global gas markets in 2022 building on a strong 2021. A combination of demand and supply factors converged in 2021 pushing natural gas and LNG prices to record breaking levels in both Europe and in Asia. The gas price spikes also highlighted the fragility of the global energy system as the world transitions to net zero.
Looking ahead, we expect a number of additional LNG FIDs in 2022 and beyond, supported by the growing appetite for longer-term LNG purchase agreements. As we have previously mentioned, we see significant structural demand growth for LNG in the coming decades. Our positive long-term view is also supported by the recent improvements in policy sentiments in certain parts of the world towards natural gas’ role within the energy transition.
The essence of this trend for Baker is that they should be sold out to capacity for years to come. They have some unique advantages to other capital equipment suppliers. With their upstream offerings, they could even do field management as part of a total package.
A new structure to focus on CCUS and Asset Management
There is another nascent change occurring in the company that could well position BKR for above average growth in the coming years. It doesn’t take a huge leap of imagination to realize that much of this equipment can have a dual purpose as CCUS, clean hydrogen, and emissions control gain ground in the regulatory space. Driven by tax preferences for this sort of capital outlay, there is a fertile future for Baker’s TPS offerings. Toward that end BKR has reorganized these businesses under a new banner.
The Climate Technology Solutions Group or CTS will encompass CCUS, hydrogen, emissions management and clean and integrated power solutions. This new group paired with another reorganization, the Industrial Asset Management or IAM, will bring together key digital capabilities, software and hardware from across the company to help customers increase efficiencies, improve performance and reduce emissions for their energy and industrial assets. They will be under the same internal management as their offerings complement each other. Having this unity of purpose internally usually enables improved client focus which improves the service and helps to build the brand.
Q-4 and 2021
Orders for the quarter were $6.7 billion, up 24% sequentially driven by TPS, Digital Solutions and OFS, partially offset by a decrease in OFE. Year-over-year, orders were up 28% driven by increases in TPS, Digital Solutions and OFS, and a decrease in OFE.
Operating income for the quarter was $574 million. Adjusted operating income was $571 million. Adjusted operating income was up 42% sequentially and up 23% year-over-year. Their adjusted operating income rate for the quarter was 10.3%, up 240 basis points sequentially and up 190 basis points year-over-year. Adjusted EBITDA in the quarter was $844 million, up 27% sequentially and up 10% year-over-year. Adjusted EBITDA rate was 15.3%, up 130 basis points year-over-year.
Free cash flow in the quarter was $645 million. The sequential improvement was driven by higher adjusted EBITDA, strong cash collections and modestly higher proceeds from disposal of assets due to increased real estate sales. They also continued to execute on the $2 billion share repurchase program during the fourth quarter, repurchasing 13.2 million Baker Hughes Class A shares for $328 million at an average price just under $25 per share.
Orders for the full year were $21.7 billion, up 5% driven by TPS, Digital Solutions and OFE, partially offset by OFS. Total company book-to-bill was 1.1 for the year. Total year revenue of $20.5 billion was down 1% driven by declines in OFS and OFE, partially offset by increases in TPS and Digital Solutions.
Adjusted operating income of $1.6 billion was up 52% in the year with total company adjusted operating income margins improving 270 basis points mainly driven by productivity improvements in TPS and cost-out programs and productivity improvements in OFS. Adjusted EBITDA of $2.7 billion was up 14% in the year. Total company adjusted EBITDA rate improved 170 basis points in 2021. Corporate costs for the year were $429 million.
For the full year, they generated $1.8 billion of free cash flow.
Segment by segment
Oilfield Services. OFS revenue in the quarter was $2.6 billion, up 6% sequentially. International revenue was up 7% sequentially, led by increases in sub-Saharan Africa, the North Sea, Russia and Latin America. North America revenue increased 4% sequentially with similar growth in both the land and offshore markets. Over 55% of OFS revenues in North America were in their production-related businesses of chemicals and artificial lift in the fourth quarter.
Operating income in the quarter was $256 million, a 35% increase sequentially and a 210 basis point improvement in margin rate. The improvement in margin was driven by better operating productivity, pricing gains in certain product lines and favorable product mix. For the total year of 2021, OFS improved operating income margin rate by 320 basis points.
They expect to see continued growth in 2022 in international and North American activity offset by typical seasonal softness in the international markets. As a result, they expect first quarter revenue to decline modestly on a sequential basis, along with a modest decline in margin rates.
In the international market, they expect the continuation of a broad-based recovery, with growth in the low to mid-double digits. In North America, BKR expects a continuation of the ramp-up in activity levels and believe that the broader market could experience strong growth in the 25% to 30% range.
Oilfield Equipment. Orders in the quarter were $510 million, down 9% year-over-year. The reduction in orders was driven by FPS, as well as the removal of Subsea Drilling Systems from consolidated OFE operations as a result of the merger with MHWirth. These declines were partially offset by growth in services and flexibles.
Revenue was $619 million, down 13% year-over-year. The reduction in revenue was driven by the removal of SDS and lower volumes in SPS and SPC projects, partially offset by growth in services. Operating income was $23 million, a 1% improvement year-over-year. This was driven by higher volume in services and cost productivity, partially offset by lower volume in SPS and the removal of SDS. For the first quarter, they expect a double-digit sequential decline in revenue, driven primarily by seasonality and lower backlog.
For the full year 2022, they expect a modest recovery in offshore activity driven by higher oil prices and capital deployment into low cost basins and projects.
TPS. The team delivered another strong quarter with solid execution. Orders in the quarter were $3 billion, up 62% year-over-year. Equipment orders were up $1.1 billion year-over-year.
Orders this quarter were supported by an award to supply power generation for a major LNG project in North America, an order for the Pluto Train 2 LNG project, and an award for a large scale LNG project in the Eastern Hemisphere. Service orders in the quarter were up 7% year-over-year driven by growth in both contractual and transactional services, partially offset by lower volume in upgrades.
Revenue for the quarter was $1.8 billion, down 9% versus the prior year. Equipment revenue was down 30% driven by the timing of our equipment backlog conversion Services revenue was up 16% versus the prior year. Operating income for TPS was $346 million, up 4% year-over-year driven by favorable mix from a strong volume quarter-end services. Operating margin was 19.5%, up 240 basis points year-over-year, driven by higher services mix. For the first quarter, they expect revenue to be roughly flat year-over-year with higher service revenues, offsetting a decline in equipment revenue.
Based on this revenue outlook, BKR expects TPS operating income rates to increase slightly on a year-over-year basis. For the full year, they expect TPS orders in 2022 to be roughly the same as 2021 driven by continued strength in LNG awards. BKR also sees a continued solid pipeline in the onshore-offshore production segment along with opportunities in pumps, valves and new energy areas. Solid revenue growth is expected in 2022 driven by growth in services and strong orders growth in 2021.
The outlook remains constructive driven by opportunities in LNG, onshore offshore production and new energy initiatives. TPS booked almost $7.7 billion of orders, which included 22 MTPA of LNG orders across four projects and 9 FPSOs and offshore topside project awards. On the execution side, TPS generated over $1 billion of operating income representing over 16% in operating margin rate despite revenue growth and equipment significantly outpacing services.
BKR announced a major LNG award for the 5 MTPA Pluto Train 2 project in Western Australia, which is operated by Woodside, and also received a large scale LNG equipment award in the Eastern Hemisphere. Additionally, they were awarded an order to deliver power generation equipment for a major LNG project in North America.
Continued optimism is forecast on the outlook for LNG and remain confident on the potential for 100 to 150 MTPA of awards over the next two years to three years. Based on the continued pace of discussions with multiple customers and the positive fundamentals in the global gas markets, there is a general bias towards the upper end of this range.
Digital Solutions. Orders for the quarter were $605 million, up 14% year-over-year. Revenue for the quarter was $558 million, flat year-over-year with higher volumes in Waygate, Reuter Stokes and PPS, offset by lower volumes in Nexus Controls, Druck and Bently Nevada. Sequentially, revenue was up 9% with improvements across most product lines. Operating income for the quarter was $51 million, down 33% year-over-year driven by headwinds from mix and higher R&D costs. Sequentially, operating income was up 97% primarily driven by higher volume.
For the first quarter, they expect to see modest revenue growth year-over-year, supported by a stronger opening backlog. They expect operating margin rates to be down slightly year-over-year, but to remain in the mid-single digits. For the full year, we expect solid growth in revenue as supply chain constraints begin to ease and orders pick up across Digital Solutions. With higher volumes, BKR expects strong improvements in DS margins which could approach double digits for the total year.
Risks for BKR
The key risk in BKR is its uneven performance in other business lines. As I noted above, BKR is a top-tier supplier, but usually ranks second to Halliburton in the OFS space. This trend could offset higher performance in the TPS segment. I don’t see this as an outsized risk in the rising market conditions we are experiencing. In these conditions, if you have something to sell, you can find a buyer for it. The thing to remember is this market is an anomaly that will not last forever.
Your takeaway
With the market conditions we have at present, Baker is on track to deliver ~$10 bn of OCF in 2022. I think that may actually run a little higher depending on logistics and supply chain stuff, and improve a bit further in 2023. On that basis, it’s trading at 3.3X OCF, on the low side of a very comfortable range. For reference, Hally is trading at 5.3X forward OCF estimates for the year.
Baker is aggressively reducing their share count with a $2.0 bn authorization in place. The company was asked about the likelihood of a bump to the dividend and Simonelli didn’t think that was going to be forthcoming, preferring instead to use capital to fund the growth and buyback shares.
Analysts view BKR as overweight with price ranges of $29 to $48 over the next year. I don’t see them slipping toward the lower end of that range, but think the upper end is quite justifiable based on its advantage in the LNG/CCUS sectors.
I think the company is an excellent play for modest growth toward that $48 level. It could be achieved either through improved margins moving cash flow higher, or continued substantial contract awards in the TPS area.
Be the first to comment