

zimmytws
(This article was co-produced with Hoya Capital Real Estate)
Introduction
This will be the last of three articles exploring the taxable municipal bond space of the fixed income world. Since these bonds are not free of federal taxes, nor home-state taxes, one might ask why own them at all? One answer is diversity for the investor’s fixed income allocation, especially if they want to own them in a tax-sheltered account like an IRA.
The prior two articles covered the three CEFs that I am aware of that invest in taxable municipal bonds, though, as the name implies, one isn’t pure:
- BlackRock Taxable Municipal Bond Trust (BBN) & Nuveen Taxable Municipal Income Fund (NBB): article link
- Guggenheim Taxable Municipal Bond & Investment Grade Debt Trust (GBAB): article link
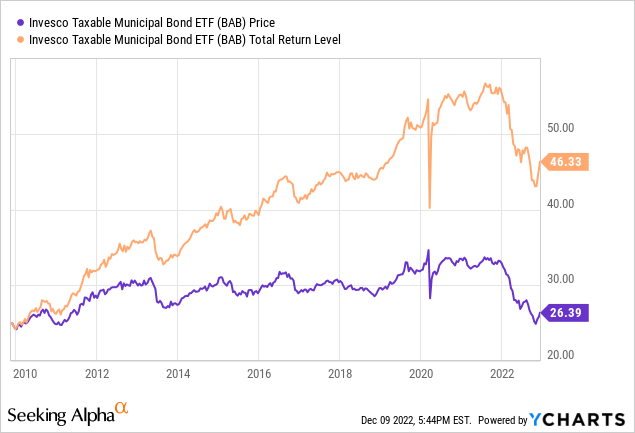
Here I examine the only ETF I found in this space, the Invesco Taxable Municipal Bond ETF (NYSEARCA:BAB). Investors wanting to avoid leverage-using funds would look to BAB as their vehicle of choice.
Invesco Taxable Municipal Bond ETF review
Seeking Alpha describes this ETF as:
BAB primarily invests in U.S. dollar-denominated, investment grade taxable municipal debt publicly issued by U.S. states and territories, and their political subdivisions with at least one year remaining to final maturity. The fund generally will invest at least 80% of its total assets in securities that comprise the ICE BofA US Taxable Municipal Securities Plus Index. BAB started in 2009.
Source: Seekingalpha.com
The ICE BofA U.S. Taxable Municipal Plus Index is designed to track the performance of USD-denominated taxable municipal debt publicly issued by U.S. states and territories, and their political subdivisions, in the U.S. market.
BAB holdings review
Supplied characteristics include:
- Effective Duration: 8.17 yrs
- Modified Duration: 8.79 yrs
- Yield to Maturity: 5.07%
- Yield to Worst: 5.05%
- Years to Maturity: 14.73
- Weighted Average Coupon: 4.12% (100% are fixed rate)
- Weighted Average Price: $91.17
The duration indicates BAB shareholders could expect a 8+% drop in price if interest rates climb another 100bps. With an average bond price just over $91, price appreciation is possible once rates start down. Related to duration is maturity, and the following shows those distributions.
invesco.com maturities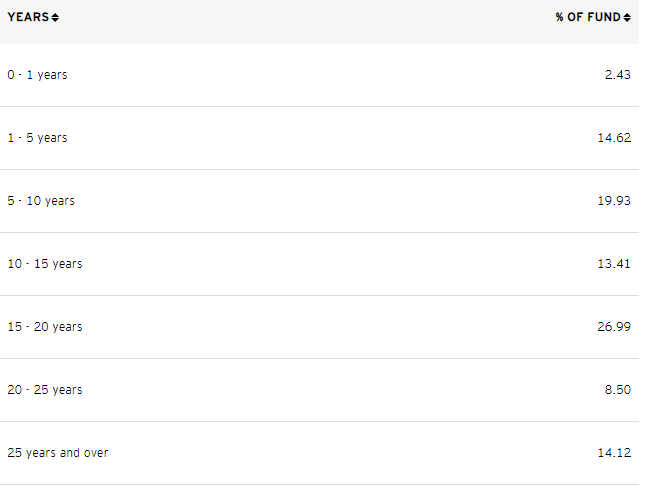
Invesco provide two sets of ratings allocations for BAB: notice there are differences.
invesco.com ratings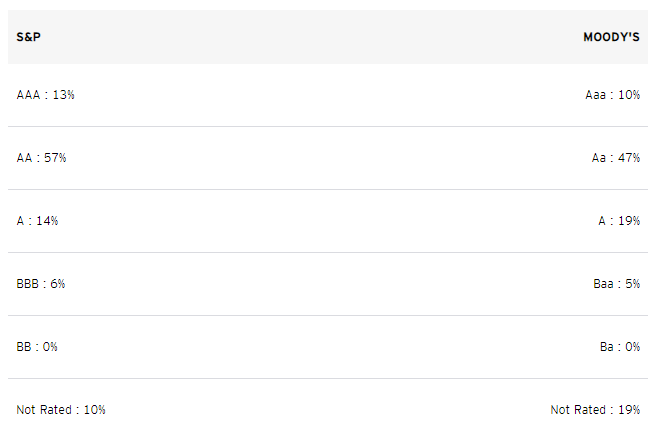
I calculated the portfolio has a WAR of AA- and Aa-, with S&P having a slightly higher weighting. Unlike other bond funds, no state allocation data was found by me. I did locate data that showed there are 213 distinct issuers, with the top three all being from California.
The Top 20 holdings, representing 16.67% are:
invesco.com; compiled by Author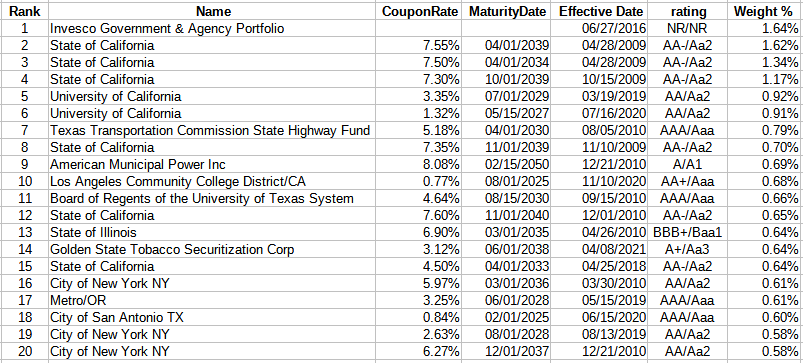
In a portfolio of 660 bonds, it takes only 37 to hit the 25% concentration mark. It takes the smallest 33% of the portfolio to reach 10% of the overall weight.
BAB distribution review
seekingalpha.com DVDs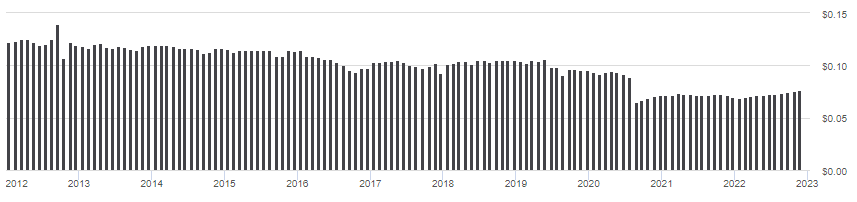
A steady payout does not describe what BAB investors have experienced over the past decade. Even with the recent increases, the payout is still 20% of what it was just over two years ago. Those results explain the poor “C-” dividend rating from Seeking Alpha.
seekingalpha.com scorecard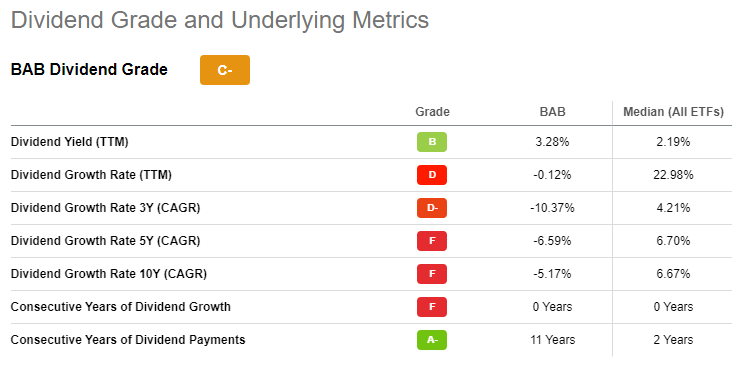
Seeking Alpha overall ratings
Besides dividends, Seeking Alpha rates and compares ETFs on multiple factors and against other related ETFs.
seekingalpha.com BAB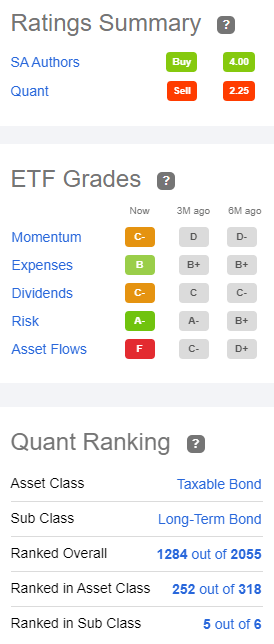
The sub-class of six ETFs confirmed this was the only ETF investing in taxable bonds.
seekingalpha.com: sub-class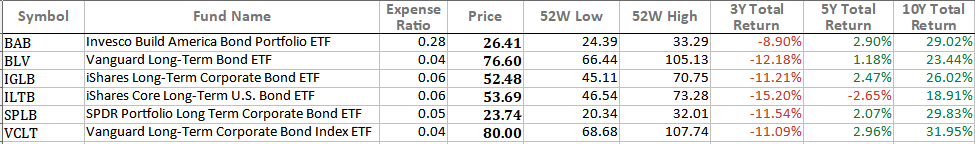
One interesting observation is SA Authors rate BAB as a Buy while the SA Quant ranking give it a Sell rating.
Portfolio strategy
Along with the taxable funds already mentioned, I added the top-rate ETF in the same sub-class to the next comparison: Vanguard Long-Term Corporate Bond Index ETF (VCLT).
PortfolioVisualizer.com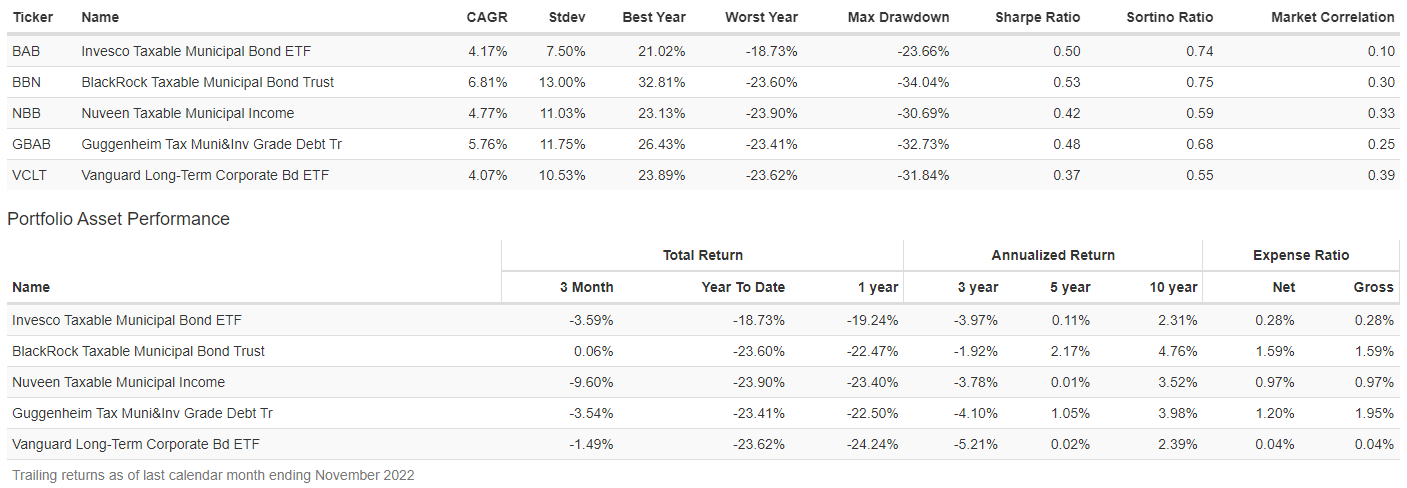
After being no better than 4th based on 3-, 5-, ands 10-yr CAGRs, BAB is the top performer both at 1-yr and YTD, though they are again slipping over the past three months. What is also interesting is how divergent the CAGRs are over the last three months amongst the CEFs listed: strategy within the strategy matters too. If one can stomach the highest fee, the BlackRock Taxable Municipal Bond Trust gives the best results long-term.
Based on how BAB has performed against the CEFs and several long-term corporate bond ETFs, the best I can muster is a Hold. A good candidate for tax-loss swapping.
Final thoughts
Following up on the idea of selling if one has a loss, the decision then becomes when to reinvest the funds? This article will appear after the FOMC’s December meeting. Odds were they will do another 50bps jump in the Fed Funds Rate, and indeed that occurred but the dot plot from December shows the median rate at the end of 2023 at 5.1% vs 4.6% at the September 2022 projection. As above shows, these five funds are down from 19% to 24% in the past year. The main reason is where interest rates have gone over that time.
fred.stlouisfed.org: A rating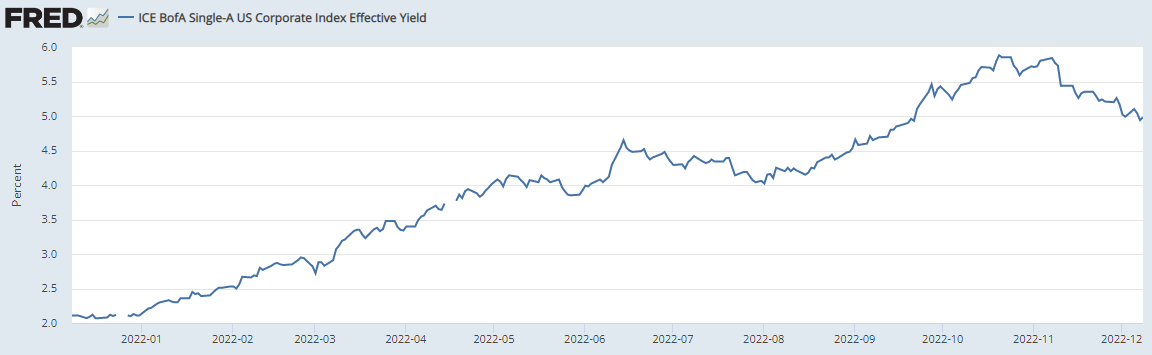
The interest rate on “A-rated” corporates has dropped 90bps since early November. BAB is up almost 7% since then so maybe the bottom has been set.

I ‘m proud to have asked to be one of the original Seeking Alpha Contributors to the 11/21 launch of the Hoya Capital Income Builder Market Place.
This is how HCIB sees its place in the investment universe:
Whether your focus is high yield or dividend growth, we’ve got you covered with high-quality, actionable investment research and an all-encompassing suite of tools and models to help build portfolios that fit your unique investment objectives. Subscribers receive complete access to our investment research – including reports that are never published elsewhere – across our areas of expertise including Equity REITs, Mortgage REITs, Homebuilders, ETFs, Closed-End-Funds, and Preferreds.
Be the first to comment