

bodnarchuk
Part I – Introduction
Vancouver-based gold miner B2Gold Corp. (NYSE:BTG) released its third-quarter of 2022 results on November 1, 2022.
Note: I have followed BTG quarterly since July 2019, with 19 articles and counting. This new article is a quarterly update of my article published on October 20, 2022.
BTG Assets location Map (BTG Presentation)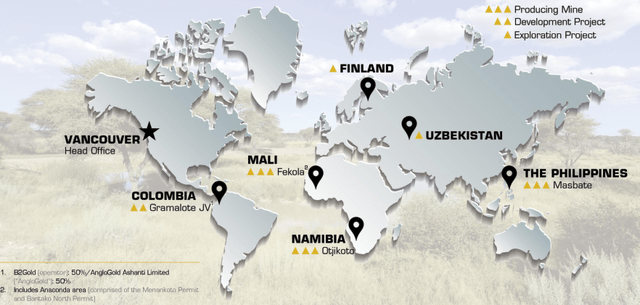
Note: The main asset for the company is the Fekola Mine in Mali, West Africa.
1 – 3Q22 results snapshot
B2Gold posted a net loss attributable to the shareholders of $23.41 million, or $0.02 per diluted share, and an adjusted net income of $32 million, or $0.03 per share, compared with $122.75 million, or $0.12 per share, in 3Q21.
Revenues for 3Q22 were $392.55 million, up 2.8% sequentially and down 23.2% compared to the same quarter a year ago. Cash flow provided by operating activities before changes in non-cash working capital was $93.12 million, down significantly from the 3Q21.
BTG 3Q22 Summary (BTG Presentation November)
Total gold production in the third quarter of 2022 was 227,016 ounces (including 12,113 Au ounces for its 30.8% Calibre Mine).
Lower-than-expected production at the Fekola and Otjikoto mines in the third quarter of 2022 was due to temporary mining sequence changes. Strong production is anticipated in the fourth quarter of 2022 at both operations.
Based on the year-to-date cost performance and anticipated solid gold production in Q4 2022, the company reaffirmed full-year 2022 total gold production and total consolidated cost guidance.
During the third quarter, the company completed the acquisition of Oklo on September 20, 2022, providing B2Gold with an additional landholding of 1,405 km2 covering highly prospective greenstone belts in Mali.
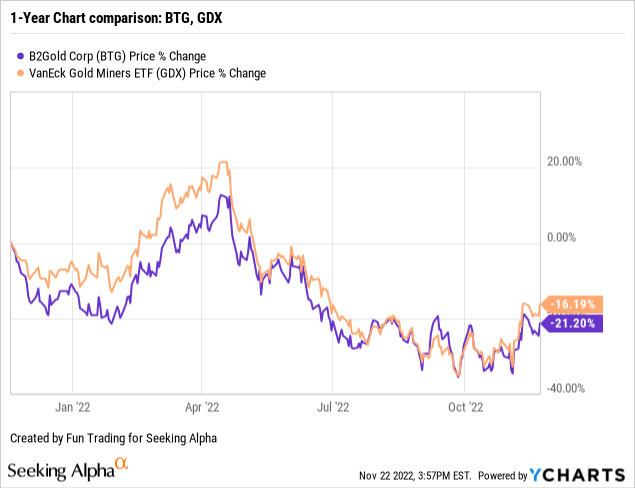
2 – Stock performance
B2Gold has slightly outperformed the VanEck Vectors Gold Miners ETF (GDX) and is down 22% on a one-year basis. BTG has dropped significantly since April-May this year in correlation with the Fed’s actions against rampant inflation.
3 – Investment thesis
I consider BTG a strong mid-tier gold miner with well-diversified assets, even if the Fekola mine presents an additional risk due to the political instability in Mali.
However, while the risk should not be discounted, I do not think the issue prevents us from investing long-term in the company. The Fekola mine is located near the border of Senegal and is relatively insulated.
The Cardinal zone recently included in the Fekola permit extends the future potential production at the mine complex. Finally, the newly acquired Anaconda prospect is another plus.
Total mineral reserves on an attributable ownership basis are 5.41 Au Moz.
BTG Reserves (BTG Presentation)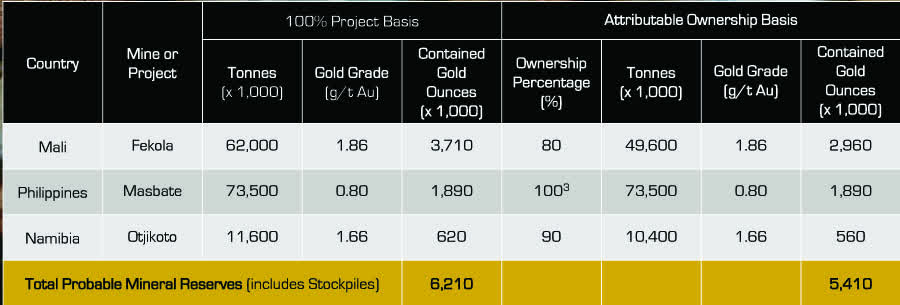
The Anaconda prospect is located about 20 km North of the Fekola mine and presents an excellent opportunity:
BTG Anaconda Prospect (BTG Presentation)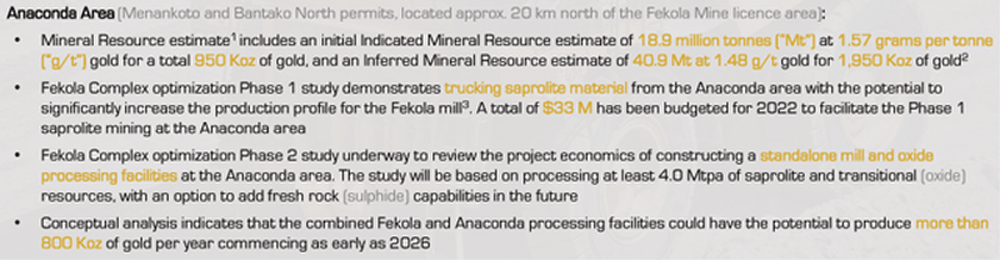
Thus, one winning strategy that I often recommend in the gold sector in my marketplace, “The Gold and Oil Corner,” is trading about 50%-60% LIFO of your whole BTG position and keeping a core long-term position for an eventual higher stock price.
I believe it is the best strategy (the centerpiece of my marketplace) that will protect you from “surprises” and rewards you with a sizeable profit.
Part II – B2Gold – 3Q22 Balance Sheet – The Raw Numbers
| B2Gold | 3Q21 | 4Q21 | 1Q22 | 2Q22 | 3Q22 |
| Total Revenues in $ Million | 510.86 | 526.11 | 365.58 | 381.99 | 392.55 |
| Net Income in $ Million | 123.11 | 136.94 | 80.72 | 37.80 | -23.41 |
| EBITDA $ Million | 335.77 | 360.19 | 222.42 | 188.78 | 143.60 |
| EPS Diluted in $/share | 0.12 | 0.13 | 0.09 | 0.04 | -0.02 |
| Cash from Operations in $ Million | 320.28 | 266.29 | 107.31 | 124.88 | 93.12 |
| Capital Expenditure in $ Million | 63.56 | 112.50 | 67.93 | 132.49 | 76.50 |
| Free Cash Flow in $ Million | 256.73 | 153.79 | 39.39 | -7.62 | 16.62 |
| Total Cash $ Million | 546.51 | 673.0 | 648.76 | 586.70 | 549.46 |
| Total Long-term Debt in $ Million (including current) | 83.75 | 75.13 | 72.66 | 66.64 | 14.32 |
| Dividend $/share | 0.04 | 0.04 | 0.04 | 0.04 | 0.04 |
| Shares Outstanding (diluted) in Billion | 1,061 | 1,061 | 1,062 | 1,068 | 1,064 |
| Production | 3Q21 | 4Q21 | 1Q22 | 2Q22 | 3Q22 |
| Total production gold | 310,261 | 304,897 | 209,365 | 223,623 | 227,016 |
| AISC from continuing operations/consolidated | 795 | 888 | 1,036 | 1,111 | 1,169 |
| Gold Price | 1,782 | 1,800 | 1,874 | 1,861 | 1,711 |
Data Source: Company press release
Analysis: Revenues, And Gold Production
1 – Quarterly revenues were $392.55 million for 3Q22
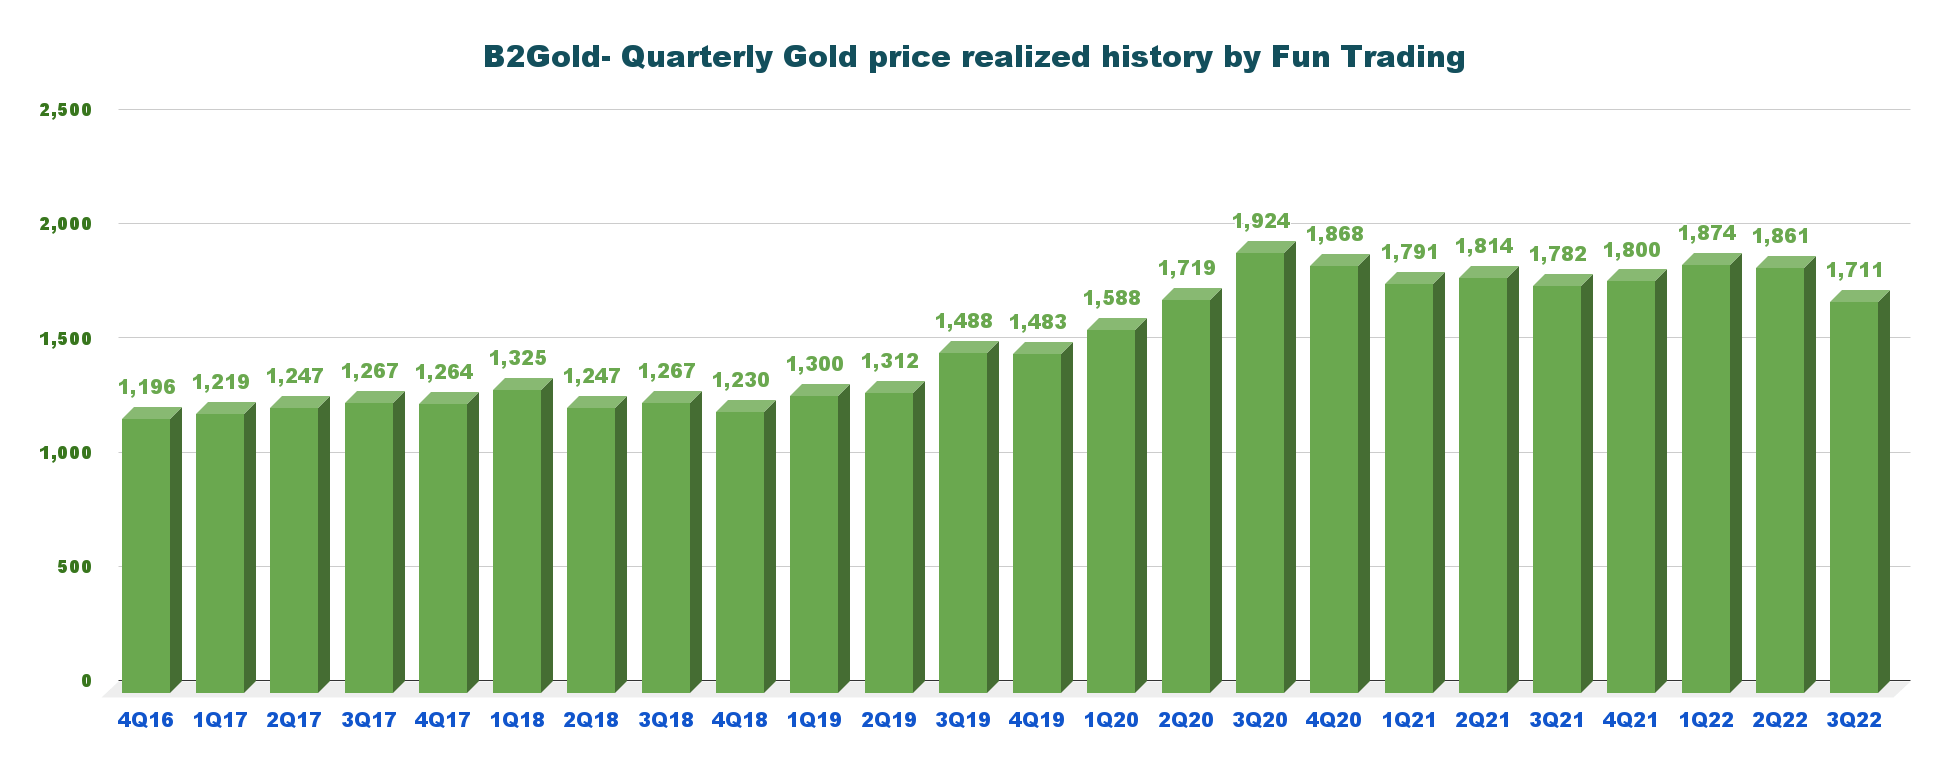
BTG Quarterly Revenues history (Fun Trading) The company announced consolidated gold revenues of $392.55 million in the third quarter of 2022, down significantly from the year-ago period and up 2.8% sequentially (see table above for details and history). The company sold its gold at $1,711 per ounce this quarter. BTG Quarterly Gold price history (Fun Trading) The gold price progression since 2019 has been excellent, but gold has weakened recently due to the Fed’s action on the interest rate. CEO Clive Johnson said in the conference call: As we previously announced in the production release for the third quarter, we were less than budget in terms of our ounces produced. Primarily it was higher much higher than expected rainfalls, the difficult to mine, which will allow us to access some higher grade material that was projected in our budgets.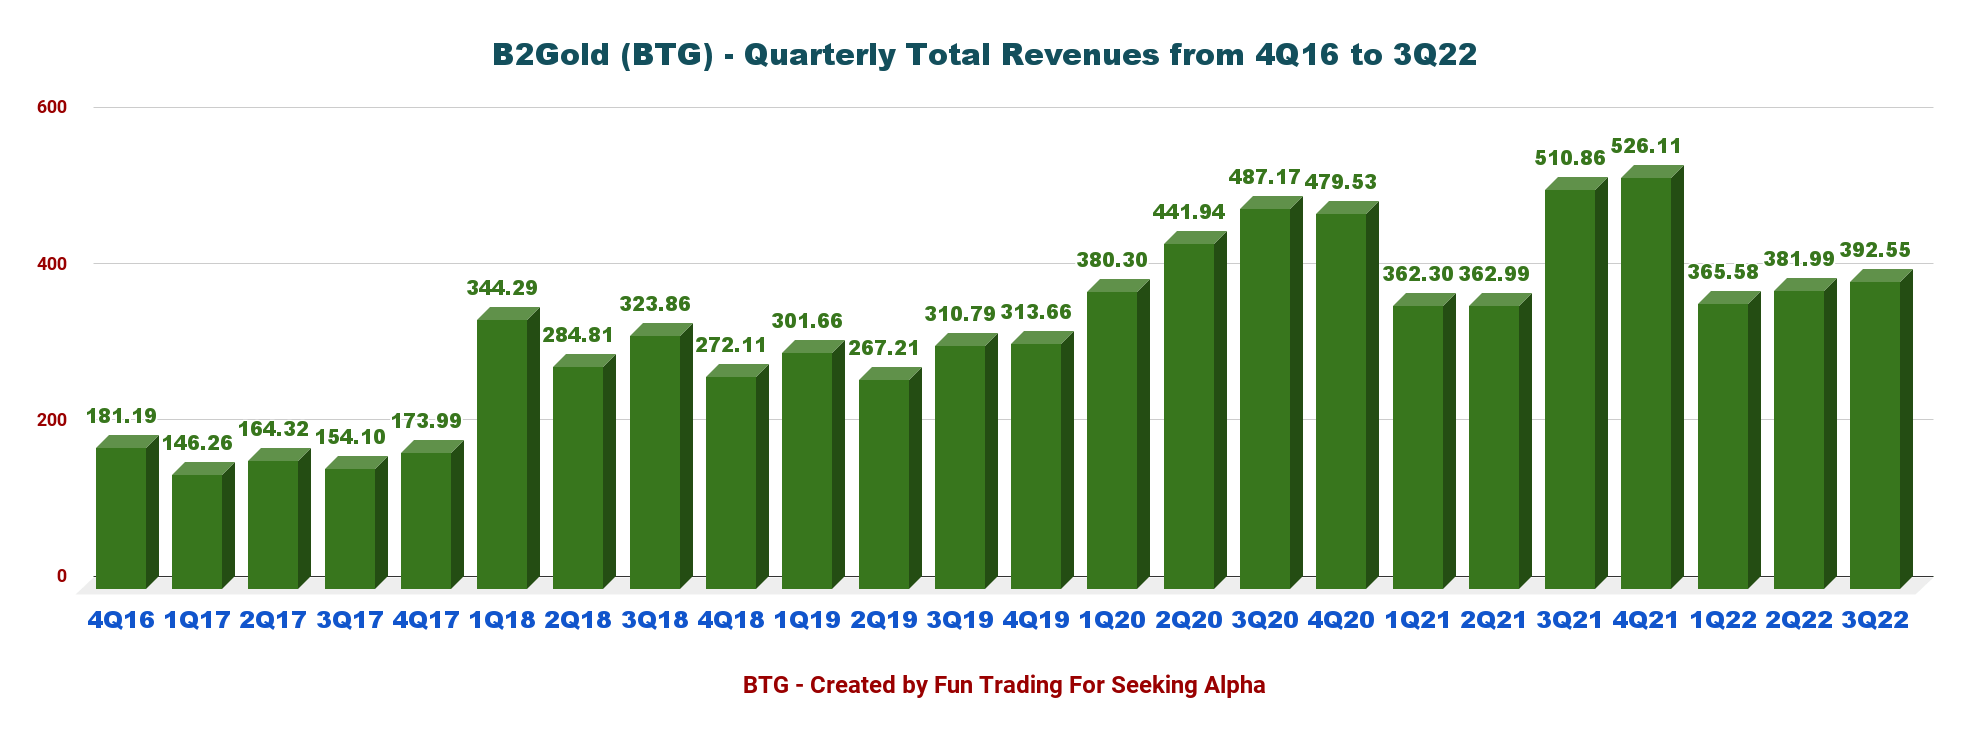
2 – The third quarter’s free cash flow was $16.62 million
BTG Quarterly Free cash flow history (Fun Trading)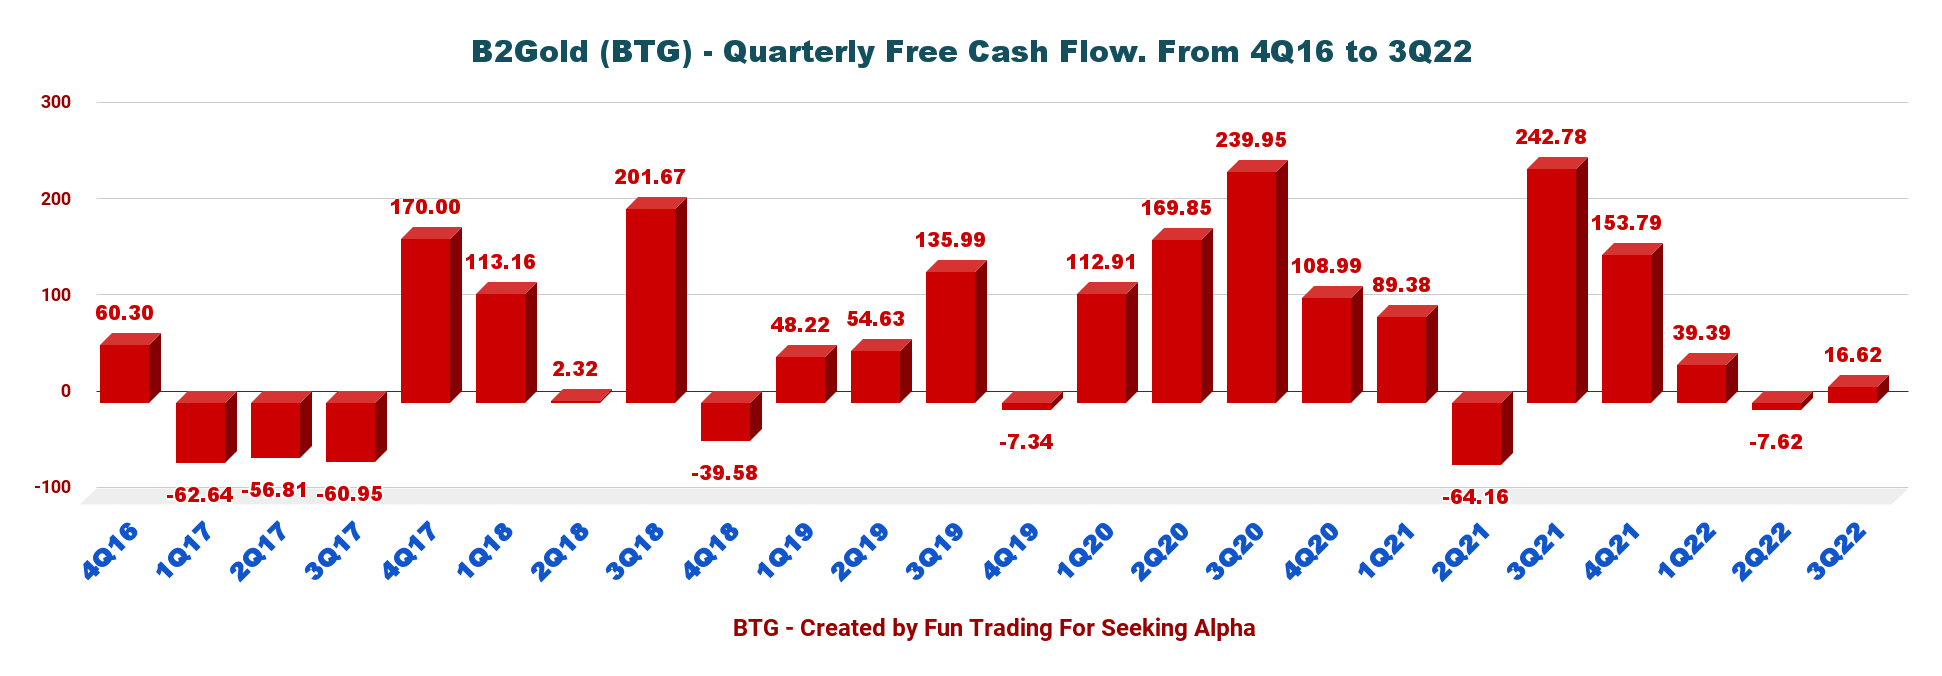
Note: Generic free cash flow is cash from operating activities minus CapEx.
B2Gold had a quarterly free cash flow of $16.62 million in 3Q22, and a trailing 12-month FCF is $202.18 million.
B2Gold’s board pays a quarterly dividend of $0.04 per share or a yield of 4.6%, which is one of the best in the gold industry.
3 – B2Gold is net debt-free and has $549.46 million in total cash at the end of September
BTG Quarterly Cash versus Debt history (Fun Trading) B2Gold continues to maintain a solid financial position and liquidity. As shown in the chart above, the company has a long-term debt (including current) of $14.32 million.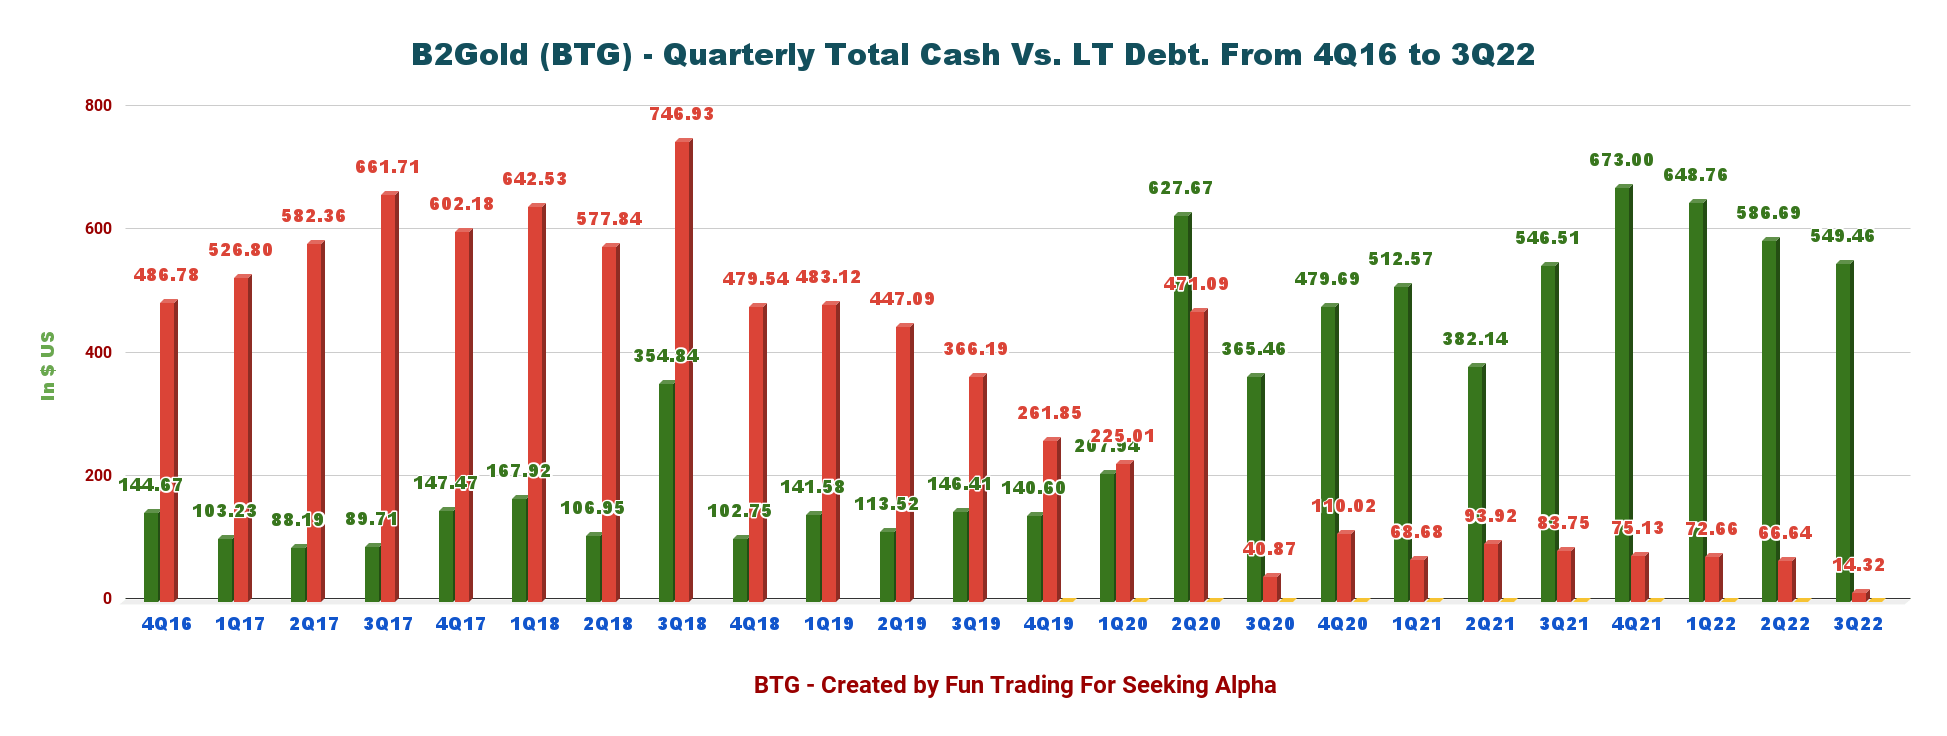
On September 30, 2022, the company had cash and cash equivalents of $549.46 million (September 30, 2021 – $546.51 million).
In addition, the company’s $600 million Revolving Credit Facility (“RCF”) remains fully undrawn and available. The liquidity is estimated at $1,150 million in 3Q22.
4 – Quarterly Production Analysis
Gold production for the third quarter of 2022 was 227,016 Au Oz (including 12,113 Au Oz at the Calibre Mine). The company sold 229,400 Au Oz.
BTG Quarterly Gold production history (Fun Trading) 4.1 – Production detail: Production comparison 2Q22 versus 3Q22 per mine BTG Production comparison 2Q22 versus 3Q22 (Fun Trading)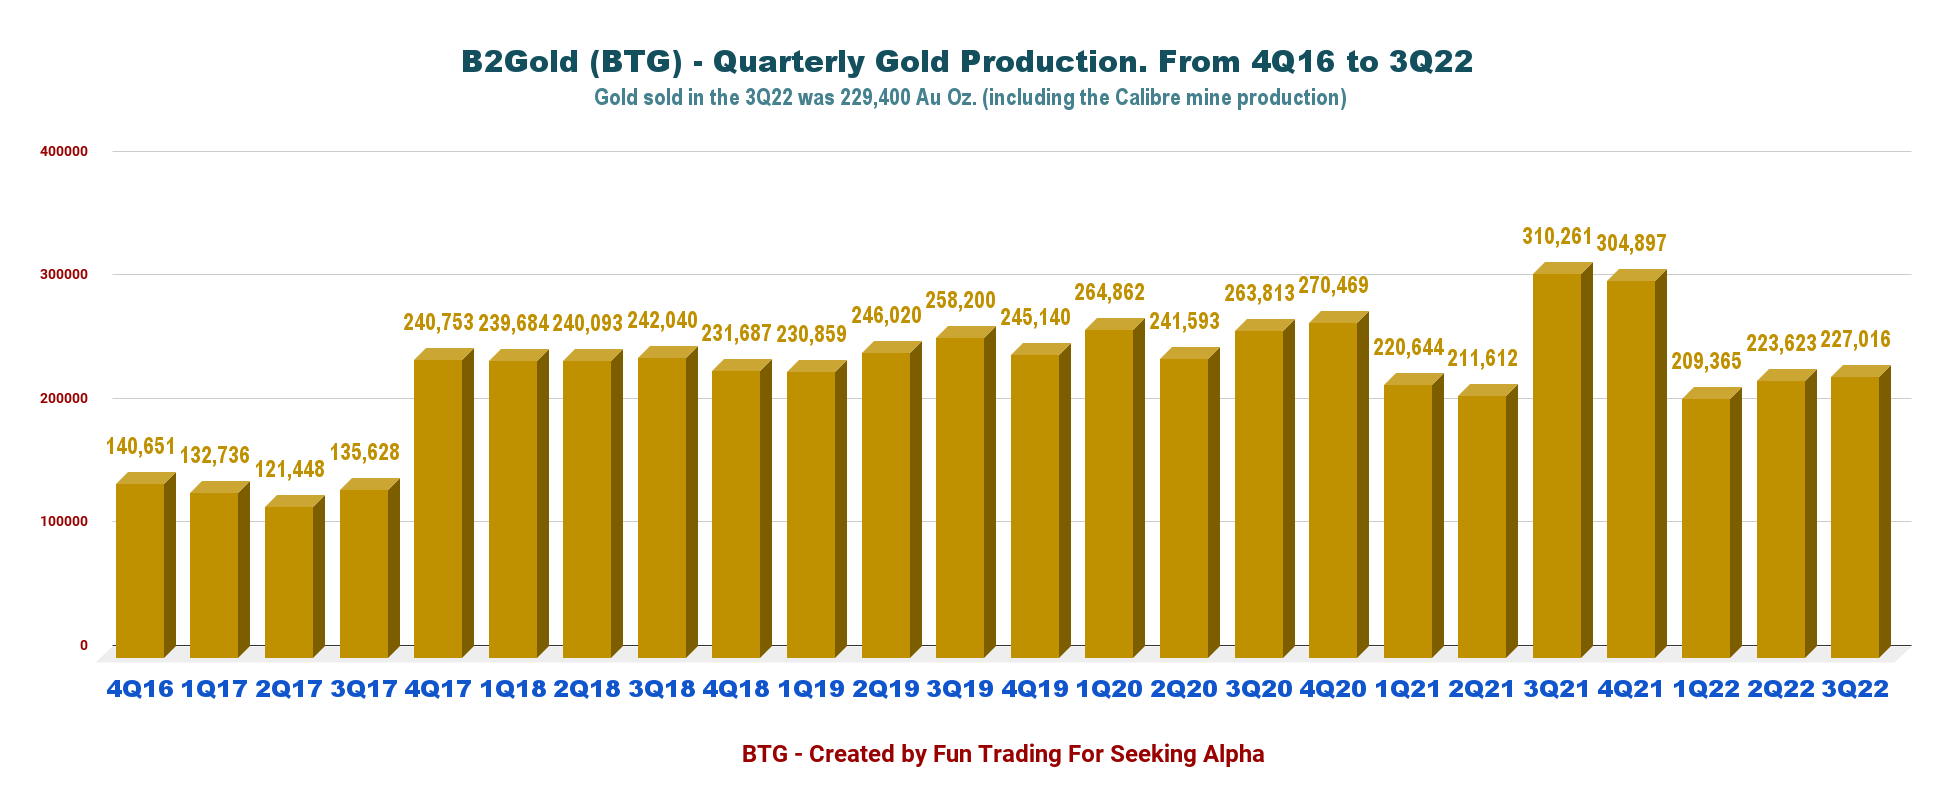
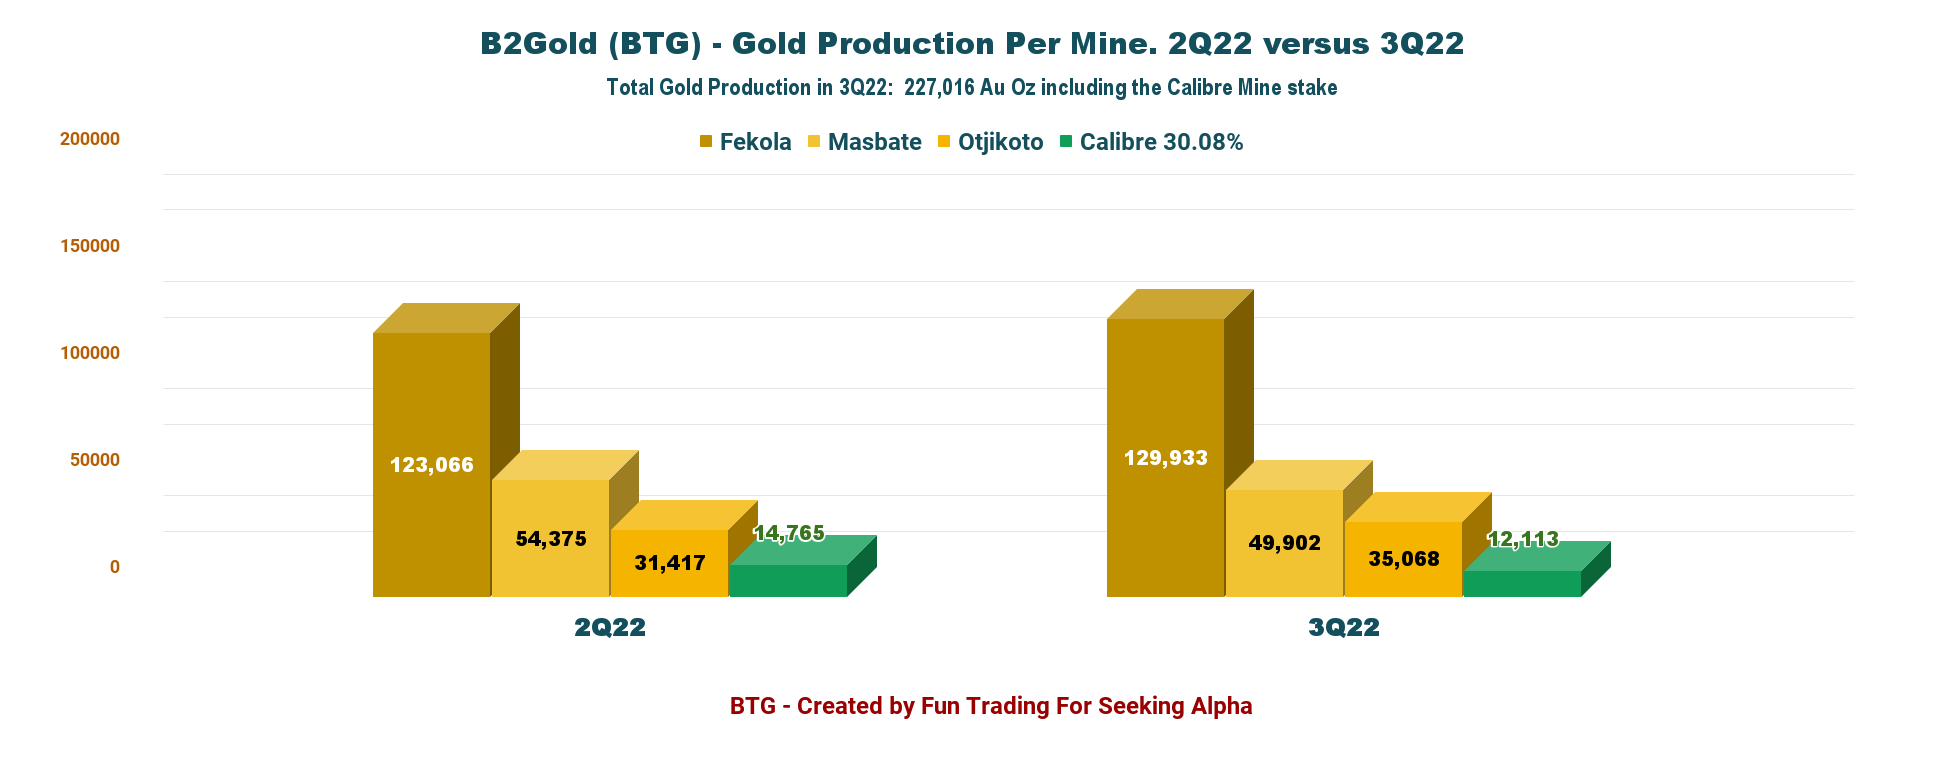
- The Fekola Mine In Mali: Gold production was 129,933 ounces in the third quarter of 2022. Fekola experienced a challenging rainy season which delayed access to higher-grade ore from Fekola Phase 6. The ore from Fekola Phase 6, which is currently mined in the fourth quarter of 2022, is anticipated to average between 3.4 to 3.5 grams per tonne (“g/t”) of gold.
BTG Quarterly Production Fekola (Fun Trading)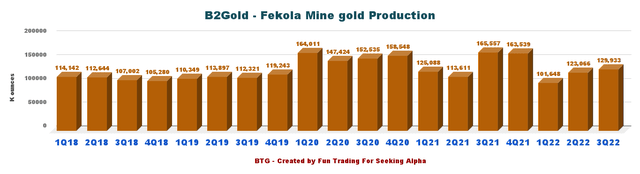
- Fekola Complex feasibility study underway to deliver low capital intensity production growth: BTG started a feasibility level engineering study of stand-alone oxide processing facilities at the Anaconda Area. The study will be based on processing at least 4 million tonnes per annum (“Mtpa”) of saprolite and transitional (oxide) resources, with an option to add new rock (sulfide) capabilities in the future. Results of this study are expected in the second quarter of 2023. Conceptual analysis indicates that the combined Fekola and Anaconda processing facilities could have the potential to produce more than 800K ounces of gold per year, commencing as early as 2026.
- The Masbate Mine In The Philippines: Gold production from the Masbate Mine was 49,902 ounces in the third quarter of 2022. Masbate remains on target to achieve the previously revised 2022 guidance of between 215K and 225K ounces of gold.
- The Otjikoto Mine In Namibia: Gold production from the Otjikoto Mine was 35,068 ounces in the third quarter of 2022, less than anticipated due to a delay in bringing the Wolfshag Underground mine into production. Gold production is forecast to increase significantly in the fourth quarter of 2022 when mining reaches a higher grade zone in the Otjikoto pit. Stope ore production commences from the Wolfshag Underground mine.
- Gramalote is now up for sale: On November 2, 2022, we learned that B2Gold and AngloGold Ashanti (AU) decided to sell their $925 million Gramalote gold project in Colombia before year-end.
4.2 – All-in Sustaining Costs AISC and gold price history
BTG Quarterly AISC and gold price history (Fun Trading)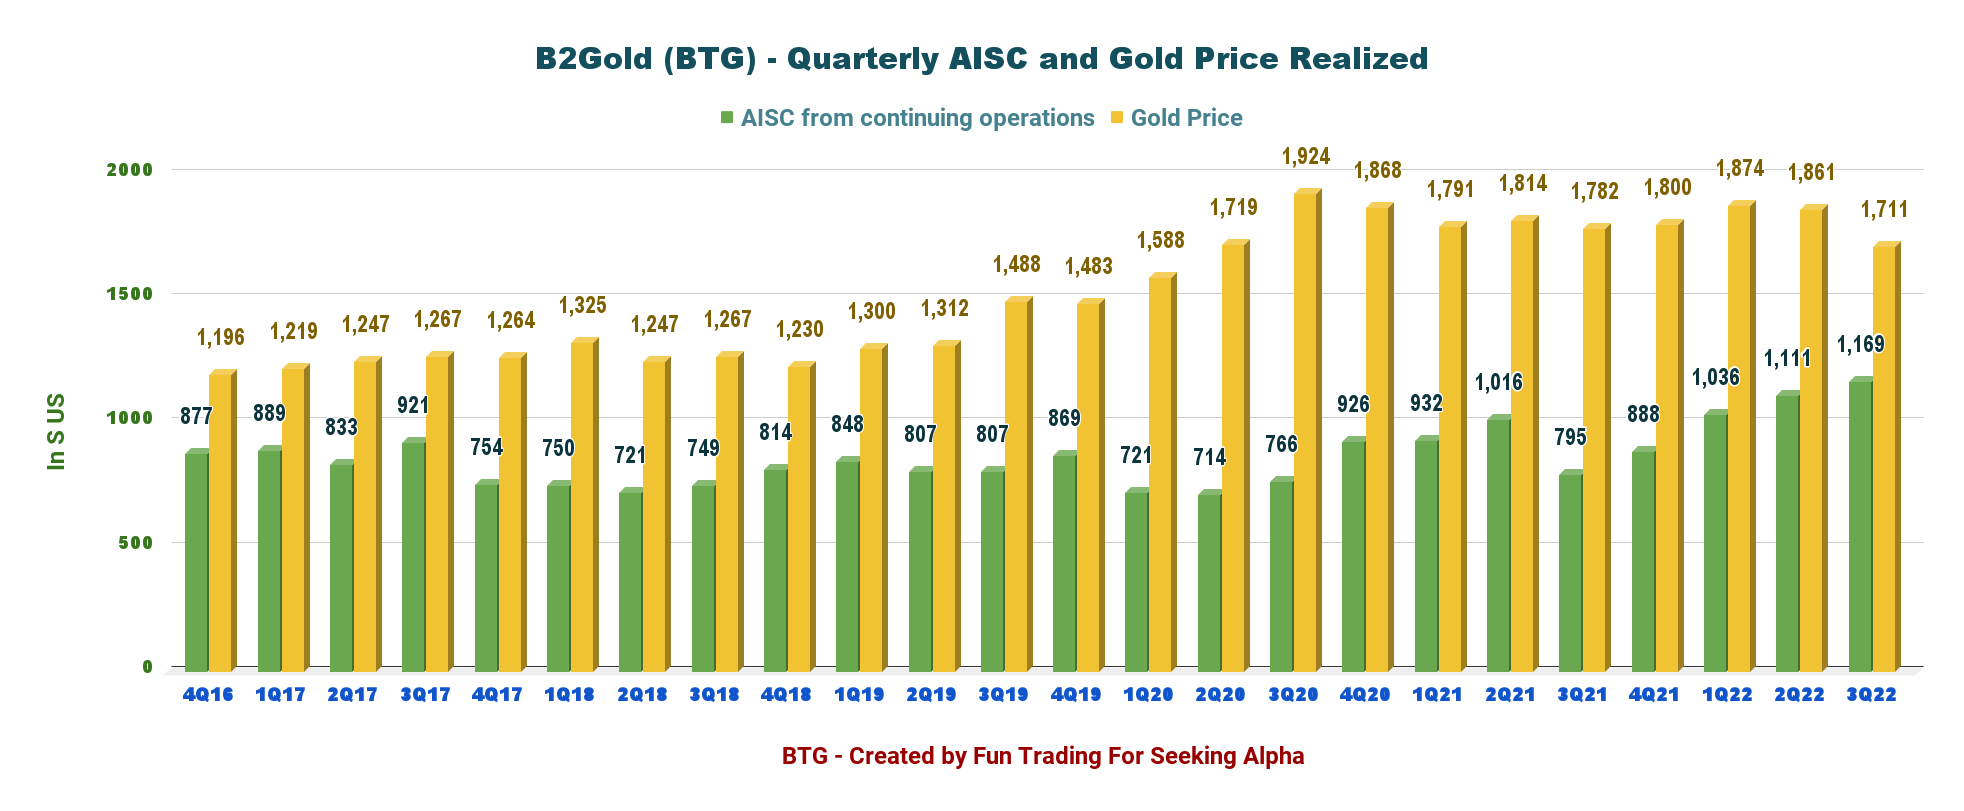
2022 Guidance Unchanged
For the full-year 2022, the company’s total gold production is expected to be between 990K-1,050K ounces (including 40K-50K attributable ounces projected from Calibre).
Total consolidated cash operating costs are between $620 and $660 per ounce, and AISC is forecast to be between $1,010 and $1,050 per ounce.
BTG 2022 Guidance (BTG Presentation)
Technical Analysis And Commentary
BTG TA Chart short-term (Fun Trading StockCharts) Note: The chart is adjusted for the dividend.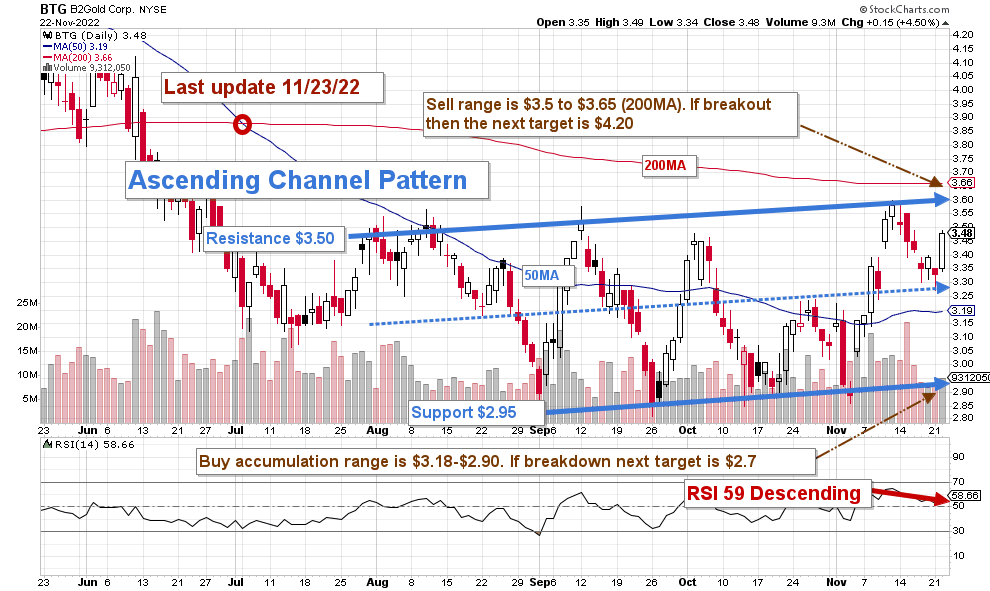
BTG forms an ascending channel pattern with resistance at $3.50 and support at $2.95. Ascending channel patterns are short-term bullish moving higher within an ascending channel, but these patterns often form within longer-term downtrends as continuation patterns.
The dominant strategy that I usually promote in my marketplace, “The Gold and Oil Corner,” is to keep a core long-term position and use about 50%-60% to trade LIFO while waiting for a higher final price target to sell your core position at or above $6-$7. This strategy is perfectly adapted to BTG because of the high dividend yield.
Trading LIFO lets you keep your oldest shares in the game while allowing you to trade the waves and accumulate significant gains without jeopardizing your long-term investment.
I recommend selling partially between $3.50 and $3.65, with higher possible resistance at $4.20. Conversely, it is reasonable to buy back on any weakness between $3.20 and $2.90, with possible lower support at $2.70.
Watch gold like a hawk.
Note: The LIFO method is prohibited under International Financial Reporting Standards (IFRS), though it is permitted in the United States to generally accepted accounting principles (GAAP). Therefore, only US traders can apply this method. Those who cannot trade LIFO can use an alternative by setting two different accounts for the same stock, one for the long term and one for short-term trading.
Warning: The TA chart must be updated frequently to be relevant. It is what I am doing in my stock tracker. The chart above has a possible validity of about a week. Remember, the TA chart is a tool only to help you adopt the right strategy. It is not a way to foresee the future. No one and nothing can.
Author’s note: If you find value in this article and would like to encourage such continued efforts, please click the “Like” button below as a vote of support. Thanks.
Be the first to comment