

Moussa81
Introduction
Vancouver-based gold miner B2Gold Corp. (NYSE:BTG) released its fourth-quarter and full-year 2022 gold production results on January 18, 2023.
Also, BTG announced a quarterly dividend of $0.04 per share in December.
Note: I have been regularly covering B2Gold on Seeking Alpha since 2019. This article is an update of my preceding article, published on November 23, 2022.
1 – 4Q22 and Full-year 2022 Gold Production Snapshot
B2Gold posted a solid gold production of 367,870 Au ounces (including 15,101 Au ounces for its 30.8% Calibre Mine) in the fourth quarter of 2022. It was a large gold production that allowed BTG to meet guidance and saved shareholders from a damaging setback.
BTG production 1,027,874 Au ounces in 2022, reaching the upper half of 2022 Guidance. The seventh consecutive year of meeting or exceeding annual production guidance.
BTG Year Production history (Fun Trading)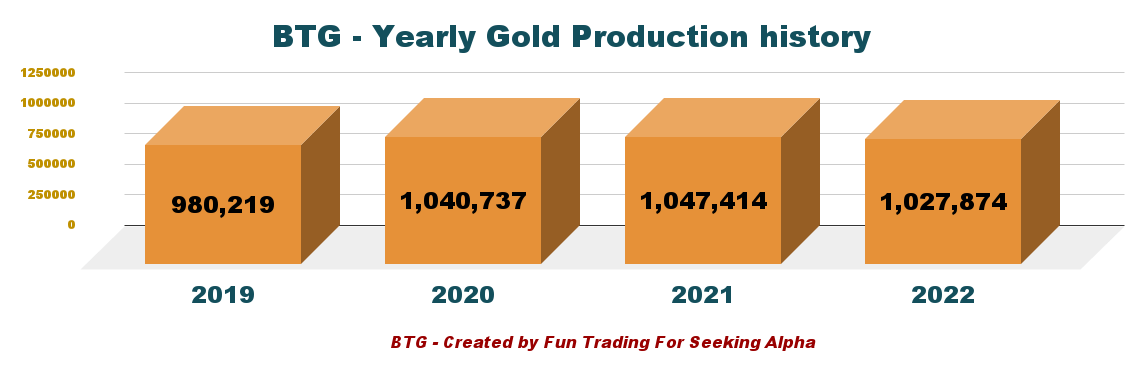
Note: B2Gold holds 93.332 million shares in Calibre Mining (OTCQX:CXBMF), representing a 30.08% stake approximately. The company received 15,101 Au Oz from the Calibre Mine in the fourth quarter of 2022. A total of 54,871 ounces in 2022.
BTG indicated its 2023 guidance:
- Total gold production expected to exceed one million ounces for a fourth straight year: Total gold production guidance of 1,000,000 to 1,080,000 ounces, including 60,000 to 70,000 ounces of attributable production from Calibre.
- Total consolidated cash operating costs remain competitive: Total consolidated cash operating cost guidance of $670 to $730 per gold ounce, slightly higher than the 2022 guidance range due to minor inflationary impacts from fuel, labour, and other key consumables.
- Capital investments at the Fekola Complex to drive the next stage of production growth in Mali: Total consolidated AISC guidance of $1,195 to $1,255 per gold ounce, reflecting the increased investments in Mali to support future growth of the Fekola Complex, and increased capital stripping expenditures at Fekola and Otjikoto. Elevated capital stripping expenditures in 2023 are anticipated to moderate in 2024.
- Continued exploration investment across B2Gold’s highly prospective land packages: $64 million allocated to exploration in 2023, with the vast majority allocated to growth exploration expenditures to support the next phase of organic growth across the portfolio.
- Fekola Regional (Anaconda area) stand-alone processing facility study results expected in the second quarter of 2023: Engineering study of a stand-alone mill and oxide processing facilities at Fekola Regional (Anaconda area) is expected in the second quarter of 2023. The study will be based on processing at least 4 million tonnes per annum (“Mtpa”) of saprolite and transitional (oxide) resources, with an option to add fresh rock (sulphide) capabilities in the future. Initial analysis indicates that the combined Fekola and Fekola Regional (Anaconda area) processing facilities could have the potential to produce more than 800,000 ounces of gold per year commencing as early as 2026.
- Financial position and capital returns program remain robust: The Company remains in a strong net positive cash position and paid a fourth quarter 2022 dividend of $0.04 per common share (annualized rate of $0.16 per common share), one of the highest dividend yields in the gold sector.
2 – Stock Performance
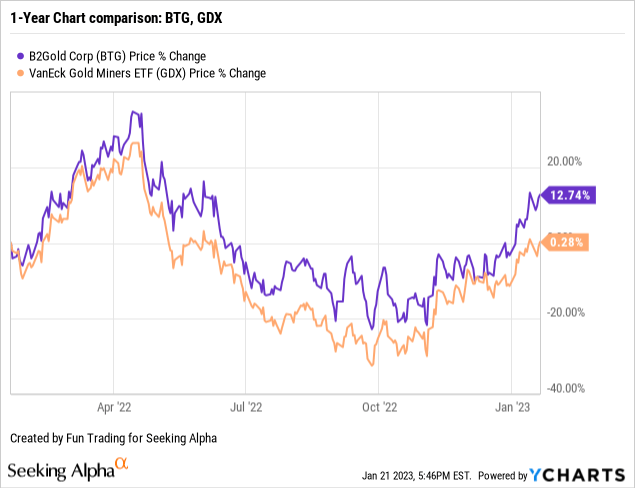
B2Gold is outperforming the VanEck Vectors Gold Miners ETF (GDX) and is now up 13% on a one-year basis. BTG reached a low in October but since then has recovered significantly. The chart pattern is a bullish formation called a cup & handle pattern, which suggests that BTG could go higher.
3 – Investment Thesis
As I said in my preceding article, BTG’s flagship Fekola mine is located in Mali, West Africa. Thus, assessing the risk of doing business in West Africa, especially with Mali, is crucial and should be factored into your investment imperatively.
The situation in Mali is delicate. Even though Fekola Mine is located in a safer part of the country, the risk is still non-negligible and must be taken seriously.
A nationwide state of emergency has been put in place. Terrorist attacks are liable to happen anywhere in the country. In the northern and central parts of the country in particular, violent conflict has flared up repeatedly. Moreover, terrorist groups are active in the north-eastern and central parts of Mali and in regions along the borders with Mauritania, Burkina Faso and Côte d’Ivoire.
Mali’s political transition to revive constitutional order is a crucial ongoing issue. Theoretically, the new timetable for achieving the transition is March 26, 2024.
BTG Fekola Map (BTG Presentation map)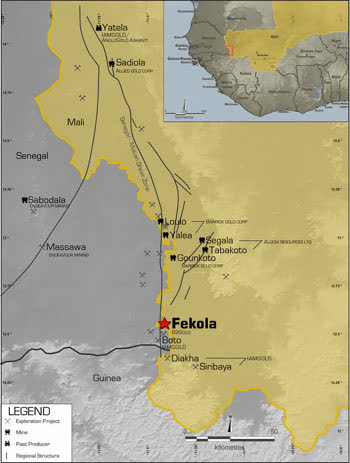
Thus, one possible successful strategy that I often recommend for this sector in my marketplace, “The Gold and Oil Corner,” is trading LIFO about 50%-60% of your total position and keeping a core long-term position for a much higher payday.
Trading LIFO allows you to take advantage of short-term volatility while positioning for a possible future uptrend.
B2Gold – 3Q22 Balance Sheet History And Production Trend and a few balance sheet data from 4Q22 (Preliminary) – The Raw Numbers
| B2Gold | 3Q21 | 4Q21 | 1Q22 | 2Q22 | 3Q22 | 4Q22 |
| Total Revenues in $ Million | 510.86 | 526.11 | 365.58 | 381.99 | 392.55 | 592.00 |
| Net Income in $ Million | 123.11 | 136.94 | 80.72 | 37.80 | -23.41 | – |
| EBITDA $ Million | 335.77 | 360.19 | 222.42 | 188.78 | 143.60 | – |
| EPS Diluted in $/share | 0.12 | 0.13 | 0.09 | 0.04 | -0.02 | – |
| Cash from Operations in $ Million | 320.28 | 266.29 | 107.31 | 124.88 | 93.12 | – |
| Capital Expenditure in $ Million | 63.56 | 112.50 | 67.93 | 132.49 | 76.50 | – |
| Free Cash Flow in $ Million | 256.73 | 153.79 | 39.39 | -7.62 | 16.62 | – |
| Total Cash $ Million | 546.51 | 673.0 | 648.76 | 586.70 | 549.46 | – |
| Total Long-term Debt in $ Million (including current) | 83.75 | 75.13 | 72.66 | 66.64 | 14.32 | – |
| Dividend $/share | 0.04 | 0.04 | 0.04 | 0.04 | 0.04 | 0.04 |
| Shares Outstanding (diluted) in Billion | 1,061 | 1,061 | 1,062 | 1,068 | 1,064 | – |
| Production | 3Q21 | 4Q21 | 1Q22 | 2Q22 | 3Q22 | 4Q22 |
| Total production gold | 310,261 | 304,897 | 209,365 | 223,623 | 227,016 | 367,870 |
| AISC from continuing operations/consolidated | 795 | 888 | 1,036 | 1,111 | 1,169 | 1,010-1,050 |
| Gold Price | 1,782 | 1,800 | 1,874 | 1,861 | 1,711 | 1,746 |
Data Source: Company press release
Analysis: Revenues And Gold Production
1 – Quarterly Revenues were $592 Million in 4Q22
BTG Quarterly Revenue history (Fun Trading) The company announced a new record consolidated gold revenue of $592 million in the fourth quarter of 2022 on sale of 339,355 Au Oz, up 12.5% from the year-ago period and up 50.8% sequentially (see table above for details and history).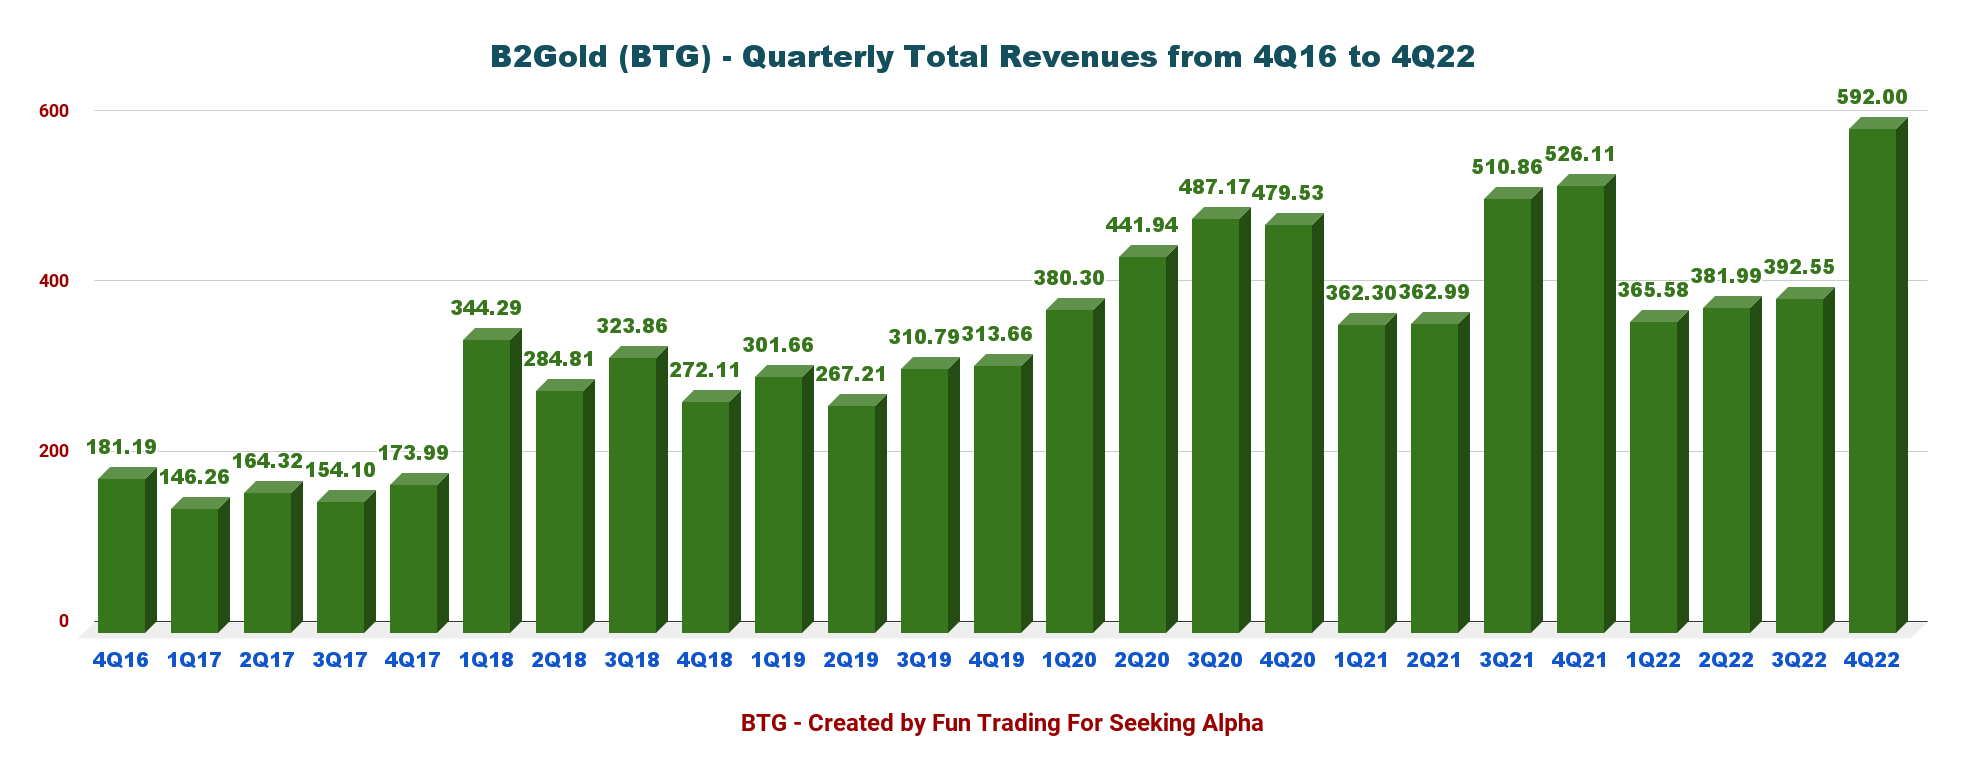
The gold price for 4Q22 averaged $1,746 per ounce, above the $1,711 per ounce realized the previous quarter. AISC for 4Q22 is estimated at $1,030 per ounce.
BTG Quarterly AISC and Gold price history (Fun Trading)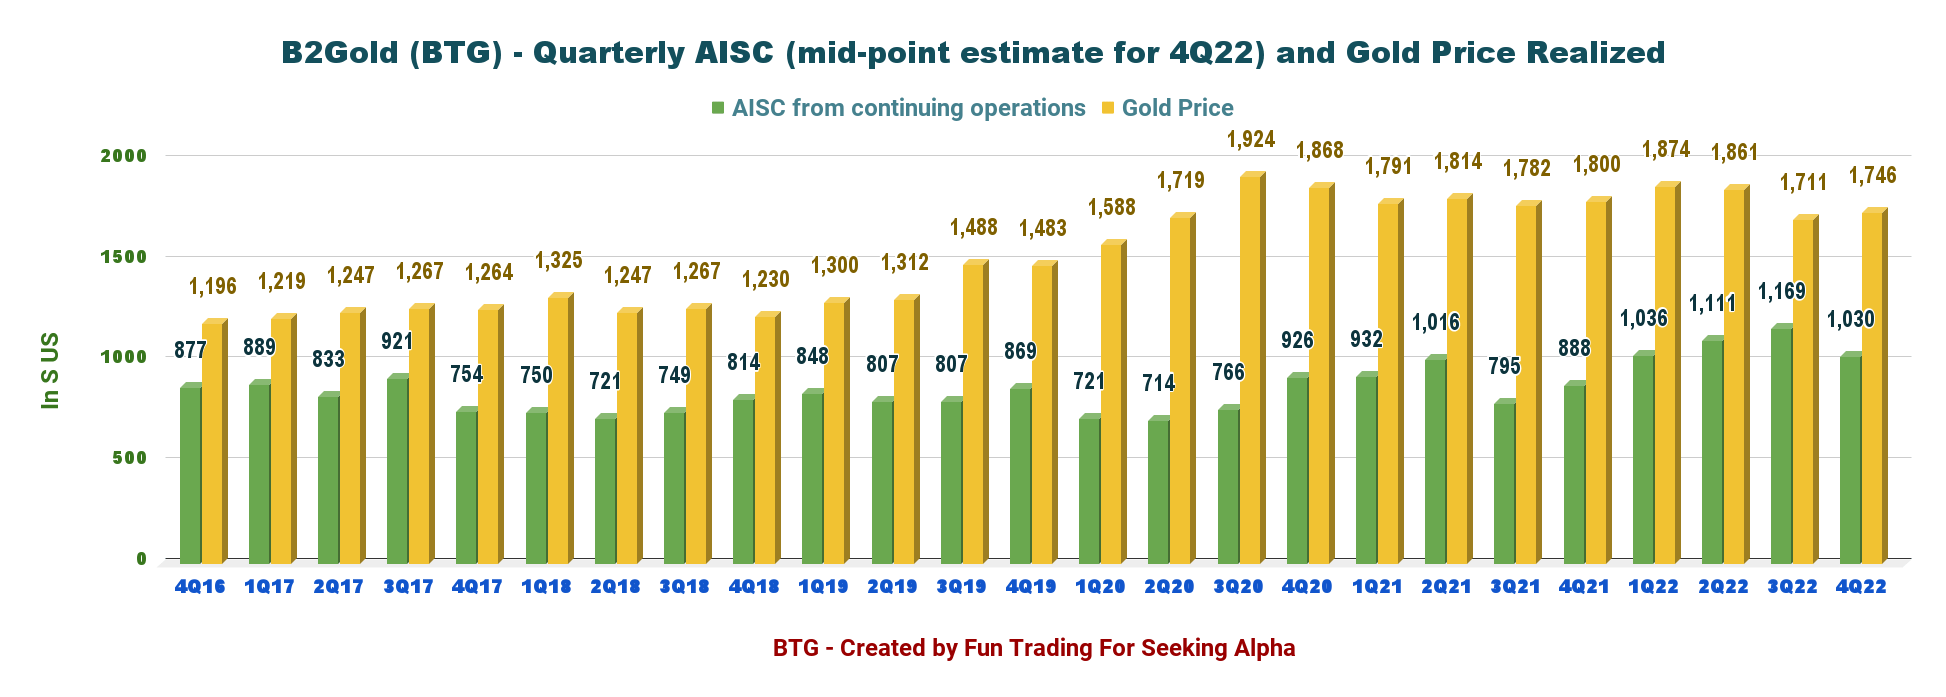
2 – Quarterly Production Analysis
Gold production for the fourth quarter of 2022 was 367,870 Au Oz (including 15,101 Au Oz at the Calibre Mine). The company sold 339,355 Au Oz in 4Q22.
BTG Quarterly Gold production history (Fun Trading) BTG Quarterly gold production 3Q22 versus 4Q22 (Fun Trading)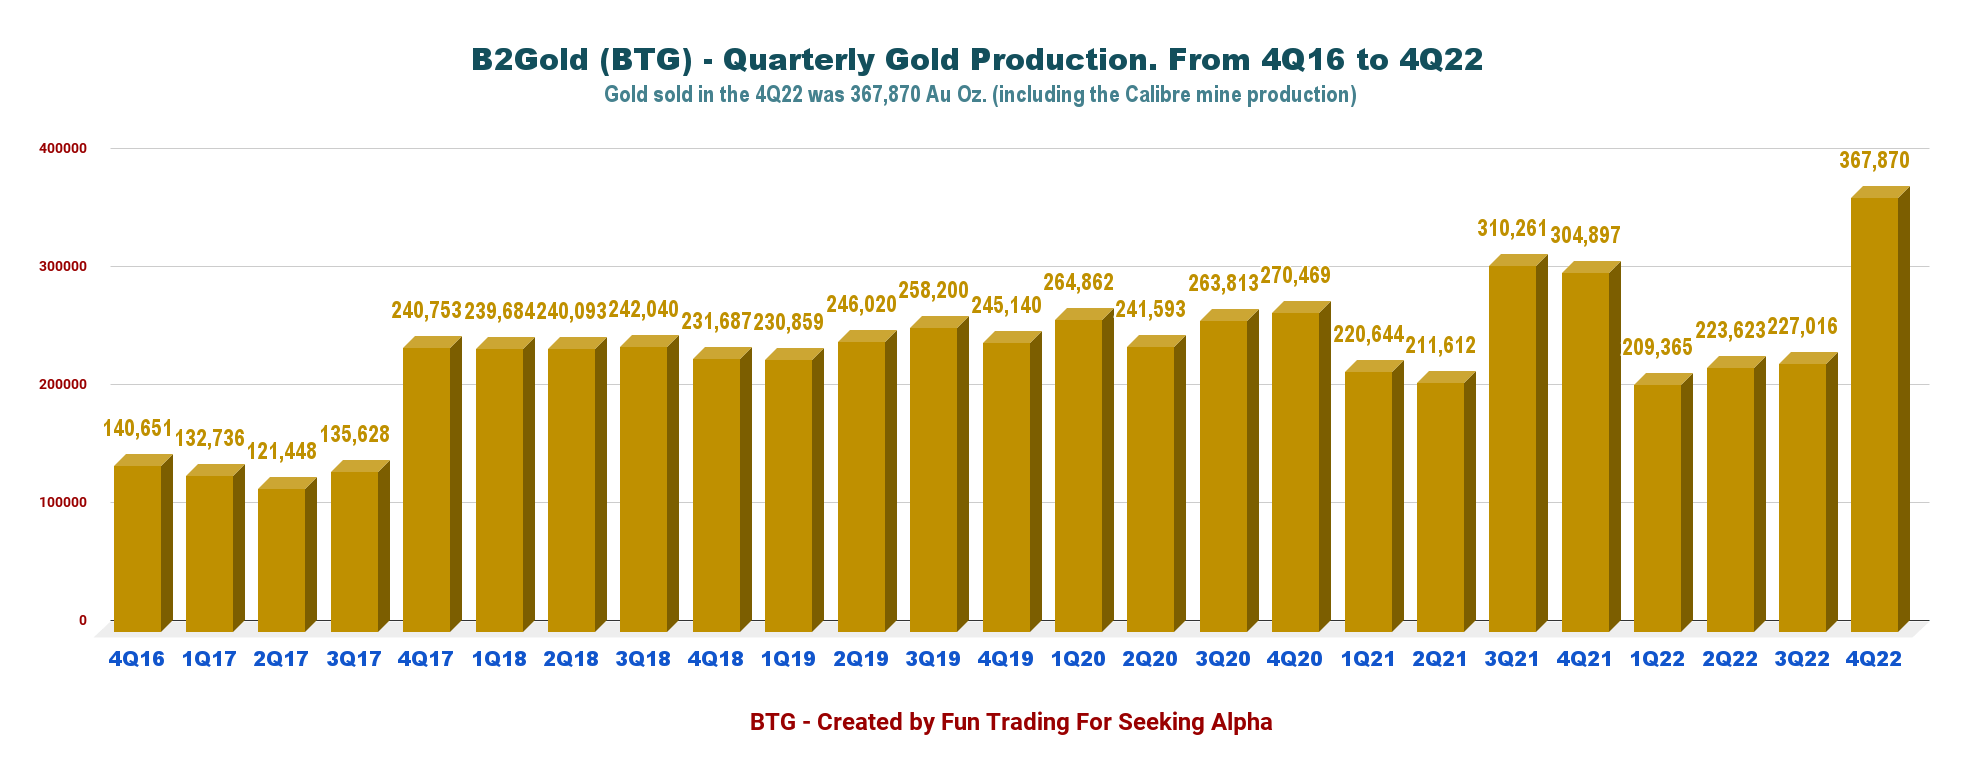
2.1 – Production detail: Production comparison 3Q22 versus 4Q22 per mine
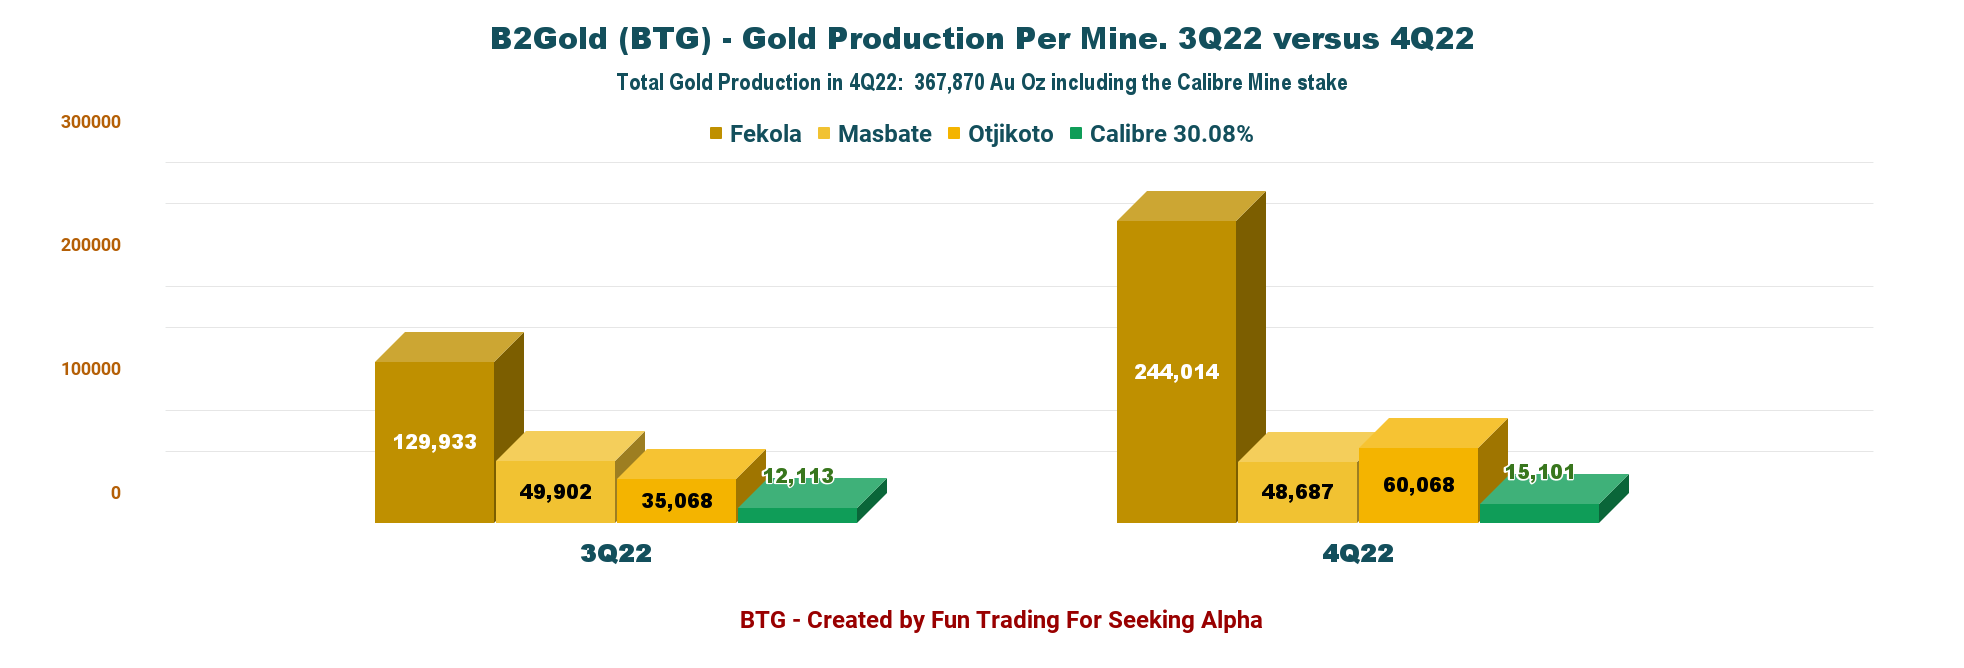
2.1.1 – The Fekola Mine In Mali:
Gold production was a whopping 244,014 ounces in the fourth quarter of 2022. The company said, “High-grade ore from Fekola open-pit Phase 6 contributed to consecutive monthly production records in October and November 2022. The full year 2022 gold production from Fekola of 598,661 ounces, at the upper end of the annual guidance range of 570,000 to 600,000 ounces.”
BTG Fekola mine production history (Fun Trading)
2.1.2 – The Masbate Mine In The Philippines:
Gold production from the Masbate Mine was 48,687 ounces in the fourth quarter of 2022. The company said: “The full year 2022 gold production from Masbate of 212,728 ounces, slightly below the revised guidance range of 215,000 to 225,000 ounces (but at the upper end of the original guidance range of 205,000 to 215,000 ounces).”
BTG Masbate Quarterly Production history (Fun Trading)
2.1.3 – The Otjikoto Mine In Namibia:
BTG Otjikoto Quarterly Production history (Fun Trading)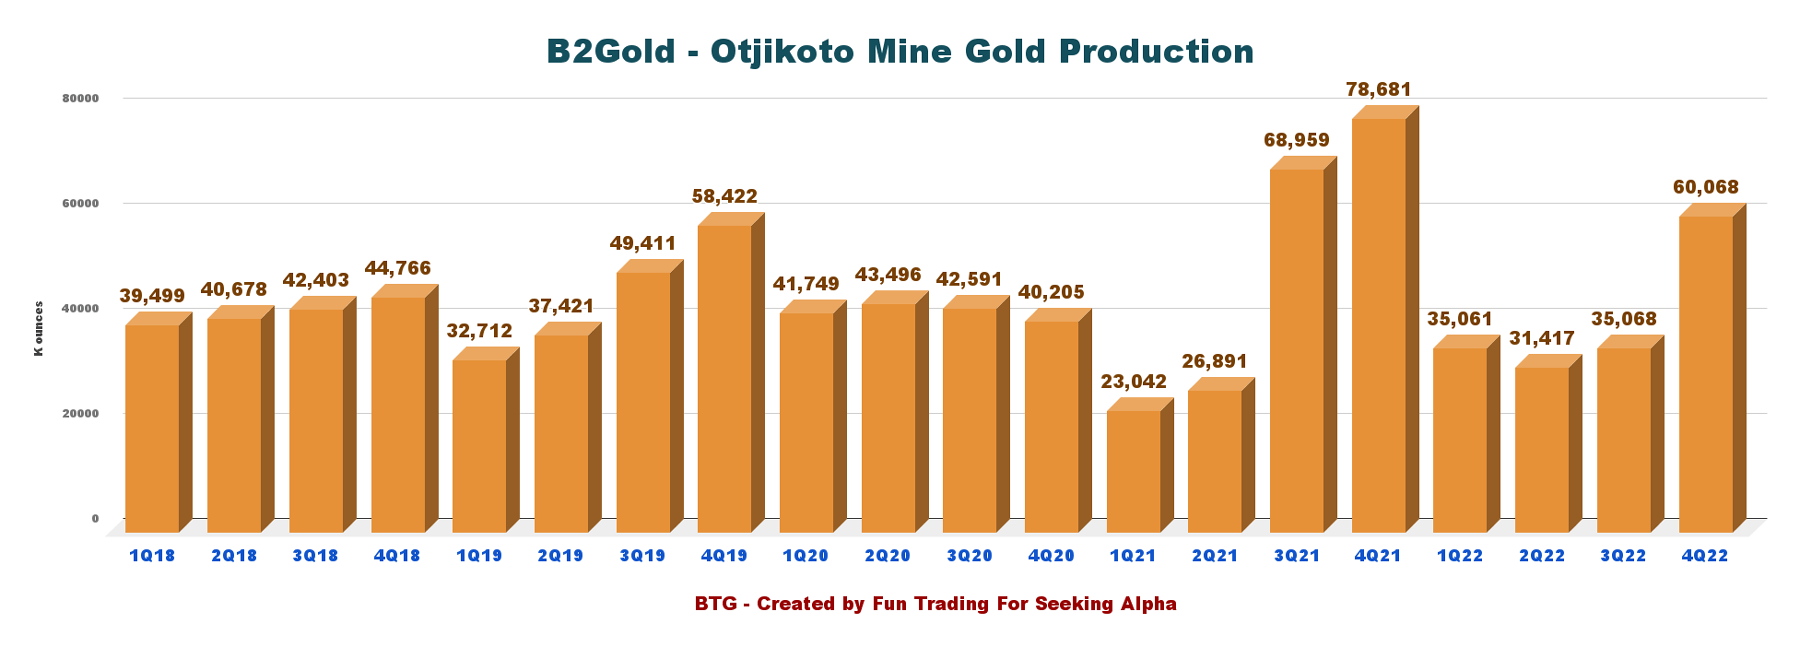
Technical Analysis And Commentary
BTG TA Chart short-term (Fun Trading StockCharts)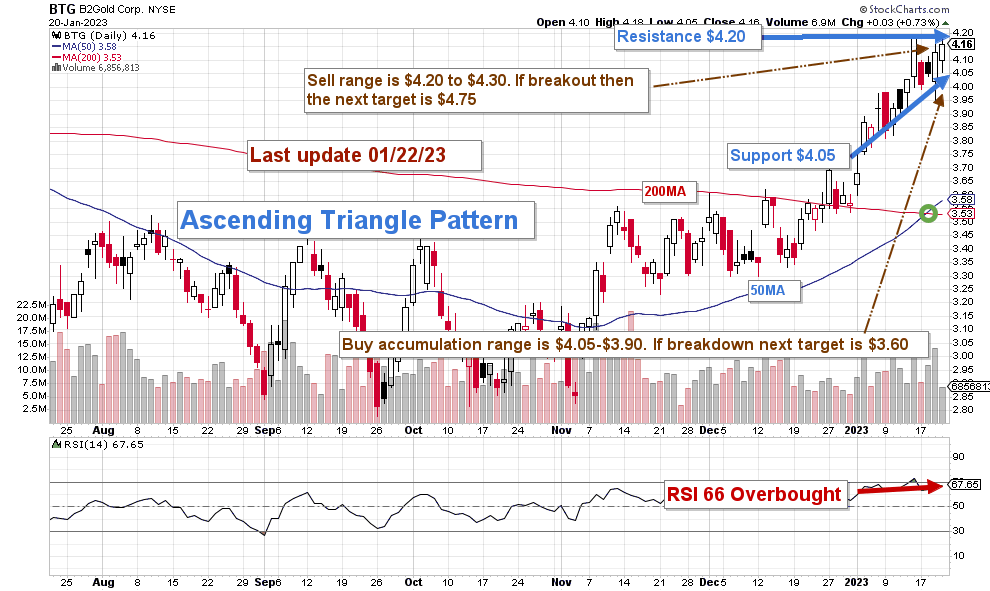
BTG forms an ascending triangle pattern, with resistance at $4.20 and support at $4.05. In general, ascending triangles are bullish formation that anticipates an upside breakout. However, a lot will depend on the FED decision on interest rates on January 29.
The short-term trading strategy is to trade LIFO for about 50%-60% of your position. I suggest selling between $4.20 and $4.30 with possible higher resistance at $4.75 and waiting for a retracement between $4.05 and $3.90 with possible lower support at $3.60.
Inflation is regressing from the record in 3Q22, and the market believes the FED will start to reduce significantly its action on the interest rates with potentially a pause in H2 2023. The gold price has turned bullish since December with the expectation that the FED will turn dovish and may hike two times 25 points in 2023 before pausing. This idea does not totally persuade me, but it is possible.
USA inflation rate in 2022 (From Trading Economics)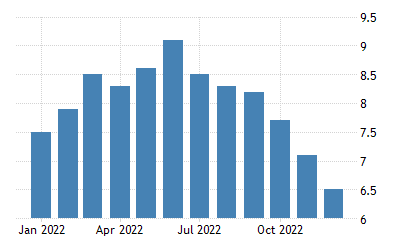
Gold and silver have turned bullish in December based on this assumption. Gold is up nearly 5% YoY. However, if the Fed decides to hike interest rates by 50 points against the consensus, the gold price could retrace significantly, and the gold miners with it. Thus, be careful and watch the gold price like a hawk.
BTG Gold, Silver, and Copper one-year Chart (Fun Trading StockCharts)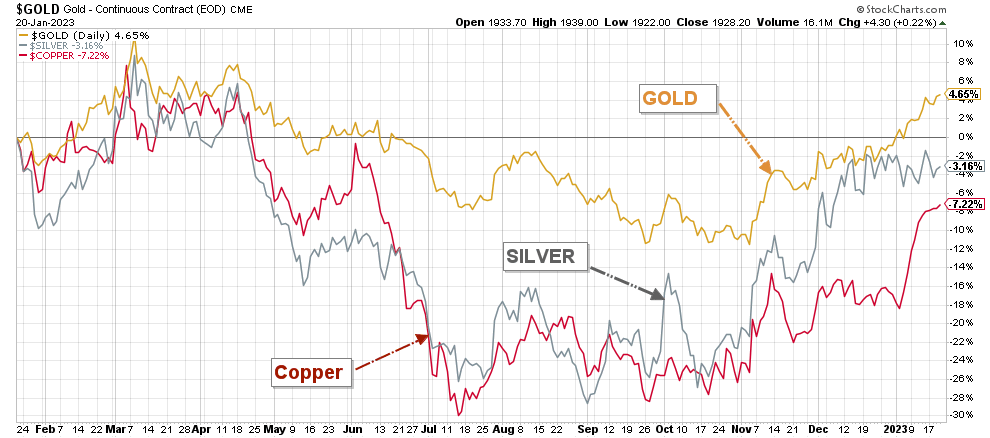
Warning: The TA chart must be updated frequently to be relevant. It is what I am doing in my stock tracker. The chart above has a possible validity of about a week. Remember, the TA chart is a tool only to help you adopt the right strategy. It is not a way to foresee the future. No one and nothing can.
Author’s note: If you find value in this article and would like to encourage such continued efforts, please click the “Like” button below to vote of support. Thanks.
Be the first to comment